Crypto Trading by Identifying Support and Resistance ]-Steemit Crypto Academy | S6W3 | Homework Post for @shemul21

Cover Page Created by me, @msquaretk | Made on imarkup
It's a new week in the Steemit Crypto Academy. This is the third week of the lecture. The past two weeks of lecture were awesome and the two weeks of trading competition were educative and insightful. Thanks to the Admins of the academy and he entire Professors. In this this post, I will be responding to the Week 3 of the assignment given by Professor @shemul21. I will be responding to the questions one after the other. Follow me closely.

What is the Support & Resistance zone?
In this first task, I'm going to be explaining support and resistance. This explanation will be based on trading and hence we should know that it's trading terminologies.
Support and resistance play major role in technical analysis and that's why traders are exposed to them and are one of the first things traders are being taught in the world of technical analysis. Because of its importance in trading, it's very essential that traders learn how to identify or recognize them on the chart.
Support and resistance are area where price actually have difficult of going lower or upper and bounces back from the area. When price reaches support area, it may stop and price goes higher from the area and when price reaches the resistance, it may bounces back and price turns to bearish. In essence, area support supports the price of an asset and that of resistance resists the price.
Because these areas are very special and key areas, sellers and buyers gather to take decisions there. Buyers are found at the the support area because they know the area is able to push the price higher due to the fact that price has had difficult in breaking the area in the past. Also, sellers are found at the resistance area because they are aware that the area is capable of pushing the price lower due to the past engagement of the sellers in the area which resulted in rejection of price in the area.
These areas called support and resistance are important areas in the market as they serve as entries and exits point in he market. Traders use these areas for entry as well as exit when they want to open a position in the market.
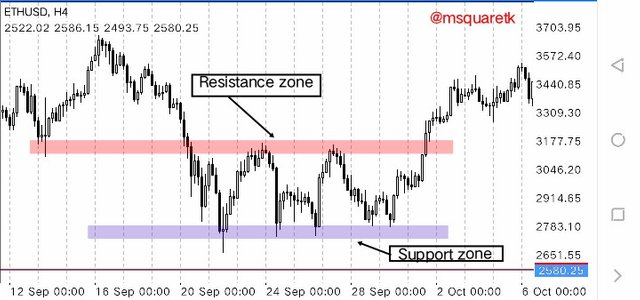
The screenshot below shows an example of support and resistance that formed on the chart of ETHUSD on H4 timeframe.
Screenshot from Mt4 App
In the screenshot above, you will notice I marked the area where price rejected and turned for both support and resistance with a rectangular box. This is how support and resistance should be treated. They are zone or area and not just a line. Some traders use line though, but it's important that we should seem them as zone.
Also, the example above is just a type of resistance and support. There are about three types. We will look at different types of support and resistance later in this post. It's also pertinent to know that support and resistance are not everlasting. They get broken when they are weakened as you see I the screenshot above. Meaning support can be broken and turn to resistance and resistance can be broken and turn to support.
2. Explain different types of Support & resistance with proper demonstration
In this task, I'm going to be explaining different types of support and resistance. Like I said earlier in the first question, support and resistance are of three types.
The three types of support and resistance are:
- Horizontal or Static support and resistance
- Sloping level of support and resistance
- Dynamic support and resistance
Horizontal or Static Support and Resistance
This is the one of the most known support and resistance, especially by the newbie in the crypto trading. Horizontal support and resistance are formed when the price is in a range. Meaning when the price is going through a kind of pause in the market. These support and resistance often form as a result of dragging of price between the sellers and the buyers.
It's pertinent to know that support can get broken and resistance can also get broken when they are weakened. Resistance can turn to support and support can turn to resistance.
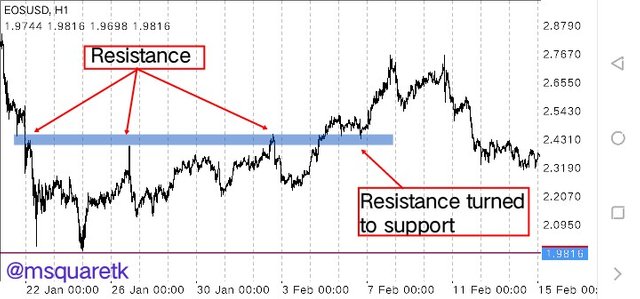
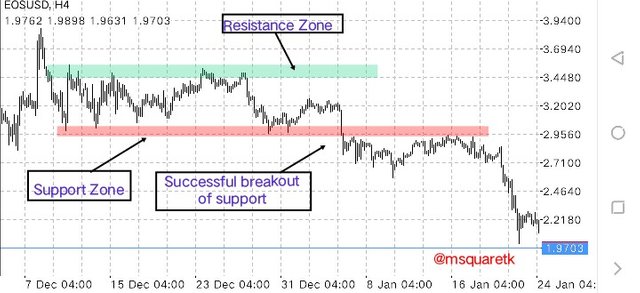
The screenshot below shows support zones drawn on the chart of EOSUSD, H1 timeframe. As the price keeps touching this zone the price keeps rejecting the area. Then, it gets to a point when the price broke the area and the zone turned to support for the price. See he screenshot below.
Screenshot from Mt4 App
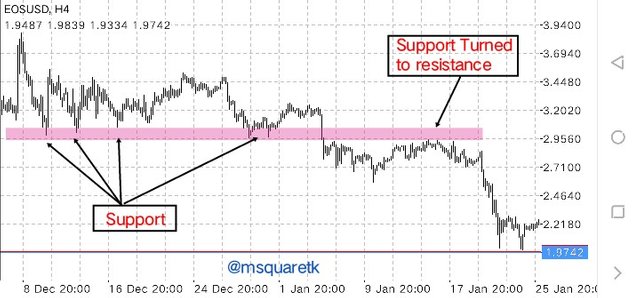
Also, in the screenshot below, the price has been supported by the support zone marked I the screenshot. We can see how the price hits the area and rallied to the upside. To draw support and resistance properly, traders must learn to identify where the price hits and reject multiple times. At least three touches must occur to draw support and resistance.
Screenshot from Mt4 App
Having seen this, let's see sloping level of support and resistance.
Sloping level of support and resistance
Sloping levels is another important type of support and resistance which traders use to predict the direction of price. Trendlines are often used here to tame the price. Unlike horizontal support and resistance which is formed during a ranging market sloping of support and resistance are formed when the market is trending. And that is why trendline is used to draw these levels.
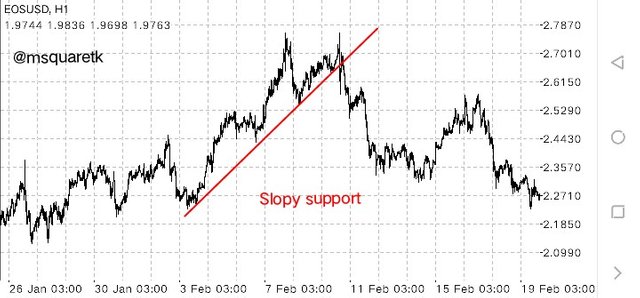
To identify support level, market must be trending in an upside direction. We know that during an uptrend market, the price will be making higher highs and higher lows. The higher lows are pull backs to the highs being made. Higher lows are also known as retracement and it's the time when the sellers take over the market for a short time before buyers resume the market.
The higher lows act as the support during the uptrend. It supports the price and the price rally to the upside as it touches this area. To draw support correctly during the uptrend, three touches of higher lows must be identified and connected together.
Screenshot from Mt4 App
To identify resistance level, market must be trending in a downside direction. We know that during a downside market, the price will be making lower lows and lower highs. The lower highs are pull backs to the lows being made. Lower highs are also known as retracement and it's the time when the buyers take over the market for a short time before sellers resume the market.
The lower highs act as the resistance during the downtrend. It resists the price and the price rally to the downside as it touches this area. To draw resistance correctly during the uptrend, three touches of lower highs should be identified and connected together.
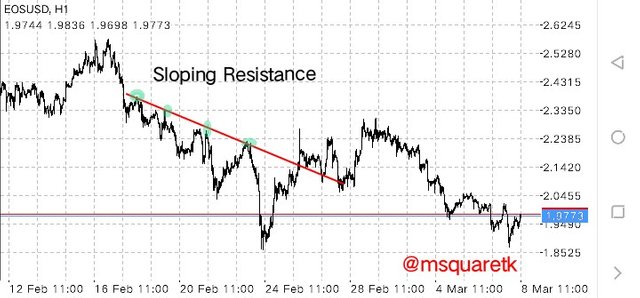
Screenshot from Mt4 App
Dynamic support and resistance
This is another type of support and resistance which traders use on the chart to predict the direction of price. This type of support and resistance is formed by using moving averages indicator. Mostly, three moving averages are combined on the chart. These moving averages are of different periods.
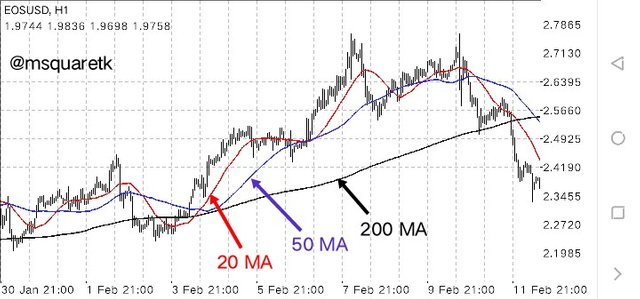
For example, traders can use 20, 50 and 200 moving averages on the chart to see how price reacts to these indicators. In the screenshot below, I have added these three moving averages. Any type of moving averages can be added to the chart depending on trader's strategy.
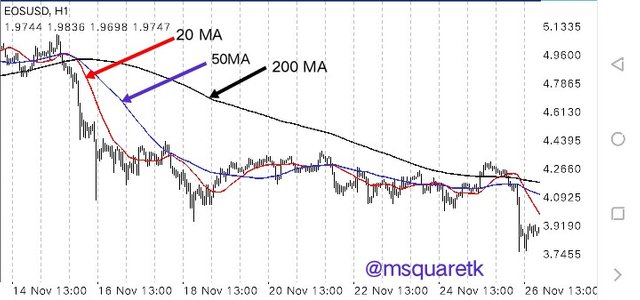
The moving averages period of 20 and 50 period are short periods moving averages. When the price approaches the shortest, 20 MA, it signifies that the healthiness of trend and when it touches 50 MA, the price is about to make another long or short run. When the price crosses 200 MA, there is likely going to be reversal in the market.
The screenshots below shows the downtrend and uptrend condition of when these moving averages are added to the chart.
Screenshot from Mt4 App
Screenshot from Mt4 App
3. Identify The False & Successful Breakouts. (demonstrate with screenshots)
In this part of the task, we will be examining false and successful breakouts. If you remember in the previous task, I told you that we could have a break of the support zone and resistance zone. When the price of an asset breaks the support or resistance zone in such a way that support couldn't support and the resistance could not resist the price, then it's called breakout.
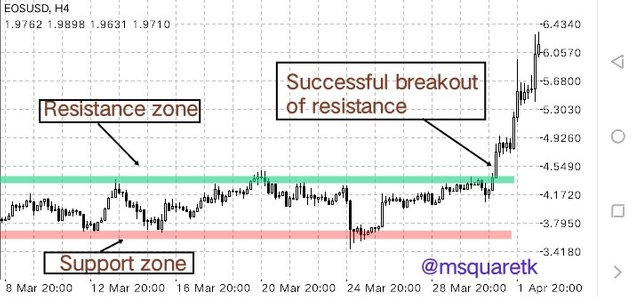
The breakouts of support and resistance could be successful or false breakouts. When the price breaks the support zone and goes in a downtrend trend in such a way that the support that's got broken now serves as a resistance, then that type of break is called successful breakout. The same with a resistance that gets broken and the zone acts as support which pushes the price even more higher. That's also called successful breakout.
Screenshot from Mt4 App
In the screenshot above, you can a successful break of the support zone. As the price breaks the support zone, it retested the place and now acting as the resistance zone. Traders can take a sell order when the price breaks this area and retested. The aggressive traders will open an instant sell position without waiting for the retest of this zone.
The screenshot below shows an example of a successful break of a resistance level. But in this case, there's no retest of he area. This means it's not every breakout that will retest the zone back. Conservative traders may miss out on this since they will be waiting for price to come and retest the area. Sometimes strong break of the zone may not let the price retest the area.
Screenshot from Mt4 App
A false breakout of support occurs when the price breaks below the support zone and price comes back quickly and rally above such support back, and the support now pushes the price back to the upside. Most of the times, when this happens, institution traders are always behind such move in the market. They will want to deceive the retail traders to believe that the break of support is real.
Screenshot from Mt4 App
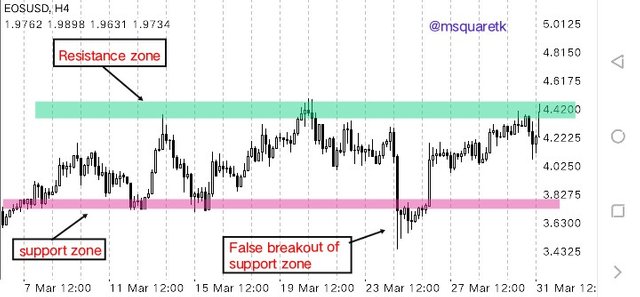
A false breakout of resistance occurs when the price breaks above the resistance zone and Immediately comes back and rally below such resistance back, and the resistance now pushes the price back to the downside. Institution traders and whales are always behind such move. They will want to deceive the retail traders to buy the asset when it breaks the resistance zone.
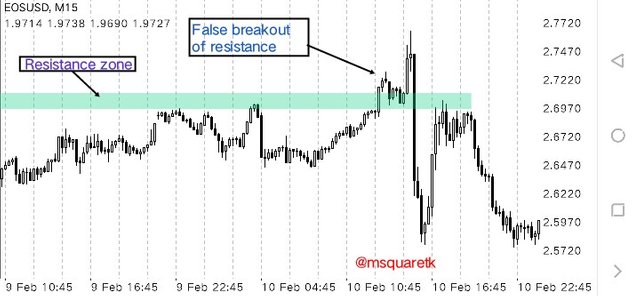
Screenshot from Mt4 App
4. Use Volume and RSI Indicator Combined with Breakouts & Identify the Entry Point. (demonstrate with screenshots)
In this part of the task, I'm going to be using volume and RSI and combined with the breakout strategy to identify entry point in the market. RSI indicator is one of the most popular indicators which traders use in technical analysis. It shows when the market overbought and oversold. When it's above 70 scale, it means the price is overbought and there may be bearish move. And also when it's Belo 30 scale, it's oversold and there may be a bullish move. For this strategy, we aren't going to use overbought or oversold, rather we will use 50 scale.
Volume Indicator is also one of the most important and useful indicator in technical analysis. It shows the volume in the market. I'm going to combine these indicators with the breakout and identify the entry.
This is how the strategy works. Firstly, we will identify different types of support and resistance on the chart. This is very important. Then we will add RSI and volume indicator to the chart. Now, after identifying these key levels, support and resistance, then we will wait for breakout of any of these zone depending on where the direction of the price follows.
Now, if a breakout of the resistance occurs, and the RSI is seen cross the 50 scale above, and the there's increase in volume, then a buy entry could be made.
And if a breakout of support occurs, and the RSI is seen cross below the 50 scale, and there is increase in volume ,then a sell entry position could be made.
For example on the chart below, I identified a short bearish with a black trendline and a key resistance level with a red horizontal line. The price broke the trendline which is a signal that the short bearish move is over and later broke resistance level with a great momentum. Immediately this break occurs, RSI is seen cross above 50 scale and the volume increases. Entry can be made at the break of this support level and stop loss can be placed below the level while the take profit can be placed at a nearest resistance level. See the screenshot below.
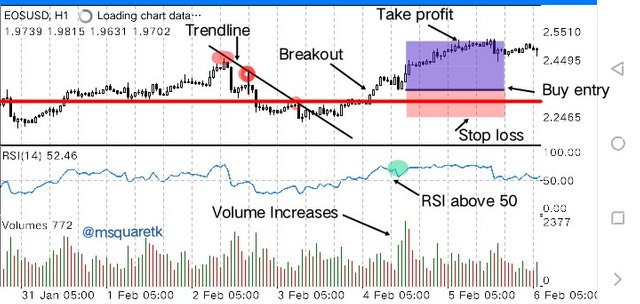
Screenshot from Mt4 App
For a short position, we must see a breakout of support zone with a great volume. Then RSI should cross below the 50 scale and an increase in volume be seen in the volume indicator window. That's exactly what happened on the chart below. The market has been in a consolidation for sometime. Then a breakout occurs and RSI crossed below 50 scale and there was increase in volume.
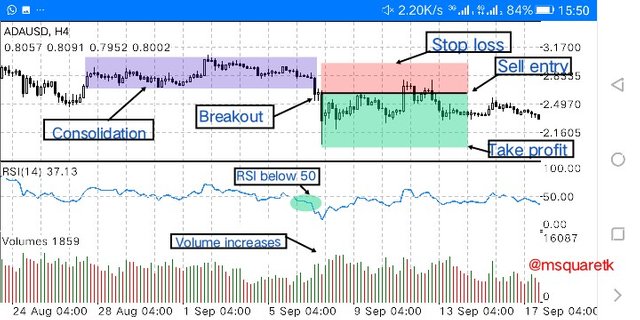
Screenshot from Mt4 App
5. Take a Real Trade(crypto pair) on Your Account After a Successful Breakout. (transaction screenshot required).
In this part of the task, I'm going to be taking a real trade using the strategy of breakout. I will be combining RSI and volume Indicator with the breakout to filter the breakout. This will enable me to judge if the breakout is valid or false breakout.
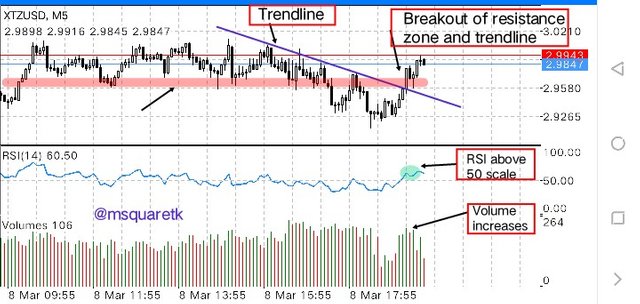
On the chart of XTZUSDT, the price is seen to break the trendline of the short bearish run that's indicated by a blue trend line. Then there is a resistance zone which is very close to that area. The price rallied up and broke the resistance zone. This is another indication that the price is likely going to continue to the upside.
Then, seeing the breakout of the resistance zone, the next thing I did was to confirm the breakout using RSI and volume indicator. RSI Indicator line is seen above the 50 scale. That signifies an uptrend. Then looking at the volume indicator, I saw an increase in volume. Increase in volume signifies strength in the direction of breakout. See the screenshot below.
Screenshot from Mt4 App
Having filtered the breakout with RSI and volume, I opened an instant execution at the current price of $2.9840 and stop loss was placed below the resistance zone that got broken at $2.942 and take profit was placed at the nearest resistance level at $3.058
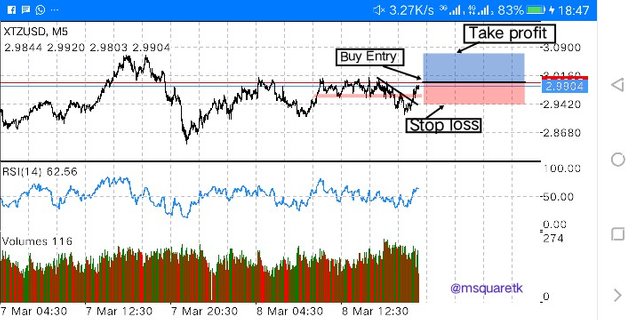
Screenshot from Mt4 App
Now, having gotten the entry and exit price levels on my MT4 App, I opened a real trade on my binance exchange app using the margin trading option. The trade was executed at the market price and the stop loss and take profit was set appropriately. See the screenshot below.
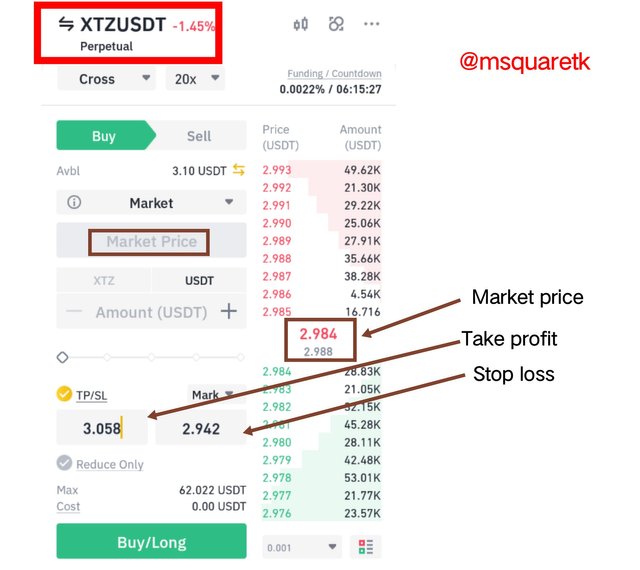
Screenshot from Binance App
Then, after the execution of price, the screenshot below was taken. The trade just started running at this time.
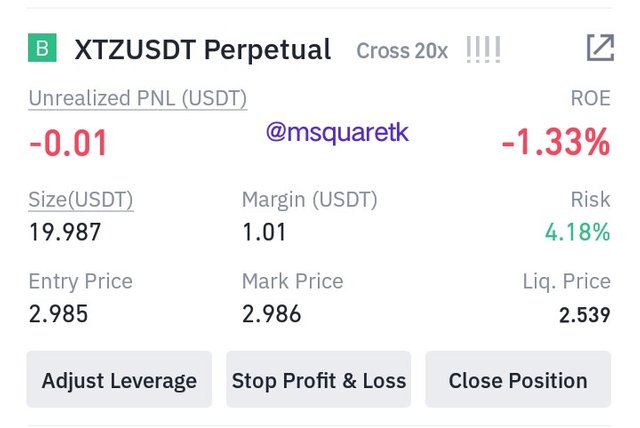
Screenshot from Binance App
Then some minutes later, the price is already going in the predicted direction. The trade is in profit already.
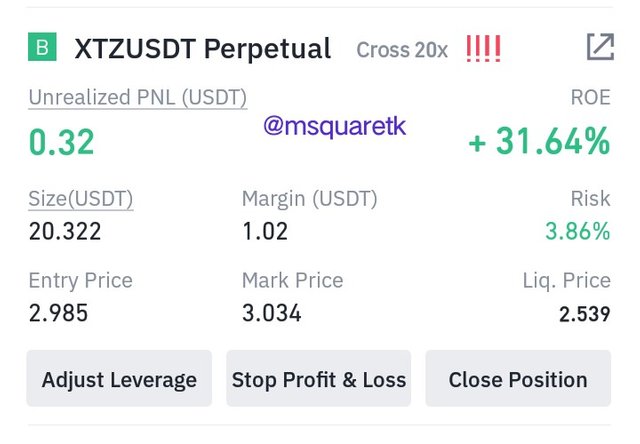
Screenshot from Binance App
The trade is almost at my take profit. I will monitor this trade and see how it ends.
6. Explain the Limitations of Support & Resistance (false breakout).
Support and resistance like other technical tools has its own limitations. Like I said, no support or resistance is everlasting, they get broken when they are weakened. But sometimes, they give false breakout. False breakout is the main limitation of support and resistance.
False breakout of support occurs when the support gets broken but the price doesn't go lower as expected, instead the price goes above the support and continue the bull move.
False breakout of resistance occurs when the price breaks above the resistance but doesn't continue going up, instead the price comes below the resistance and continue the bear move.
Traders must be very careful when trading the breakout off support and resistance so as not to get caught. False breakout may be due to the activity of whales or institution trying to induce the retail traders. So it's important that retail traders fiter the signal of this breakout before opening the position.
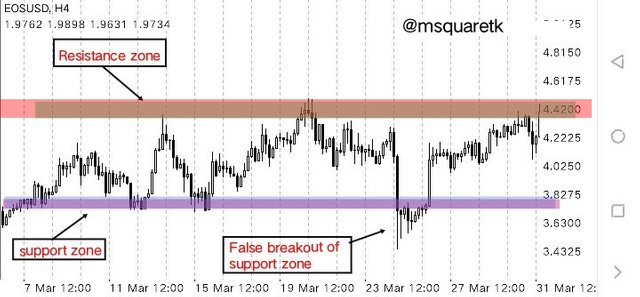
Screenshot from Mt4 App
In the screenshot above, you can see a false breakout of the support that occured. If the traders had opened a sell position at the breakout of this support, the price would have reversed against them. It's important that traders are aware of this and use other indicator to filter the breakout.
In addition, support and resistance are used for entry and exit. Sometimes using them as exit may increase the risk. For example if the stop loss level is very far than the take profit, then you have exposed your trading capital to risk. It's better not to take a position in which your stop loss is more than take profit. That's when your risk higher than your profit, don't trade.
Conclusion
Support and resistance and very important in technical analysis. In fact, they are referred to as the basis in which other technical strategies are based. It's important that traders identify the zone or area of support and resistance on the chart before they start trading.
There are three types of support and resistance. We have horizontal or Static support and resistance, sloping levels of support and resistance and dynamic support and resistance. The last two types work well in a trending market while the first one is when the market is ranging.
It's important that traders combine other technical tools or indicators with the breakout to filter the false breakout. Technical indicators such RSI, volume, MACD can be combined with support and resistance for more effective and efficient analysis and prediction. Thanks to Professor @shemul21 for this educative and insightful teaching.
CC: @shemul21
Written by @msquaretk