Crypto Academy / Season 4 / Week 1 / Homework Post for Professor @allbert – Trading with strong levels and gap levels.

Hello steemians
It's the first week of the season 4 in the crypto academy. I'm extremely happy that academy has resumed her season 4. The last season was full of experiences about how to use blockchains and crypto trading.
This post is homework post for Professor @allbert. He taught "trading with strong and weak resistance and support and gap levels."
At the end of the lecture, he gave five questions for homework. The question is posted below.
- Graphically, explain the difference between Weak and Strong Levels. (Screenshots required) Explain what happens in the market for these differences to occur.
- Explain what a Gap is. (Required Screenshots) What happens in the market to cause It.
- Explain the types of Gap (Screenshots required, it is not allowed to use the same images of the class).
- Through a Demo account, perform the (buy/sell) through Strong Supports and resistances. Explain the procedure (Required Screenshots).
- Through a Demo account, perform the (buy/sell) through Gaps levels. Explain the procedure (Required Screenshots)
So, I will be taking this questions one after the other. Please, follow me closely.

1. Graphically, explain the difference between Weak and Strong Levels. (Screenshots required) Explain what happens in the market for these differences to occur.
In finance trading, levels refer to an area called support and resistance. These areas are sometimes called zone. Levels may be strong or weak.
A strong level refers to a support or resistance zone where price rejects many times. Once price reaches the area of strong levels, an asset tend to shift in trend. For example, if the price of an asset is in an uptrend and meets a strong resistance, the price of an asset will bounce back because it encounters a barrier called resistance that tends to shift the trend.
A weak level on the other hand is an area of support or resistance which is very weak. This area doesn't have a high tendency to push the price of market in reverse direction. Though, price may have rejected the area once or twice before, but because it is weak, once price of an asset reaches this level, it tends to break it because it is weak.
Let's look at the screenshot below.
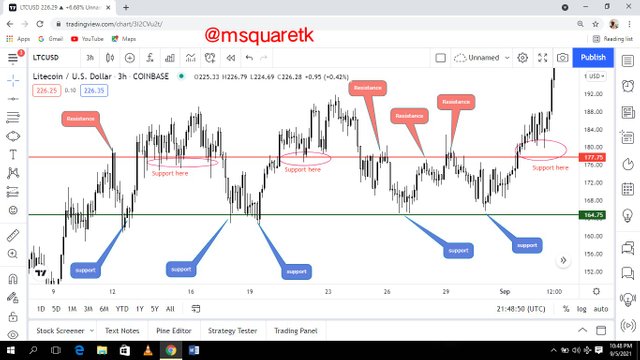
Fig. 1: Strong levels | tradingview.com
In figure 1 above, it can be seen how the price of an asset rejects a particular area many times. See all the places indicated by "support" in the figure above. Also, we can see that the area indicated with "resistance" in the figure above is a strong level because the price of an asset rejects the area multiple times.
As it can be seen, I represented these levels in the figure above with the use of horizontal line. It's however be noted that, in the real sense, the level is not a point, it is a zone.
For you to know strong levels, look for an area where multiple rejections occur. For example, in the figure above, we can see that the second horizontal line indicated by where call out text "resistance" and circled support is pointing to is very strong level. That place served as support and resistance. In essence, a strong resistance level may turn to support level.
What does weak levels look like? Let's see the screenshot below.
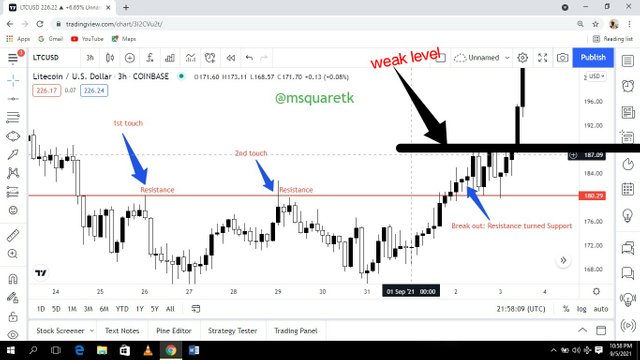
Fig. 2: Weak Level | tradingview.com
In figure 2 above, we can see that the price of an asset rejected a certain place twice, indicated with a red horizontal line. The price did the first touch of the area and moved down and the second touch and the price moved down, the third time, it broke the area, turning that resistance to support. That area is relatively strong. But if you look at the top area marked with black horizontal line, the price just broke the area, in fact, it didn't retest it. That place is a weak level.
In essence weak levels are area of support and resistance which are weak, that's they don't have tendency to reject the price of an asset many times.
So, it can be seen that the area or level in the figure 2 above broke after the price approached the place the third time. That level is a weak level compared to the one we saw in figure 1 which has a multiple rejections and in which the price bounce back on getting to the level.
For strong level to occur in the market, it means the levels have been a place where traders have placed multiple pending orders of buy and sell. When there are multiple orders in an area or level, it tends to create liquidity at the place and as such the price of an asset actually has problem to continue its movement here, rather it tends to reverse in another direction. The strength of this level depends on the number of buyers or sellers, especially whales who are willing to enter the market at that particular time.
For a weak zone, pending orders of buy and sell are also placed in the level, but just that the it not as much as that of a strong level. Because the pending orders placed at the level is not much to rejects the price because the volume and liquidity is not enough, it is easily broken and the price continue to rally up or down in the same direction it's going.
2. Explain what a Gap is. (Required Screenshots) What happens in the market to cause It.
Gap is a termed in finance trading when a jump is made by the price of an asset. Normally, an ideal price of an asset should move in the sense that the opening of a candle corresponding to the closing of the previous ones. However, there are times when the opening of the next candle will go far away from the previous close, leaving a very large space between the two candles.
It is pertinent to know that gaps occur both in a downtrend and uptrend. It is also important to know that there can be gap up or down.
Gap up occurs when the price moves very quickly up leaving space between the previous candle and the new candle that just formed. The screenshot below showing an example of a gap up.
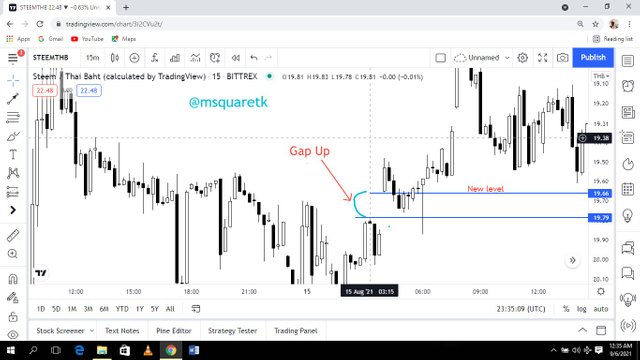
Fig. 3: Gap Up | tradingview.com
In figure 3 above, we can see that gap up occurred on STEEMTHB. As soon as the gap occurs, it will create a new level in the market. Sometimes, the gap may be filled immediately and other times, it may take a long period of time for a gap in the market to fill itself.
Also, Gap Down occurs when the price of an asset moves very quickly down, forming a candle in which the opening is very far away to the closing of the previous candle. That's there's a significant space between the previous candle and the new candle that just formed. Let's see the screenshot below for an example of a gap down in the market.
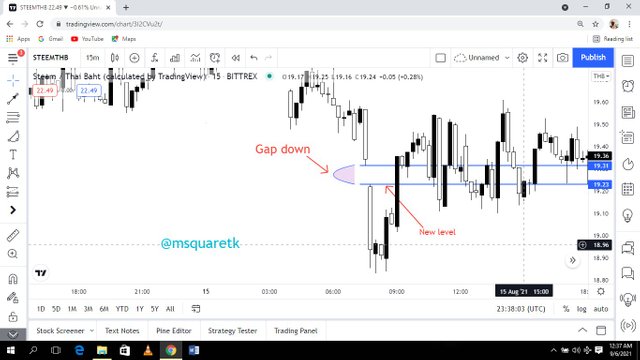
Fig. 4: Gap Down | tradingview.com
In figure 4 above, we can see that a gaap-down occurred on the chart of STEEMTHB. A gap will create a new level in the market.
What happens in the market to cause It?
Gaps are created in the market as a result of great momentum or high volatility to a side. Volatility is a term used for the movement of price. A quick or sudden movement of price results in high volatility.
Gaps in the market actually occurs when the price of an asset opens to a side far higher than it is expected as a result of a quick response of sellers or buyers to that side which is often due to the factors such as exchange rate, fundamental news etc of the cryptocurrency pair in view.
In essence, before a gap can occur, the price of an asset must moves very quickly to a side. And the new candle that forms must be very far away to the previous one. And it's actually due to some factors such as economic or fundamental news, rate etc.
3. Explain the types of Gap (Screenshots required, it is not allowed to use the same images of the class).
There are three types of gap. Namely:
- Breakaway gap
- Runaway gap
- Exhaustion gap
Let's look at these types of gap one after the other.
Breakaway Gap.
Breakaway Gap is a type of gap that's created to break the immediate structure the price of an asset is currently respecting. Let's see the screenshot below.
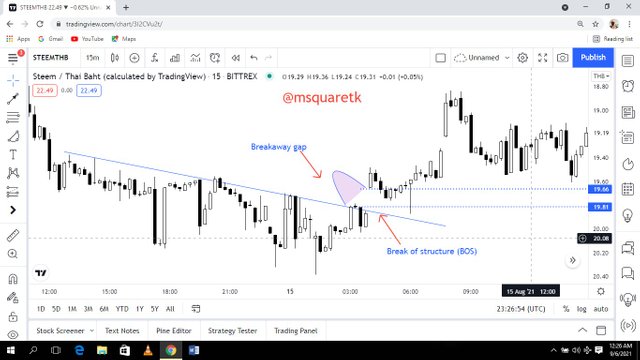
Fig. 5: Breakaway Gap | tradingview.com
Figure 5 above shows that the market was in a downtrend indicated by a blue trend line. And as it can be seen, the gap occurred and broke the the immediate structure of that an asset.
Breakaway gap often signifies a reversal in trend as price of an asset will shift the phase from the previous structure and try to create a new one. Also, the level the gap created is strong resistance and support zone.
Let's look at the other type quickly.
Runaway Gap
Unlike breakaway gap, this type of gap occurred right in the middle of the current trend. It is gap that occurred which leads to continuation of the trend. Let's see the screenshot below.
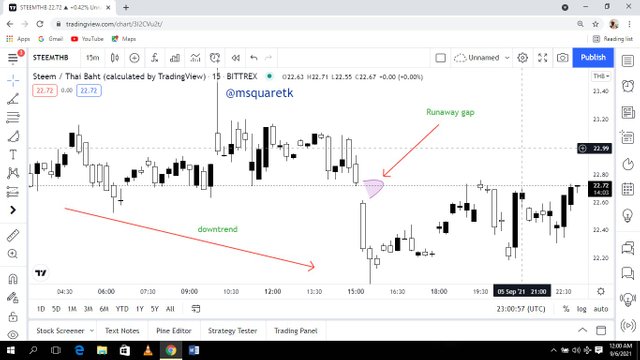
Fig. 6: Runaway Gap | tradingview.com
Figure 6 above shows an example of run away gap. As it can be seen, the gap occurred and the price continued its direction. It is important to note that, sometimes the gap may be filled immediately before the price continue the movement and other times, it may just be rally in the direction which it is going without filling the gap.
Runaway gaps are not easily seen because of their formation. And such, their level may not be as strong as that of breakaway gaps.
Let's quickly look at the last type of gap before we see another thing entirely.
Exhaustion Gap
Exhaustion Gap is a type of gaps that occurs at the extreme peak or lowest area of a trend. Thus the term "exhaustion." It's known that when the price of an asset is oversold or overbought, it will tend to reverse. When a gap is therefore formed when the price is oversold or overbought, then the gap is often referred to as exhaustion gap.
The gap, exhaustion is sometimes confused for runaway gap. The better way to know if the gap is an exhaustion gap or not is to wait and let the process be complete. The screenshot below shows an example of an exhaustion gap.
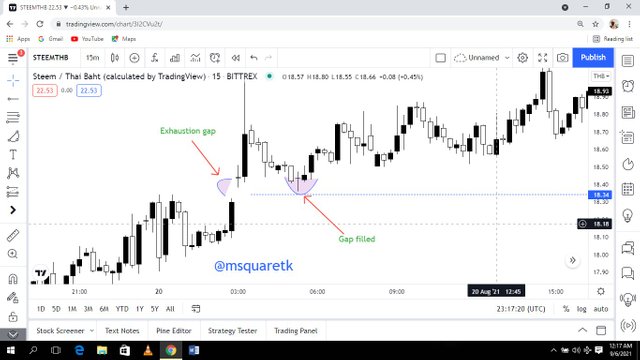
Fig. 7: Exhaustion Gap | tradingview.com
As it can be seen in figure 7 above, there's a great momentum upside as soon as the gap occurred and the presence of a long wick that formed also shows that the price is overbought. As it is seen, the price returned and filled the gap created.
4. Through a Demo account, perform the (buy/sell) through Strong Supports and resistances. Explain the procedure (Required Screenshots).
One of the best ways or strategies to trade strong supports and resistance is break and retest or bounce strategy(BRB).
The first demo trade I will show you here is the pair of LTCUSD. Let's see the screenshot below.
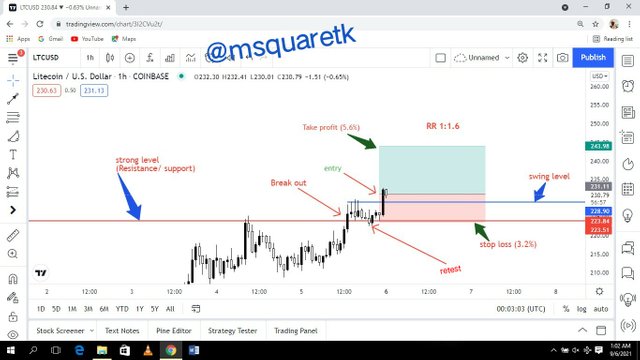
Fig. 8: Buy entry on LTCUSD Using BRB Strategy at Strong levels | tradingview.com
In the figure above, the price of an asset LTCUSD had rejected the a level indicated by a red horizontal line many times in the past, making that level a strong resistance level. But because we know that the strong resistance area can turn to support. So, the price later broke the level (indicated by "break out" in the diagram) turning it to a support level.
As it seen, the price retested the level indicated in the above diagram as "rest."
For a BRB strategy, we wait for the price to break, retest and then enter above the swing level created before the retest.
In the diagram above, as soon as I saw that the pair LTCUSD met the criteria, I entered at 231.11, stop loss at 223.51 and take profit at 243.98 indicated in the diagram as entry, stop loss, and take profit. And the risk reward ratio of the buy trade is 1:1.6
Note that the take profit is placed at the next significant resistance level that made it to be 1:1.6.
Let's see the trade on MT4 platform the way I took it.
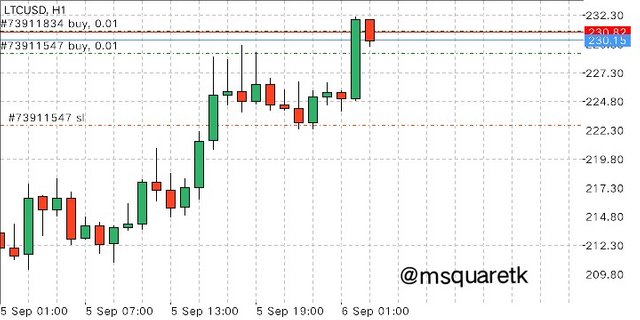
Fig. 9: Buy entry on LTCUSD Using BRB Strategy at Strong levels | Mt4 Platform
So, the trade is placed already. Let's see how it will go.
Some times after the execution of the trade, I checked the Mt platform to see how the trade is going. The trade has entered profit. See the screenshot below.
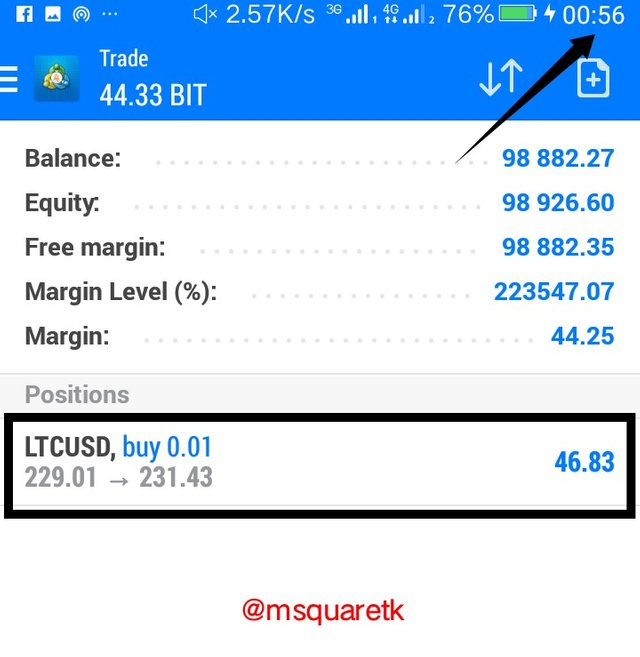
Fig. 10: LTCUSD trade result after some times | Mt4 Platform
The trade is still running at the time of writing this post. I will be monitoring it.
5. Through a Demo account, perform the (buy/sell) through Gaps levels. Explain the procedure (Required Screenshots
In this question, we are going to see a demo trade on STEEMTHB using gap trading. Let's see the screenshot below.
.png)
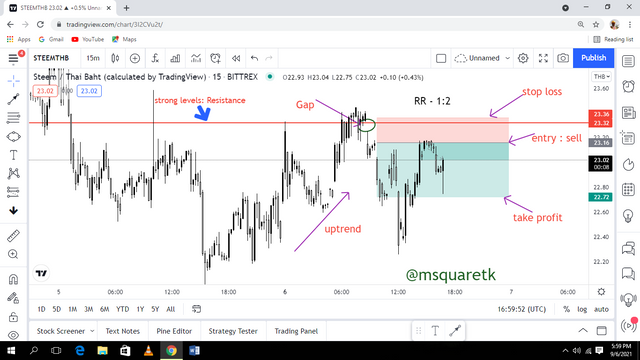
Fig. 11: Sell entry on STEEMTHB Using Gap trading | tradingview.com
In fig 11 above, the price of an asset, STEEMTHB encountered a strong barrier, a very strong resistance level and bounced back with a gap down. Also, the asset has been in an uptrend. As soon as the gap occurred, the trend shifted phase.
As soon as the gap formed, I entered a sell order (note that this is demo simulation) trade order at 23.16 the at the close of the new candle that formed after the gap. Stop loss was placed at 23.36 immediately above the gap. Take Profit was placed at 22.72 , a significant support level.
The RR of the trade is 1:2.
Let's quickly see another example where I entered a real demo trade with gap trading strategy on DOGEUSD. The screenshot below shows the chart of DOGEUSD.
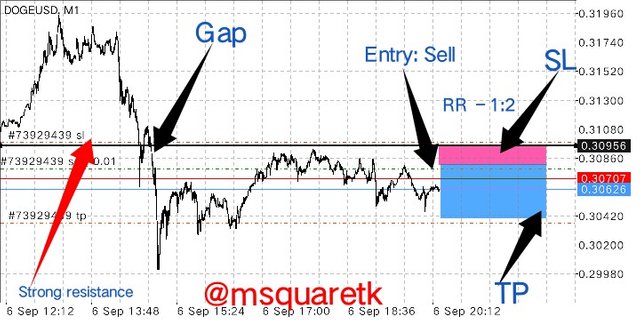
Fig. 12: Sell entry on DOGEUSD Using Gap trading | MT4 Platform
In figure 12 above, the price of an asset, DOGEUSD created a small gap after hitting a strong level. Although, the gap is spotted on a lower time frame. Let's see how well the strategy will work on a lower timeframe.
As the gap formed and the new candle closed, I executed a an instant sell order. I pit the stop loss an immediately above the gap. Take profit was placed at a place to have a RR of 1:2
Sometimes after the execution of the trade, I checked to see how the trade I doing. Let's see the screenshot below.
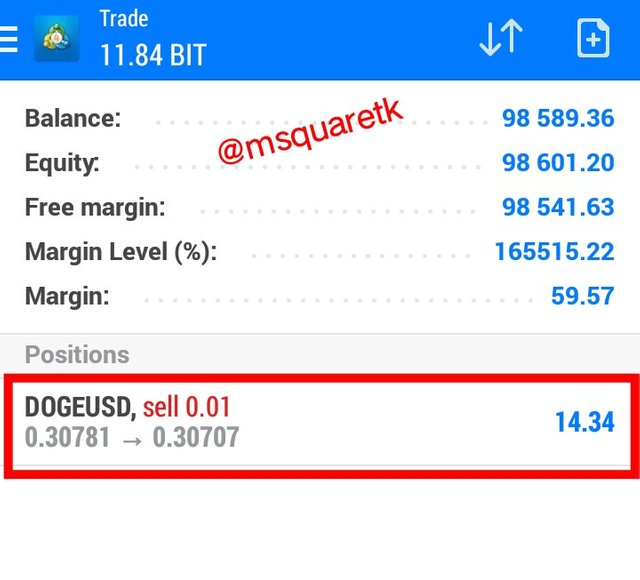
Fig. 13: DOGEUSD Running Sell trade (Gap trading) | MT4 Platform
It can be seen that the TR has entered profit. The trade is still running, though. But it's noted that this particular trade is spotted on 1min TF. Higher time frame will be much more reliable to trade any kind of strategy.
Conclusion
Levels, in finance trading, can be classified as strong and weak levels. They are usually area of resistances and supports. Strong resistance and supports levels are zones where there are multiple rejections of price over the time. These levels are usually due to a lot of pending orders placed by sellers and buyers which are expected to get triggered once the price gets to the level. As a result of a lot of pending orders, liquidity and volume are being generated, making the price to bounce back at the levels.
Weak levels are support and resistance levels that are not reliable, that's they are easily broken. There are pending order placed at these levels, too but because they are not much, the area or levels get weakened and broken.
Gaps in the market is another important thing to take note as they can be used as a place to to take trades and to exit the market. Gaps are formed as a result of jumps in price of an asset.
Thanks to Professor @allbert for the great lecture taught in a very simple way. I have been able to use the strategies, both gap and BRB strategy at strong levels to demo trade. And it's indeed great ones.
CC: @allbert
Written by @msquaretk
Your Post has been manually Supported/Up-voted by @steemingdiaries which is a Community & Curation account for Steeming Diaries Community.
Comments, Votes are performed an important role for Community, hence involved with your innovative Comments & Votes on other active users posts.
Community Latest Update: Steeming Diaries CONTEST Of The Month (September 2021) | Steemit FAQ