Crypto Academy / Season 3 / Week 8 / Homework Post for Professor @cryptokraze — "Trading Sharkfin pattern"

Hello everyone.
I welcome everyone into week 8 in the crypto academy. The past seven weeks have been awesome. It is with no doubt that week 8 has been running smoothly.
This is my first time attending advanced course. When I saw the the topic "Trading Sharkfin pattern," I went through it and realized I needed to know more about this pattern, I had to power up 55 steem so I can meet the minimum requirement steem power to be able to attend the class. I'm happy I could attend and submit the homework. Below is the screenshot showing my steem power before and after powering up.
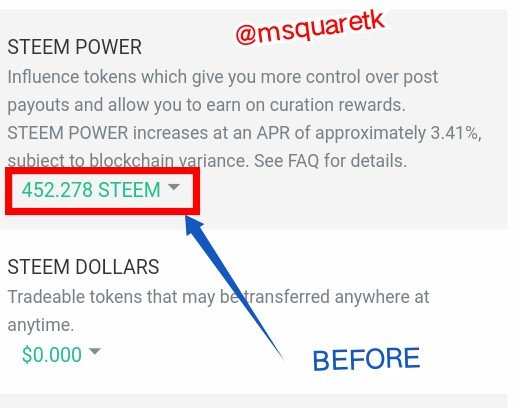
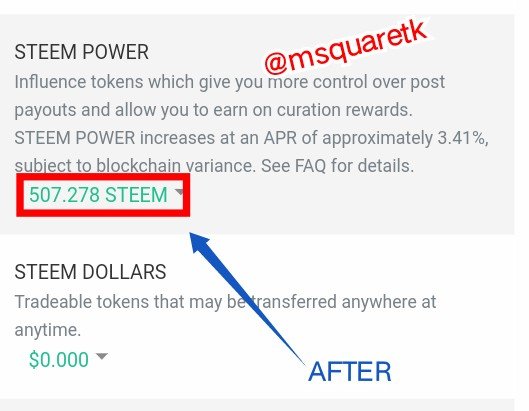
This post is a homework submitted to Professor @cryptokraze. He taught "Trading Sharkfin Pattern" and at the end of his lecture, he gave four (4) questions as homework work task.
The questions are:
- What is your understanding of Sharkfin Patterns. Give Examples (Clear Charts Needed)
- Implement RSI indicator to spot sharkfin patterns. (Clear Charts Needed)
- Write the trade entry and exit criteria to trade sharkfin pattern (Clear Charts Needed)
- Place at least 2 trades based on sharkfin pattern strategy (Need to actually place trades in demo account along with Clear Charts)
I will be attending to these questions one after the other.

Question 1
What is your understanding of Sharkfin Patterns. Give Examples (Clear Charts Needed)
In finance trading, there are two methods traders and investors use to predict the movement of price. These methods are fundamental analysis and technical analysis.
Fundamental analysis deals with the use of external event, financial statements, the features of an asset such as volume, capitalization etc to analyze the value of assets to be able to know or predict the future direction of the price of an asset. Technical analysis is a method which deals with the use of past price action seen on charts, technical indicators and other tools to analyze an asset to be able to predict the movement of price.
Now, the price action on the charts normally forms different types of patterns. These patterns are often use by traders to know when reversal or continuation of a movement will occur. So, in this post, I'm going to be talking about a pattern called "Sharkfin Pattern." This pattern is very unique, though not known by many traders. So, follow me closely as we journey together.
Detailed Explanation of Sharkfin Pattern
Sharkfin Pattern is a type of pattern that forms on the chart. This pattern forms when market moves very quickly to a side and reverse immediately leaving that place to be seen as V shape in a downtrend and as inverted V shape in an uptrend. This pattern called "Sharkfin pattern is a reversal pattern. Let me go deeper now.
Sharkfin Pattern in a downtrend occurs as a result of a great momentum or strength of sellers or bears to the downside and immediately, the bulls came in to the market to counter the strength of bears and they drive the price of the market upward with the same or higher strength/momentum than that of bears. The candlesticks formation at this place is like V shape formation. This pattern that leaves a V formation of the candlestick in a downtrend is a bullish reversal pattern.
Sharkfin Pattern in an uptrend is an exact opposite of that of downtrend. Here, the buyers or bulls move the price of an asset with a very great momentum up until they encounter a resistance or supply that immediately takes the price down with a very great momentum which may be the same or higher than the momentum of bulls. In essence, when buyers have greatly exhausted with the strength with which they come with, the sellers or bears quickly take over with immediate effect. As a result of quick reaction from the bears, the price of an asset leaves the area very quickly and the formation of candlesticks there on the chart is like inverted V shape.
Example of Sharkfin Pattern in a Downtrend
Now, to be able to understand this pattern very well, I will show you on the chart.
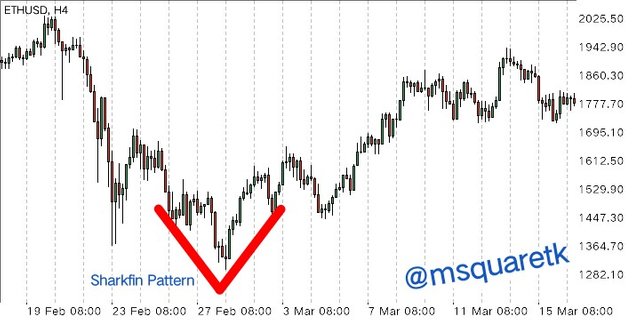
Fig. 1: Sharkfin Pattern in a Downtrend / Mt4 Platform
In fig. 1 above, you can see that the bears drive the price of market to the downside very quickly and all of a sudden, the bulls step in and quickly reverse the direction of the price. As it can seen, the place forms V shape on the chart. We can see that the market rally to the upside after this formation. This pattern is a bullish reversal pattern in a downtrend.
Example of Sharkfin Pattern in an Uptrend
Having seen an example of Sharkfin Pattern in a downtrend, let's quickly see how this pattern looks like in a downtrend. See the screenshot below.
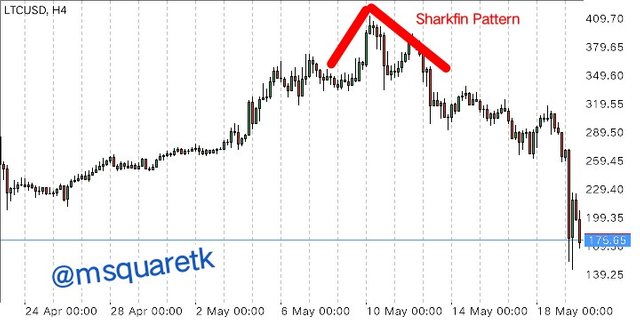
Fig. 2: Sharkfin Pattern in an Uptrend / Mt4 Platform
In fig. 2 above, we see how price of the market rally up with a very great momentum. The buyers or bulls moved the price with great volatility and immediately, the price reversed very quick on meeting a resistance leaving an inverted V shape formation to be seen on the chart. We can see that immediately the forms, price rally to the downside. This pattern is a bearish reversal pattern in an Uptrend.

Question 2
Implement RSI indicator to spot sharkfin patterns. (Clear Charts Needed)
In question one above, I have clearly explained how Sharkfin pattern is and how it looks like on the chart in both downtrend and Uptrend.
Now, because there is a need to have more than one reasons to take a trade. Traders are often feel confident when they have more reasons. Many reasons to take a trade is always termed as confluence in trading.
So, it is pertinent to know that you may spot Sharkfin pattern and enter the trade and the trade goes against you. But when you have at least one more confirmation, it will give you confidence that what has happened is really Sharkfin pattern. It is on this that I will tell you an indicator which you can use as a confirmation when you want to trade this pattern.
The recommended indicator by Professor @cryptokraze is relative strength index (RSI). RSI is a very good indicator which can be added to trade the pattern. It's good because it shows when an asset has been overpriced and low-priced. The recommended parameters for the indicator, RSI is 14 period, overbought region should be 70 and oversold period should be 30
The first thing to do is to make sure your RSI parameters are like that of the above parameters. See how my RSI parameters are set in the figure below.
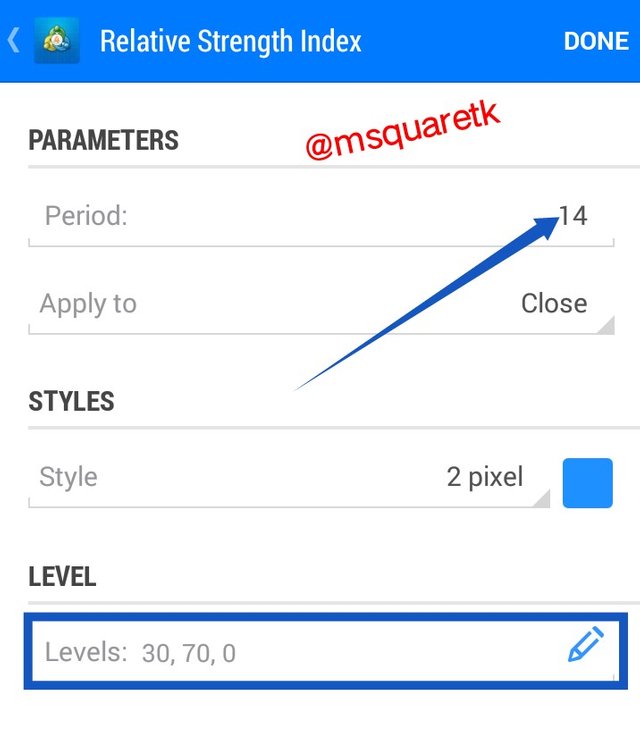
Fig. 3: RSI parameters / Mt4 Platform
Now having set the parameters right. Let's see how to use this indicator to spot Sharkfin pattern.
In a Downtrend
The image below shows an example of Sharkfin pattern formed on a chart and RSI at oversold region. See the screenshot below.
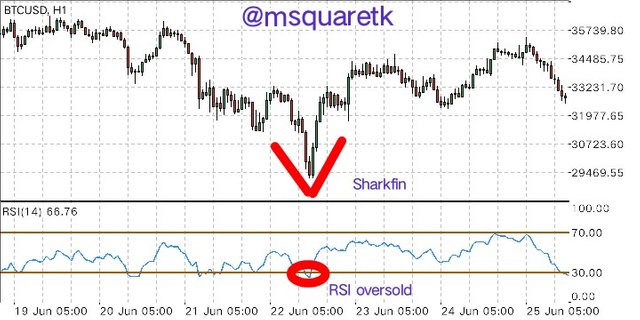
Fig. 4: The use of RSI oversold to Spot Sharkfin Pattern in a downtrend / Mt4 Platform
As I can be seen in fig. 4 above, the asset BTCUSD has been in downtrend and as the price move with a great momentum downward, it quickly turns back. This forms a V shape on the chart. Notice also that the RSI indicator entered oversold region. The oversold region is between 30 and 0. And as it can seen, the price deep down beyond 30 in the RSI. Once this happens, that is when the RSI deepens below 30 and move back above 30 , trade execution can be carried out. I'm going to talk more about this later. In essence, one must know that in a downtrend market, before the reversal will occur, price must move quickly and reverse immediately. Also, RSI must enter 30 level and beyond and move back quick above 30 level.
Let's see another example of this pattern by using RSI as a confirmation in a downtrend market.
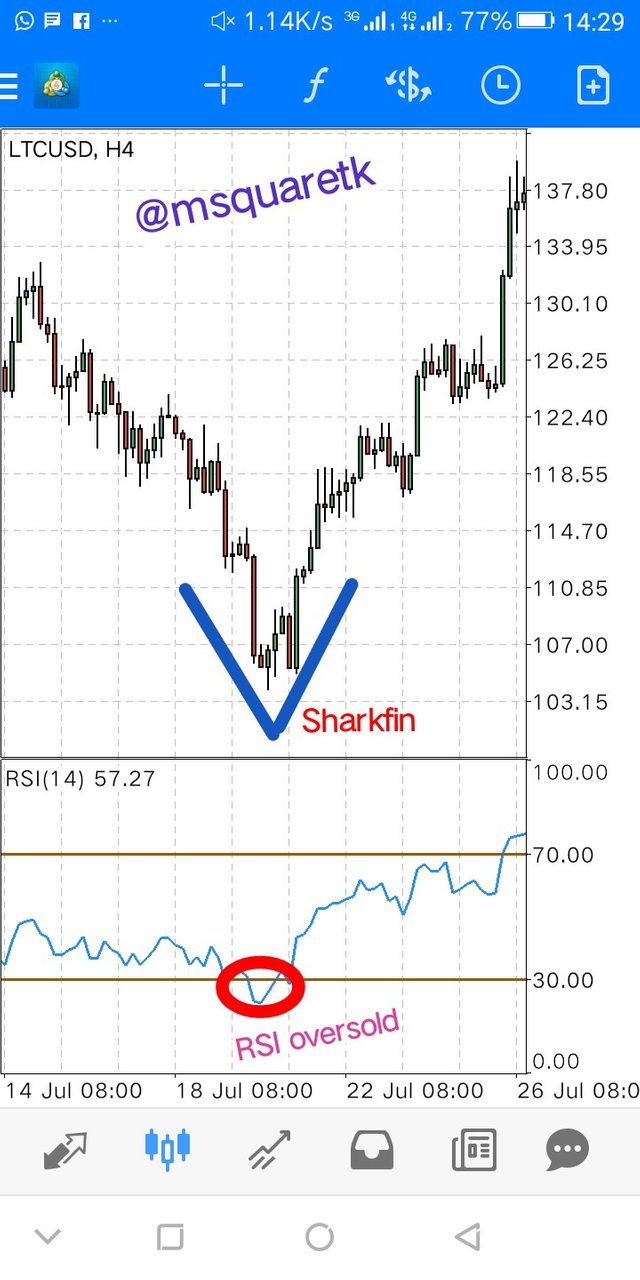
Fig. 5: The use of RSI oversold to Spot Sharkfin Pattern in a downtrend / Mt4 Platform
The chart of LTCUSD in fig. 5 above shows another example. We can see that RSI was oversold. The V shape has also formed on the chart.
In an Uptrend
Let's see how to use RSI together with Sharkfin pattern in an uptrend. See the screenshot below.
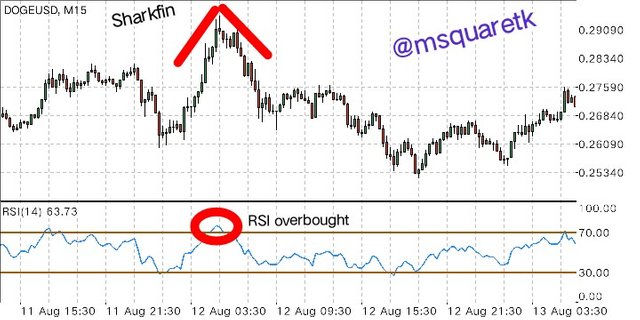
Fig. 6: The use of RSI overbought to Spot Sharkfin Pattern in an Uptrend / Mt4 Platform
As it can be seen in fig. 6 above, in an Uptrend market, the price moves to the upside with a very great momentum and immediately it encounters resistance, the price turn very quickly to the downside forming an inverted V shape on the chart. To be able to know if this pattern is real traders use RSI for confirmation. In this case, RSI must enter overbought region. That is, it must go beyond 70 level and rally back very quickly and go below 70 level. The movement must be a quick one.
As it can be seen in the figure above, the RSI entered overbought and Immediately go below 70 level.
Let's see another example in the figure 7 below.
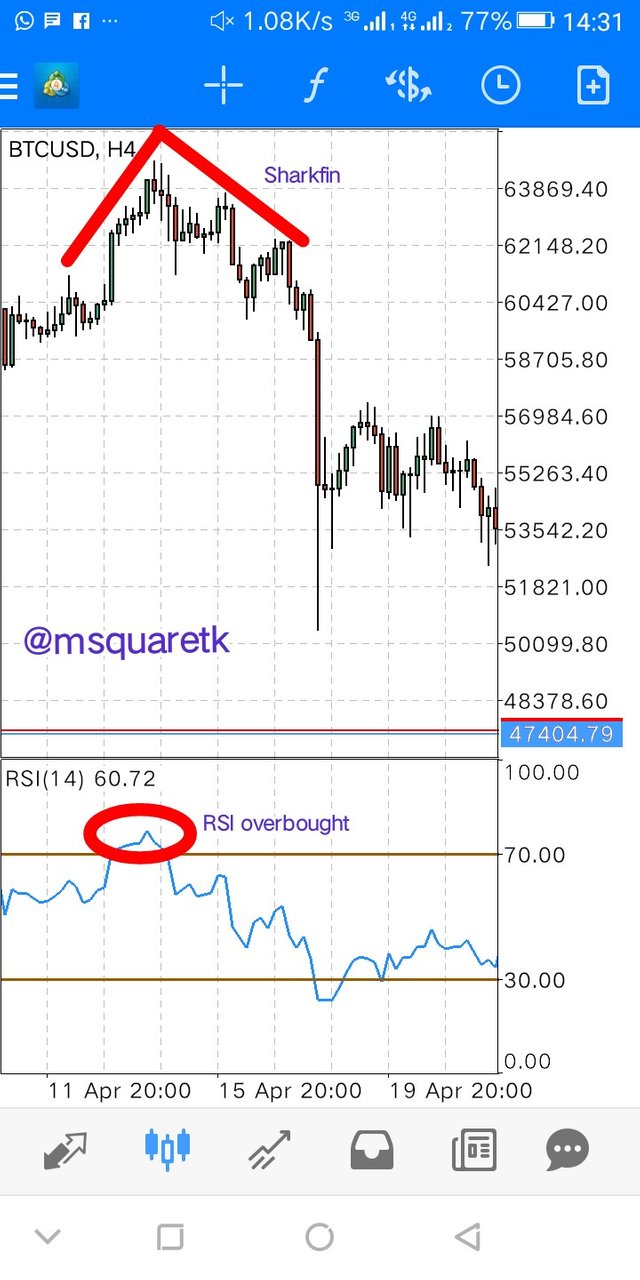
Fig. 7: The use of RSI overbought to Spot Sharkfin Pattern in an Uptrend / Mt4 Platform
In the the chart of BTCUSD in fig. 7 above, RSI overbought where the Sharkfin pattern occur, it is a confirmation that the pattern will reverse the market.
We can now clearly see the importance of RSI in the confirmation of Sharkfin pattern. RSI is very useful to combine with this pattern. Let memove to the next question.

Question 3
Write the trade entry and exit criteria to trade sharkfin pattern (Clear Charts Needed)
In trading, knowing when to enter and exit a trade is quite very important. A good traders knows both. Without good knowledge of entry and exit, no matter how great a trading strategy is , you will always get frustrated and not being profitable. So, in this section of this takes, I'm going to be showing how to enter a trade when you spot Sharkfin pattern. The use of RSI will still be added to know if the pattern is real or not. Let's start with a downtrend market.
Entry and Exit Criteria in a Downtrend Market For Buy Position
Entry Criteria for Buy position
• First, the market must be in a downtrend with a series of lower lows and lower highs. Since you are interested in trading reversal pattern in a downtrend market.
• RSI should be added to the chart with the parameters set. The period of 14 should be used for the length, the start of overbought band should be 70 and oversold should be 30
• Look for a very great momentum to the downside and a counter move that reverses the previous move with the same or higher strength with that of the previous one. This should form a V shape
• Look at the RSI indicator immediately the movement of price has started with a great momentum. See to it that RSI deepens below 30 and quickly move backward and go above level 30
• Place a buy order when you have seen that RSI has gone above 30 level.
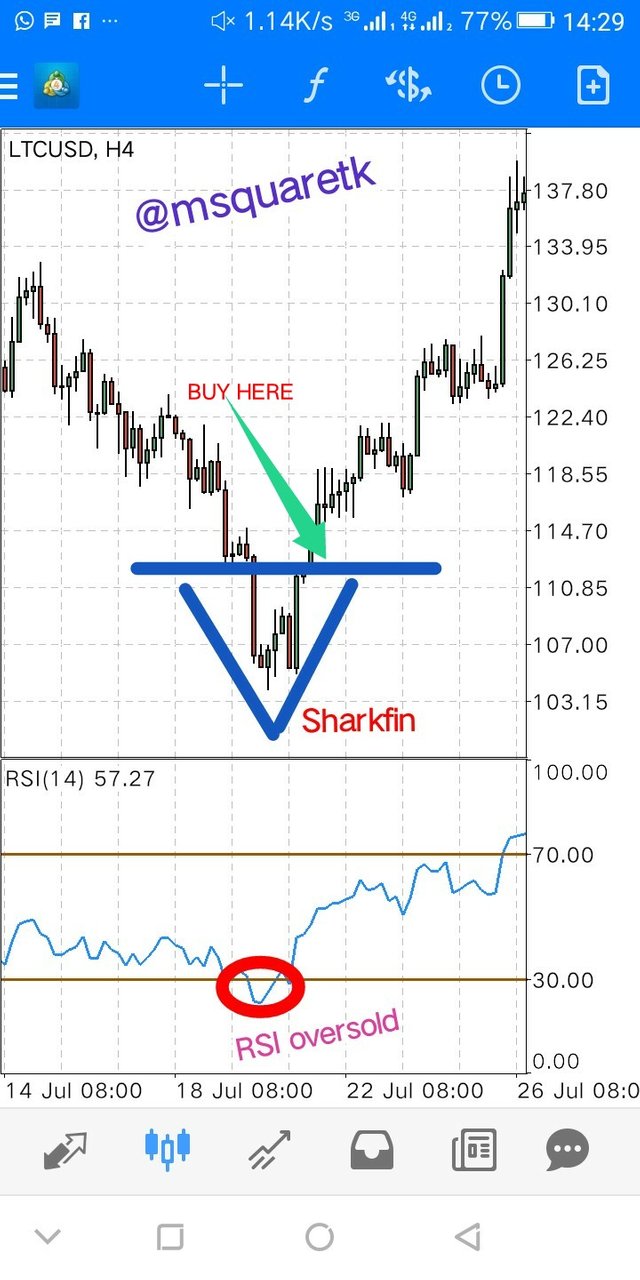
Fig. 8: Entry Criteria For a Buy Position / Mt4 Platform
Exit Criteria for Buy Position
• Stop loss must be set for a buy position. Stop loss should be placed immediately below the low of the pattern, that is the immediate low.
• What the price of an asset crosses below and touches the stop loss, the stop loss will be hit, that means the set-up is invalid and the price of the market may deep lower.
• Also, take profit should be set. It is recommended that take profit should be placed at a risk reward ratio 1:1. This means that take profit should be equal to stop loss.
• If the trade goes according to plan, the price will hit the take profit and the trader will make profit and then exit the market.
The screenshot below shows an example of exit criteria.
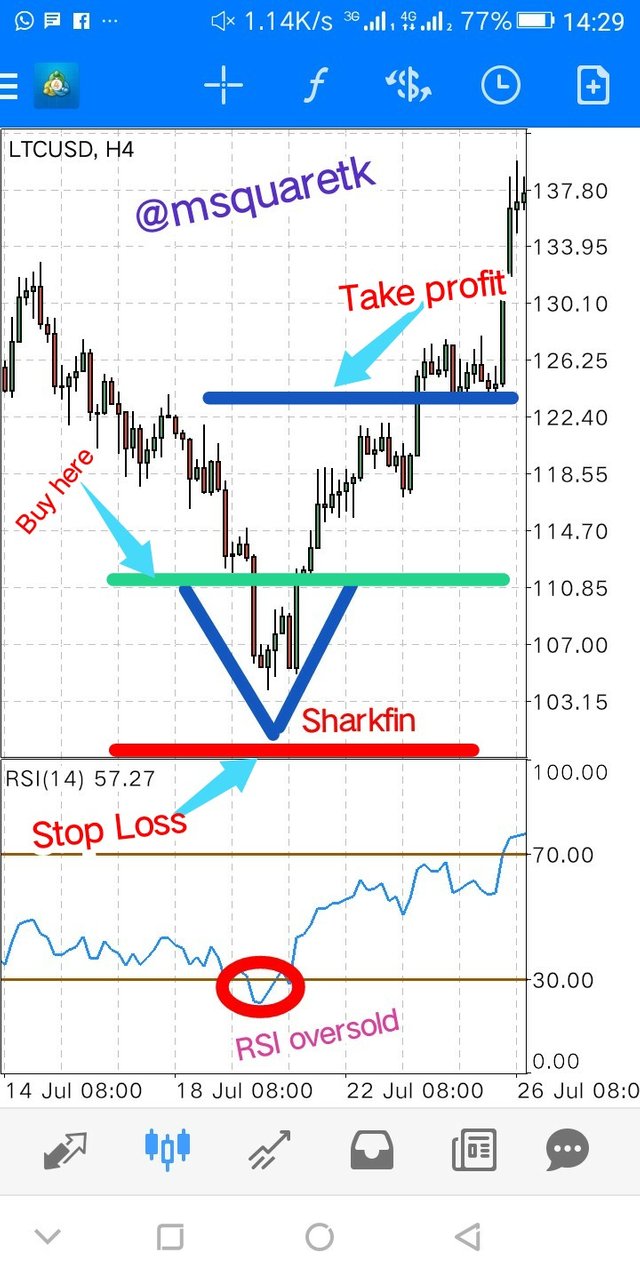
Fig. 9: Exit Criteria For a Buy Position / Mt4 Platform
Entry and Exit Criteria in an Uptrend For Sell Position
Entry Criteria for Sell Position
• Make sure the price of an asset you want to sell with Sharkfin pattern is in an Uptrend with series of higher highs and higher lows. It is important because you want to catch the reversal.
• Add RSI to the chart and make sure the parameters are rightly set. The period of 14 should be used. The overbought region band should be set to 70 band and oversold region should be at 30 band.
• Keep looking at the chart to know when a very quick move with a very great volatility will happen to the upside and a counter move with almost the same volatility or higher to the downside. This movement should form a very clear inverted V shape on the chart.
• Check the RSI for the confirmation. If the RSI enters overbought, that's goes above 70 level, it a confirmation that the reversal may happen. Then a quick move below 70 level on the RSI must immediately happen.
• Place a sell order immediately RSI goes back below 70 level.
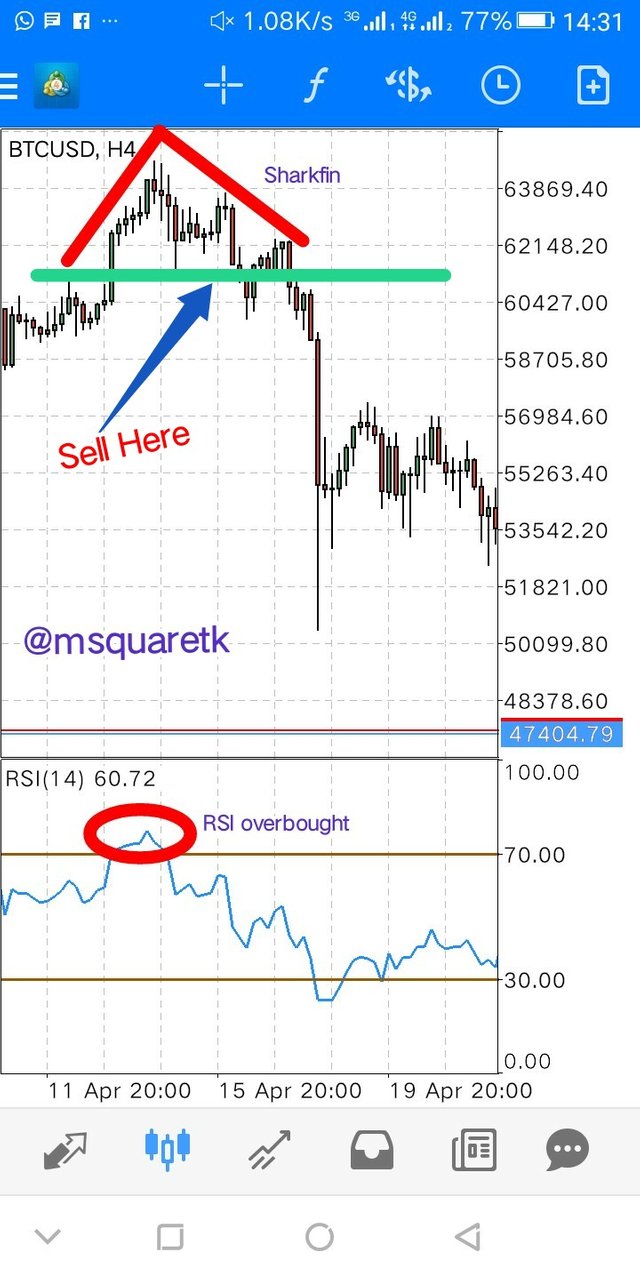
Fig. 10: Entry Criteria For a Sell Position / Mt4 Platform
Exit Criteria For Sell Position
• Stop Loss should be set. It should be placed above the high of the Sharkfin pattern.
• If the trade go against the traders and price moves to the area of the stop loss level, the stop loss will be hit and traders will taken out of the market. This means that the setup is invalidated.
• It is important to also set take profit. Take Profit is recommended to be placed at a level of 1:1 risk reward ratio. This means that take profit should be equal to stop loss.
• If the trade goes according to the plan, the price will hit take profit and the trader will be profitable from the trade.
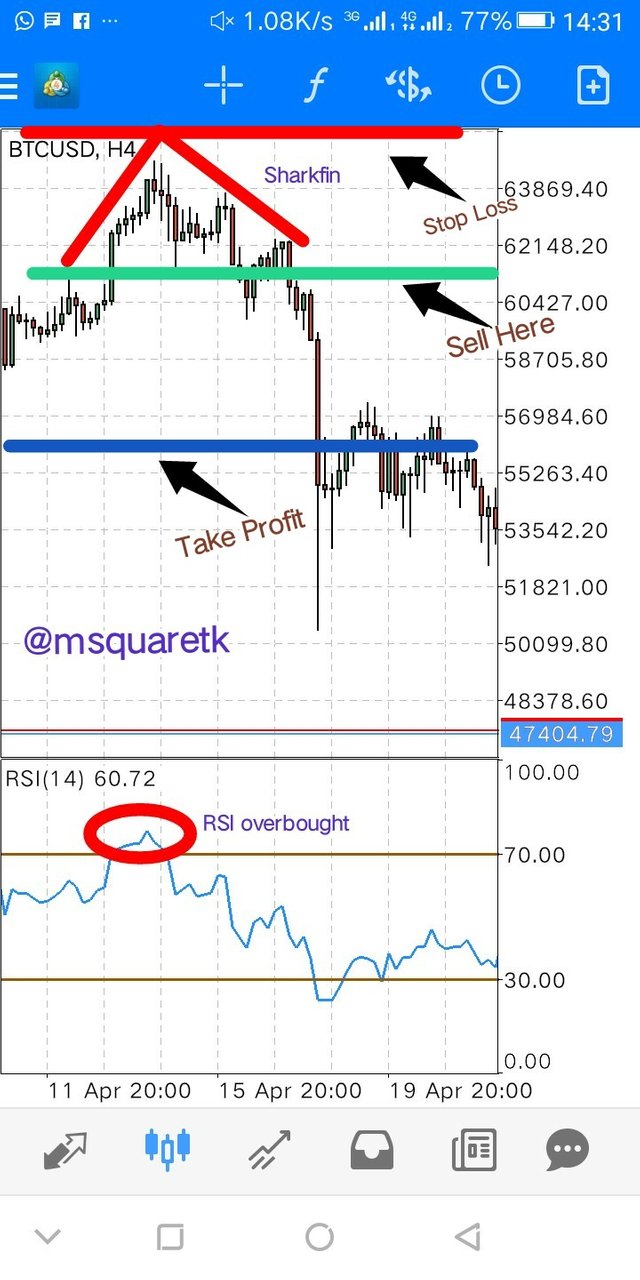
Fig. 11: Exit Criteria For a Sell Position / Mt4 Platform

Question 4
Place at least 2 trades based on sharkfin pattern strategy (Need to actually place trades in demo account along with Clear Charts)
In this section of the task, I'm going to use Sharkfin pattern to place trade.
Let's see a screenshot below.
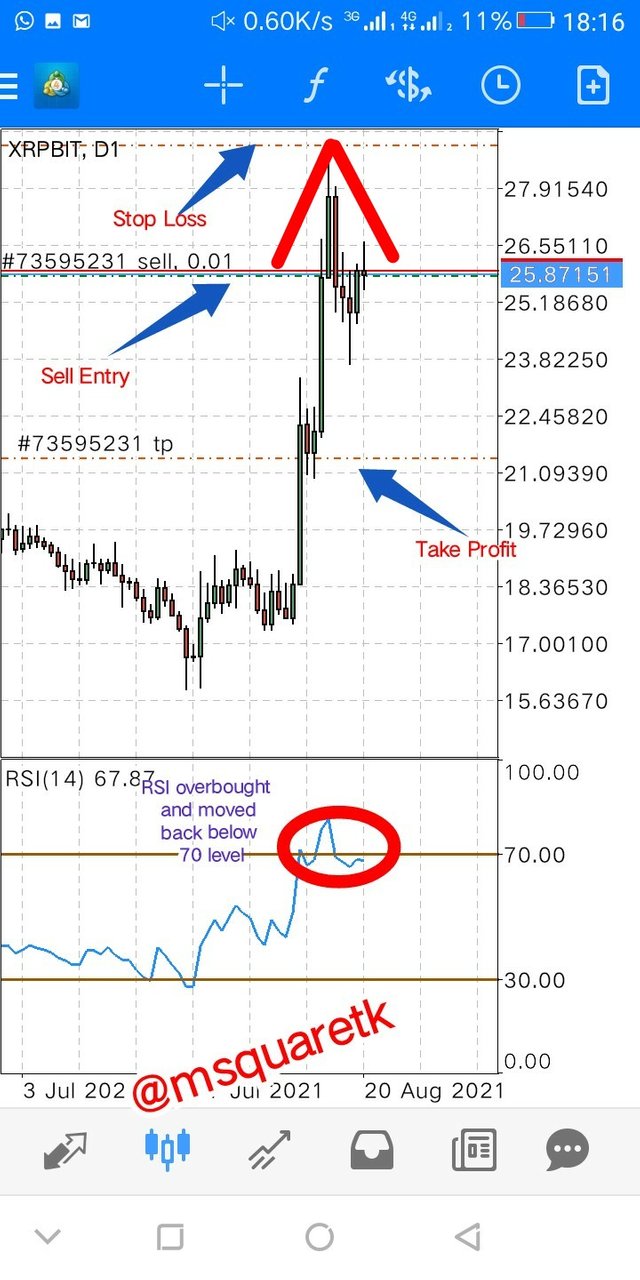
Fig. 12: XRPBIT Sell order using Sharkfin pattern/ Mt4 Platform
In fig. 12 above, XRPBIT has been in an Uptrend for sometimes with a series of higher highs and higher lows. This is very clear on intra day time frames. On the daily chart, the price moves with a very great momentum and encounter a resistance which counter the move as the price reverse very quickly. This forms Sharkfin pattern.
As it can be seen, RSI entered overbought and moves very quickly below 70 level. This is a confirmation that the trend may reverse. Seeing this, I placed a sell order by opening an instant execution. Stop loss was placed above the current high, that is above the pattern. Take profit was set at 1:1 risk reward ratio.
Let see another example of a demo trade I placed. In this second trade I'm going to show you, I used intra day time frames to trade Sharkfin pattern. See screenshot below.
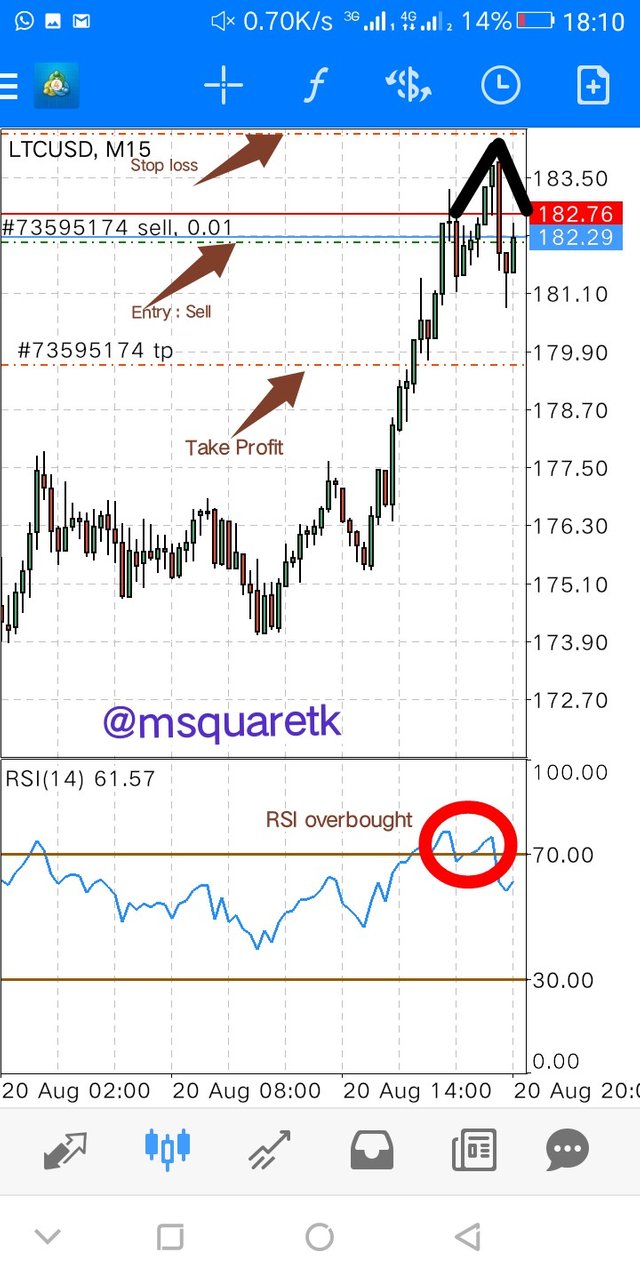
Fig. 13: LTCUSD Sell order using Sharkfin pattern/ Mt4 Platform
In fig. 13 above, LTCUSD has been on an uptrend. Since I was interested in selling the pair, I waited for a quick move up and a reversal move that reverses the price very quickly to the downside. As this happens, RSI also gave me confirmation. As it can be seen in the fig. 13 above, RSI entered overbought and went below 70 level. As it did this, I opened an instant execution for a sell position and placed stop looking above the pattern and take profit of 1:1 RR.
We have seen an example of two sell position placed with demo trade. Let's see one example of a buy position placed with the same demo account. See the screenshot below.
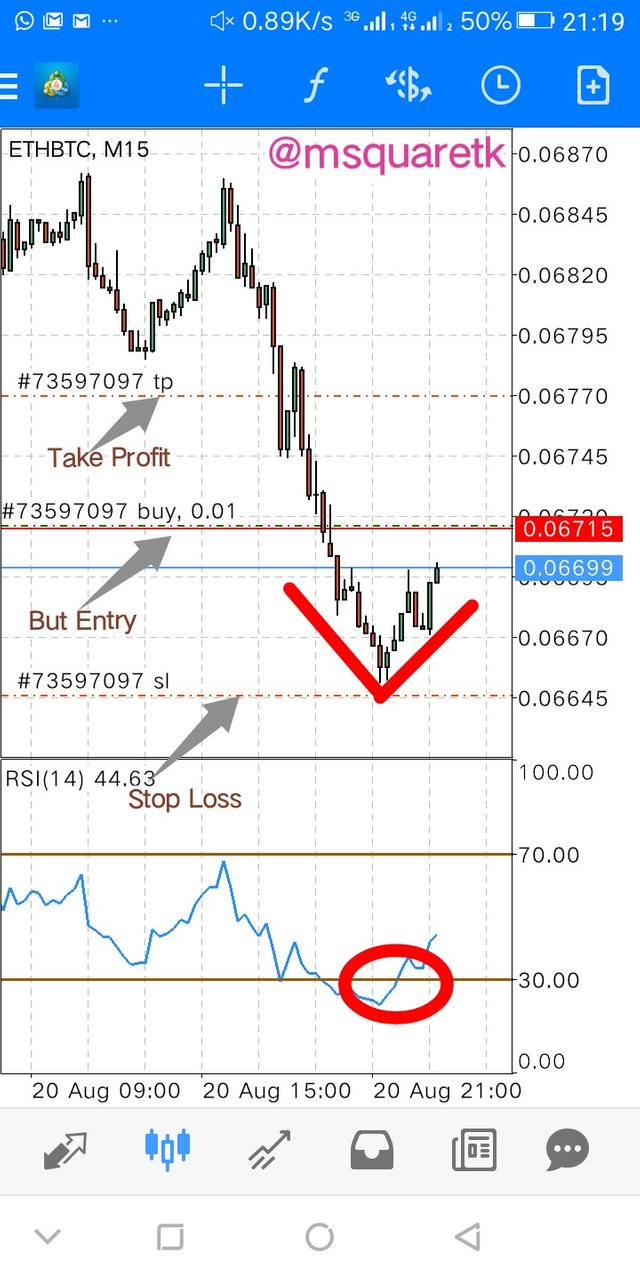
Fig. 14: ETHBTC Buy order using Sharkfin pattern / Mt4 Platform
Thanks last demo trade I placed is on ETHBTC chart. The price of the asset formed Sharkfin pattern. RSI gave confirmation as it entered oversold region and quickly move above 30 level. Immediately it moved above 30 level, I placed an instant execution of buy. The stop loss was placed below the the pattern, that is the current low and take profit was placed such that the risk reward ratio is about 1:1.
After some hours I placed the trade of XRPBIT and LTCUSD, I checked to see how the trades are doing. See the screenshot below.
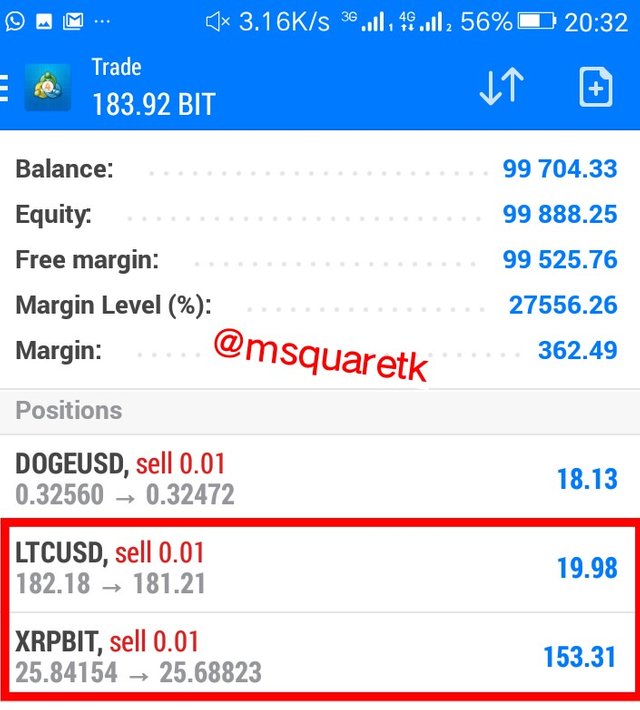
Fig. 15: XRPBIT and LTCUSD trades after some hours / Mt4 Platform
As it can be seen, the two trades I first placed as entered profit. I will still keep monitoring my trades.
This time around, I just added another trade. ETHBTC. Let's see see the screenshot below.
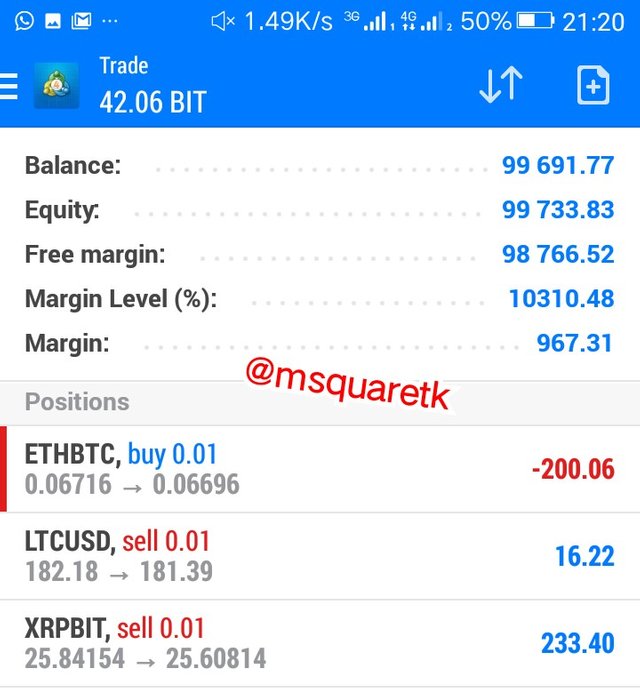
Fig. 16: ETHBTC, XRPBIT and LTCUSD trades Running / Mt4 Platform
I just added ETHBTC when I took the screenshot. I will still be monitoring these trades.

Conclusion
Sharkfin pattern is pattern that forms when the price of an asset moves very quickly to the downside/upside and Immediately reverse with a very great momentum making the place to be seen as V or inverted V shape on the chart. Sharkfin pattern is a reversal pattern. It is a bullish and bearish reversal pattern.
I have learnt the trade entry and exit criteria using this pattern and i have been able to place demo trades to test this strategy. This pattern is often easy to use and master. Thanks to Professor @cryptokraze for the great lecture. It has added a whole lot to me.

CC : cryptokraze
Written by @msquaretk