Crypto Academy / Season 3 / Week 7 / Homework Post for Professor @imagen

Hello everyone. How are you over there?
The week 7 in the Crypto Academy has been going on well. I'm glad I have attended Professor @imagen 's course. The course "Fibonacci retracements" he taught was taught in a very simple which anyone can understand. Thank you, Prof.
That being said. At the end of the lecture, Prof. asked five (5) questions which is homework task. The questions are:
1.) Who was Fibonacci? What were your most important contributions in the field of mathematics?
2.) Describe in depth the Golden Ratio. How is it obtained? Where is it located? Give examples of your application through history.
3.) Describe how Fibonacci is used in Tradigviews. Show screenshots
4.) Make an investment of at least $ 10 (show screenshots). Determine Fibonacci levels with a timeframe of 4 hours for a period of 48 hours. Identify possible support and resistance levels for that time period. Show screenshots at 24 and 48 hours.
5.) What are Fibonacci extensions?
So, I will taking the questions and answer them one after the other.

QUESTION 1
- Who was Fibonacci? What were your most important contributions in the field of mathematics?
Who was Fibonacci?
The full name of the man, Fibonacci is Leonardo Fibonacci. He was born to Guglielmo Bonnaci in 1170 in Pisa, Italy. His father was a merchant and he did travel with his father for to many area of the world. He developed interest in calculations and numbers because of the job his father did.
 fig.1: Picture of Leonardo Fibonacci
SOURCE
He was an italian mathematician who contributed significantly to the field of mathematics and science. (I will discuss his contributions later in this section). Fibonacci first learnt the Hindu–Arabic numeral system at Bugia, Algeria. He was a young boy then burning with passion. He was regarded as the most talented and brilliant person of his age. Fibonacci was skilled in mathematical numbers and calculations.
What were his Major Contributions in Mathematics?
Leonardo Fibonacci was known for his significant and remarkable work in the field of mathematics. Because he was always travelling all around for merchant work which is the business of his father he developed interest in numbers and calculations. He then learnt Hindu Arabic numeral system.
It was his first book called "Liber Abaci" in mathematics that brought Fibonacci to the limelight. In the book, he introduced the world to Arabic numerals. (Arabic numerals are numbers are ten digit numbers — 0 to 9). Fibonacci compared Arabic numerals to other numerical systems, such as Roman numerals and came to conclusion that Arabic numerals is good. And today we all know that the numerical system is one of the most popular and widely used system.
The digits, 0 to 9 and placed value his talked about in his book has been found useful in many aspects. For example Arabic numerals are used is business to calculate profit and interest, conversion of currencies etc. His book also highlights some significant parts of mathematics such as prime numbers, irrational numbers etc.
Another important contribution of Fibonacci to the field of mathematics is what is known as "fibonacci numbers" The fibonacci numbers form a sequence of numbers in which the two preceding numbers are sum up together to get the next number in the sequence. The number starts from 0 and 1. (The sequence are: 0 1 1 2 3 5 ..... etc).
Fibonacci numbers has been useful in many aspects such as in computer algorithm (fibonacci cubes, Fibonacci search techniques etc), biological settings etc.
Fibonacci numbers has also been used to invent technical indicators called fibonacci retracement and extension.
He published so many other books. Some of them are, Practica geometriae, Flos etc.

QUESTION 2
- Describe in depth the Golden Ratio. How is it obtained? Where is it located? Give examples of your application through history.
Golden ratio is also known as golden mean or divine proportion. This ratio is often referred to as "phi."
It is used to describe the proportion of a thing. In life, ratios are often used to maintain balance. The smallest of thing to the largest of thing in life can be put in ratio.
This ratio is used by mathematics and scientists to describe patterns of things.
Golden ratio is also called irrational numbers.
This golden ratio is found or gotten when a line is divided into two not equal parts such that the longer when divided by the shorter is equal to the whole line divided by the longer.
When it comes to number, golden ratio occurs when the sum of two numbers, say(x and y) divided by the larger number, (say x is the larger) is equal to the ratio of the larger number(x) divided by smaller number (y).
The golden ratio is around 1.618. And it is often represented by phi.
Golden ratio can also be obtained or derived from fibonacci sequence. As I described above, fibonacci sequence are numbers in which the two preceding numbers are added together to get the next in the sequence. Fibonacci numbers start from 0 and 1.
Fibonacci sequence are:
0, 1, 1, 2 , 3, 5, 8, 13, 21, 34, 55, 89....... Etc.
The Fibonacci ratio is gotten by dividing the the next number by the previous. For example the fibonacci ratio of the first 8 sequence in the above sequence are:
1/0, 1/1, 2/1, 3/2, 5/3, 8/5...... etc
These ratios approach the golden ratio. It is known that higher fibonacci numbers are very close to golden ratio.
There are many areas where golden ration can be found. It can be found in tree branches. It can also be seen in shell 🐚, such as nautilus shells and snail shells etc.
Going by the history, the golden ratio, phi is named after Phidia. The man was a Greek sculptor. The man used golden ratio in his sculpture works. According to history, the Parthenon in Athens that was built many years ago has its the exterior dimensions as perfect example of golden rectangle.

QUESTION 3
- Describe how Fibonacci is used in Tradigviews. Show screenshots.
The official website of trading view is tradingview.com. So let's visit this website and see how to use fibonacci. * When you click on the website, it opens to the homepage. Then click on the drop down menu, you will see the "chart" in the features listed, click on it and allow it to load.

fig. 2: Trading view Homepage
- Then the chart will open right in your front. At the left side of the chart, click on third icon features listed. The sign arrow in fig. 3 below points to the icon.
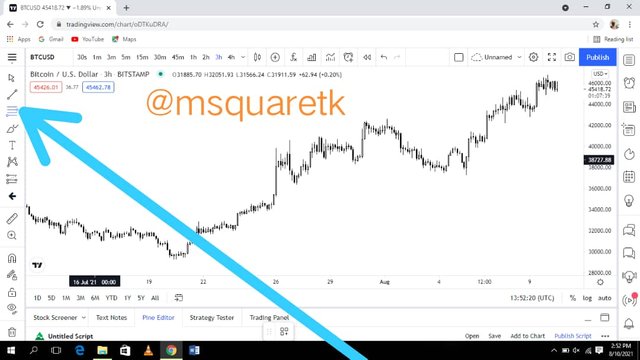
fig. 3: Drawing Tools Features
* Once you click on this icon, a pop notification will appear showing you some features. Click on fib. retracement.
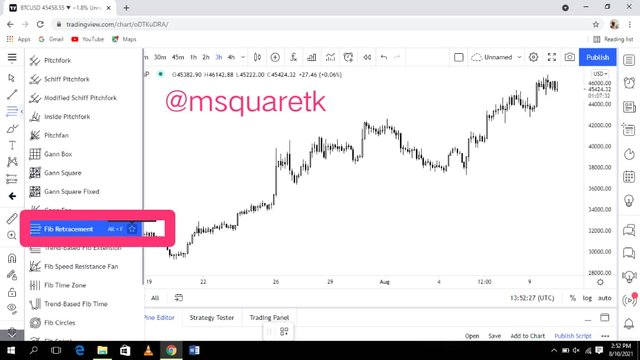
fig. 4: Fib. Retracement Tool
Then bring back your cursor on the chart.
The ratios which traders use in Fibonacci retracement are:
- 0.236 or 23.6%
- 0.382 or 38.2%
- 0.5 or 50%
- 0.618 or 61.8%
- 0.786 or 78.6%
Although, 0.5 is not a fibonacci ratio but traders believe it should be included because it a mid point and serve as equilibrium point.
Drawing Fibonacci Retracement on Downtrend Chart.
Now to draw fib. retracement on downtrend, take fibonacci from the high point to the low point possible. Let's see the screenshot of a fibonacci retracement drawn on a downtrend chart below.
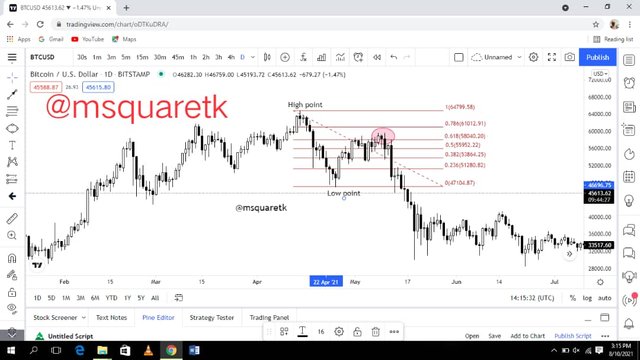
fig. 5: Fib. Retracement on Downtrend Chart
In fig. 5 above we can see that the market has made a low corresponding to the high (This is even called an impulsive move), and the market retraced back up until between level of 0.618 and 0.786 fib ratios. The area above 0.5 or 50% fib level or ratio is often referred to as a **"premium point."** These levels are key areas where supply is always greater than demand and then the price always continues the impulsive move from there.
Drawing Fibonacci Retracement on Uptrend Chart
In an Uptrend market, price makes series of higher highs and higher lows. Fibonacci is used to tame the retracement of an asset. Fibonacci retracement is draw in an uptrend market by taking fibonacci from the low point to the high point. The low point is the start of the trend which is always point 1 or 100% in the fibonacci level and the high which is the end of the impulsive move is always point 0.
Fig. 6 below shows a screenshot of an uptrend chart in which fibonacci is drawn to see how deep retracement has gone.
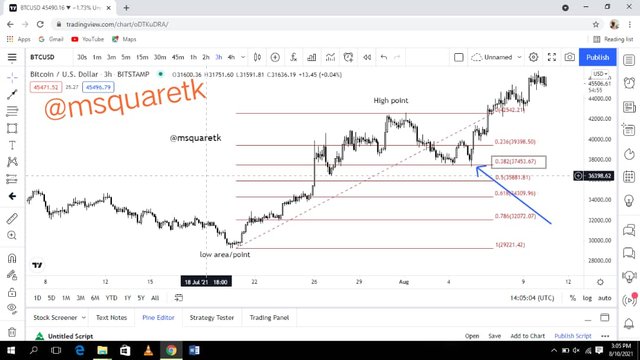
fig. 6: Fib. Retracement on Uptrend Chart
In fig. 5 above, we see how the price finds its turning point after retracing to 0.382 or 38.2% fibonacci level. Fibonacci levels are key point area where the price likely reverse after a considerable pull back or retracement.

QUESTION 4
- Make an investment of at least $ 10 (show screenshots). Determine Fibonacci levels with a timeframe of 4 hours for a period of 48 hours. Identify possible support and resistance levels for that time period. Show screenshots at 24 and 48 hours.
For the investment, I am going to invest on Cardano, ADA by buying it with my USDT. And I'm goin to use binance exchange platform.
- On the homepage of binance, there's a feature called "trade", click on this feature. Let's see the screenshot below.
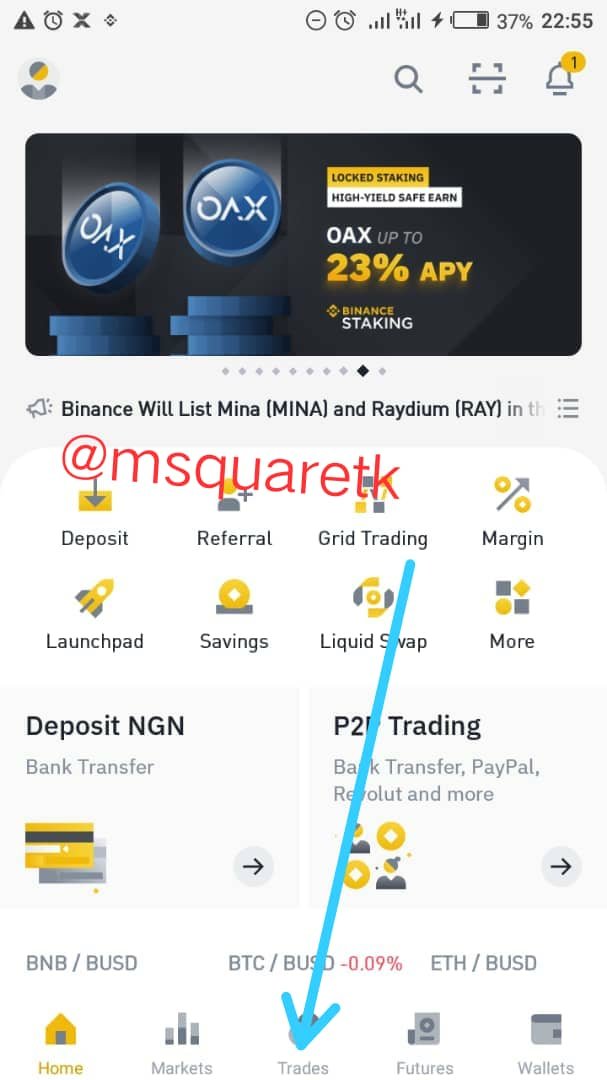
fig. 7: Binance Homepage
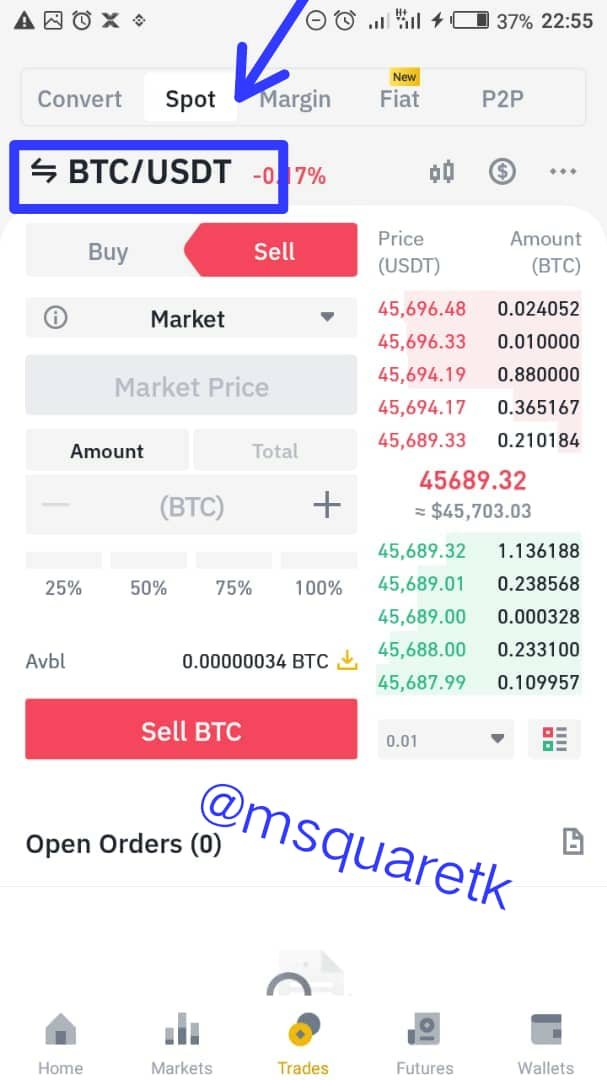
- Then a page will load where you will select the asset you want to invest on. Click on the pair boxed in rectangle in the screenshot below. Then a search box will appear where you can search. Since I'm interested in buying ADA with my USDT, I searched for ADA, and it brought results, then I clicked on ADA/USDT.
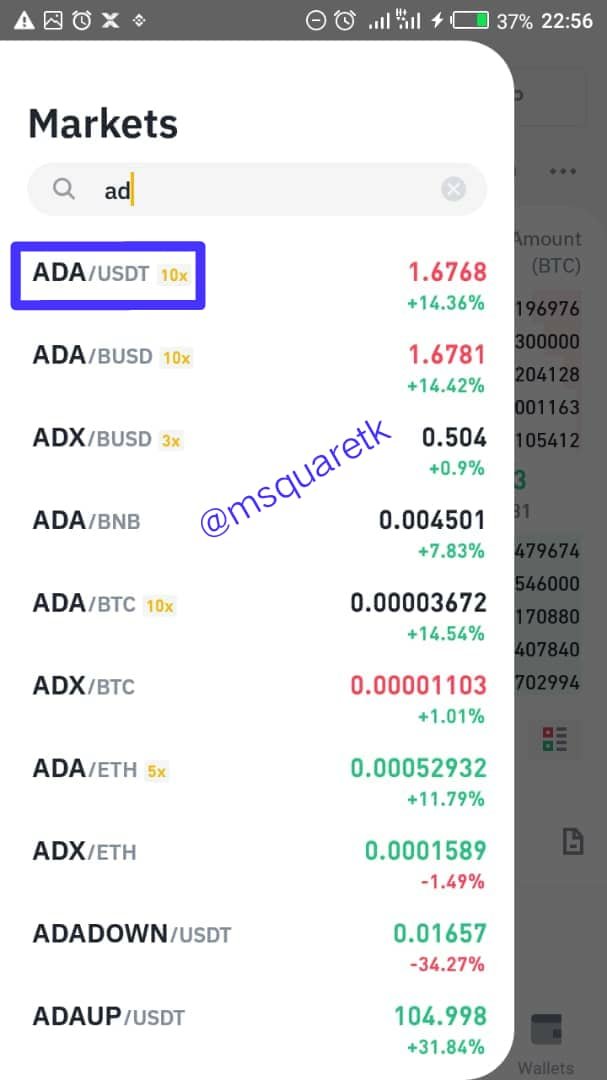
- The next thing is to enter the amount you are willing to use to buy or sell the asset of your choice. Here, I'm using all my USDT to buy ADA. So, enter all amount. And I select market price because I want to buy at the current price. Then click on "buy". Wait for the order to fill.
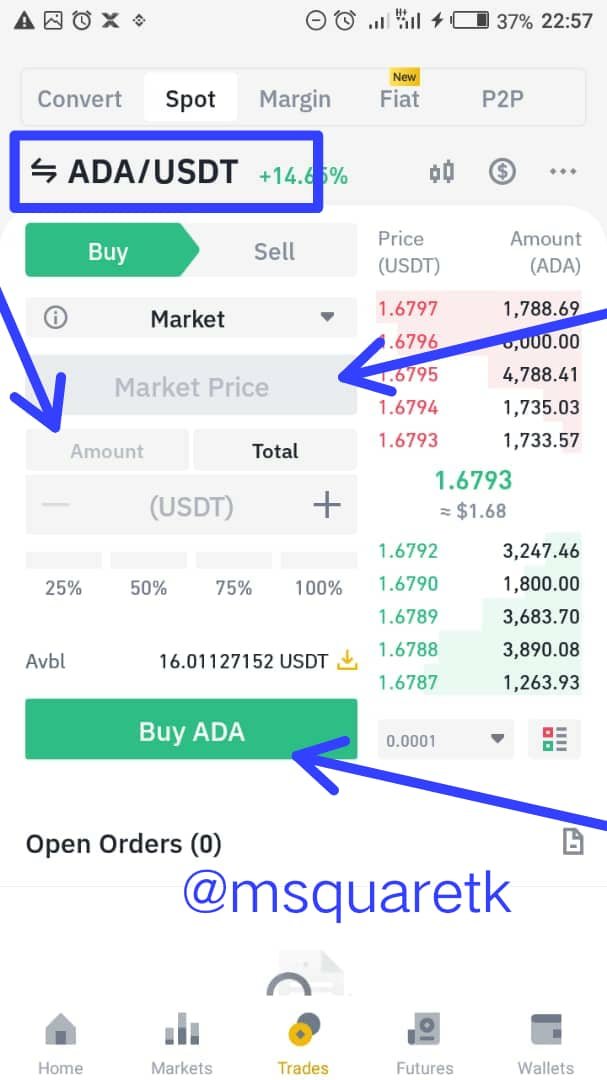
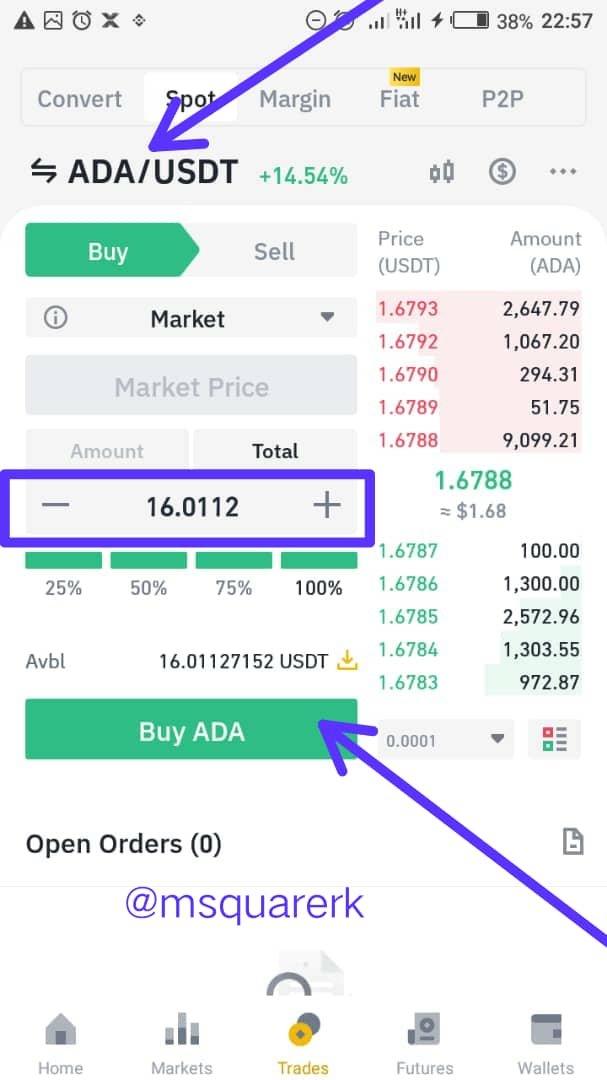
* Then once the order I filled, we are done with the process. Let's now look at the history of the transaction to see what we have bought. See the screenshot below for the details or history of the order that has been executed.
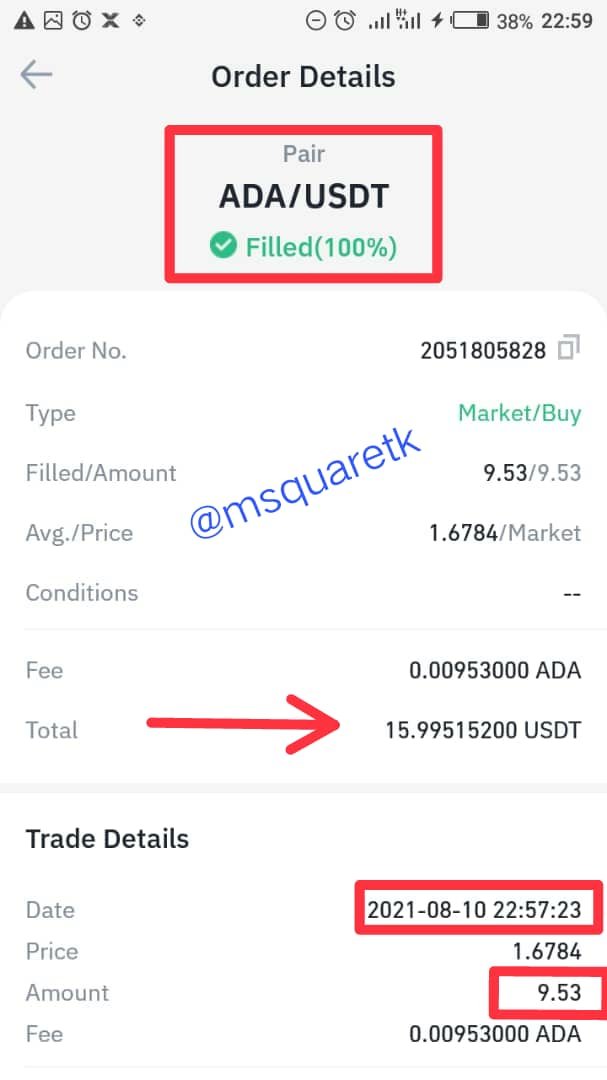
Fig. 10: Order Details
We can see that in fig. 10 above, that the order has been filled 100%. And that the amount of about 16USDT has been able to buy 9.53ADA. The time and date, which is 2021-08-10 / 22: 57:23 (WAT), when the order was executed is also written on the order details.
At 24Hrs Period After Investment
This is the screenshot of ADAUSDT after 24hrs of Investment.
.png)
Fig. 11: Fib. Retracement on ADAUSDT after 24hrs of Investment
In the screenshot of my Investment on ADA, You noticed I did it at an hour very close to the closing of the day. See fig. 10. Now after the investment lasted for 24 hrs, i checked the chart and put out my fib. See the fig. 11 above, the price of ADAUSDT has moved up, it traded from 0.382 retracement level to 0.681 retracement level. This show that the price of the asset appreciated for a period of 24hrs.
Let's see zoom the image above to see vividly the right in the price of this asset for the period of 24hrs.
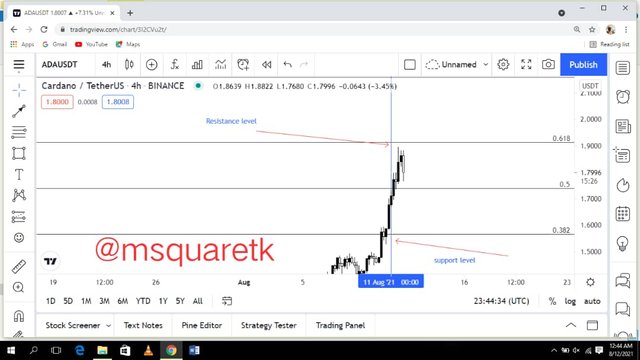
Fig. 12: Rise of an asset, ADA after 24hrs of Investment
It can be seen vividly that the asset traded from 0.382 or 38.2% fib. level which serves as a support level to 0.618 or 61.8% fib level finding a resistance level which is currently turning the price down.
I went further to do draw fibonacci retracement from the period of the investment to the high where it finds resistance, and I observed that the current retracement for the rise of an asset within 24hrs period deepen to 0.5 or 50% fibonacci retracement level. See the screenshot below.
.png)
Fig. 13: Retracement for athe period of 24hrs after investment
At 48hrs Period After Investment
At the period of 48hrs after Investment, I log in back to trading view. And the asset, ADAUSDT has traded from 0.618 or 61.8% fib. level back to 0.5 or 50% fib. level.
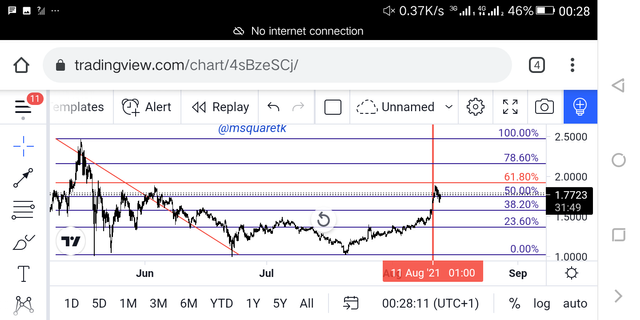
Fig. 14: ADAUSDT 48hrs after investment
Remember that at 24hrs after investment, the asset is on 0.618 fib level. But this time around, 0.618 has been found as resistance that pushed the price down to 0.5 fib. level. Let see the image below.
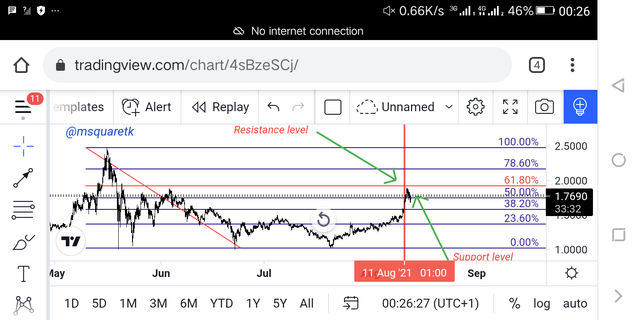
Fig. 15: 0.618 Fib. Level Acting as Resistance
Let's zoom in to be able to see the clearer picture of what the price is doing at 48hrs.
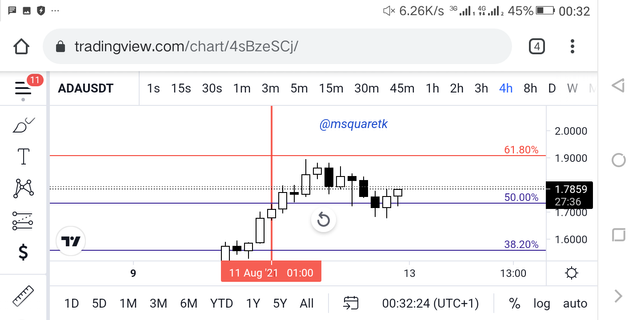
Fig. 16: Clearer Picture of ADAUSDT 48hrs after Investment

QUESTION 5
- What are Fibonacci extensions?
Fibonacci extensions are tools which help traders to predict how far price will move after a certain pull back or retracement in of price in market. In essence, while the fibonacci retracement provides traders area where to take or enter trade, fibonacci extension give them areas or points where to exit the trade.
For example in an uptrend market, traders can wait for a new high to form and make a retracement, once the retracement phase is completed, they can use fibonacci extensions to set their take profit.
Just as fibonacci retracement are key areas which serve as support and resistance depending on the trend in which an asset is, fibonacci extensions are also key support and resistance levels.
Fibonacci extensions, like fibonacci retracement, are also derived using fibonacci numbers. Remember I said that fibonacci numbers are sequence where the next number is gotten by adding the two previous or preceding numbers together in the sequence. The sequence start from 0 and 1
How to Draw Fibonacci Extensions in an Uptrend Market.
In an uptrend market, fibonacci extensions is drawn by locating three significant points. The start of a a wave, which is the low, the end of a wave, which is the high and the end of the retracement. Thus Fibonacci retracement is drawn from the low to the high and back to the retracement point. Let's see the screenshot in fig. 6 below.
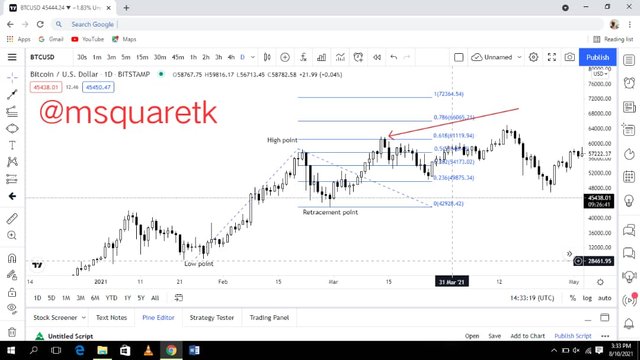
fig. 17: Fib. Extensions in an Uptrend Market
You notice that in the fig. above, I take my drawing from the low to the high and back to the retracement level point. That's how fibonacci extension is drawn in an Uptrend Market. Also notice that the price reached a certain level of extensions (0.618) before there was a pull back. So, fibonacci extensions levels are very useful levels to take profit, that's to exit the market.
How to Draw Fibonacci Extensions in a Downtrend Market.
To draw Fibonacci extensions in a downtrend market, we usually look for a significant high and start our drawing from there and take the drawing to the low corresponding to it and then back to the pull back against the high.
Let's see the screenshot of a fibonacci extensions drawn on a downtrend market below.
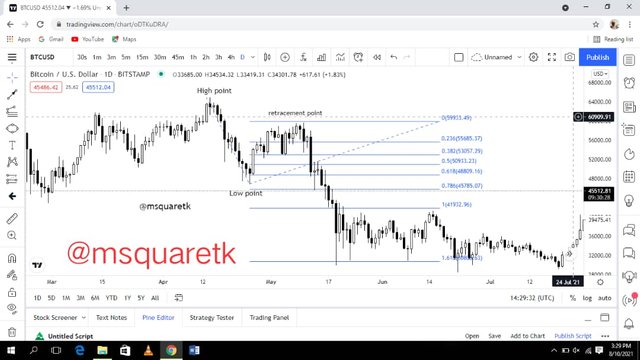
fig. 18: Fib. Extensions in a downtrend Market
In the fig. above, we can see how Fibonacci extensions is drawn. Three significant points, high point, low point and retracement point must occur before fibonacci extensions can drawn.

CONCLUSION
Fibonacci retracement is one of the popular tools used by traders to predict the start of a new impulsive move. Price moves in two forms, impulse and correction. The corrective phase is also known as retracement. Traders often wait for this correction when an impulse has been created to join the new impulse that will be formed. Fibonacci retracement is now the tool they use to know how deep a correction or retracement will go.
Fibonacci retracement have ratios which most traders use. These ratios are, 0.236, 0.382, 0.618, and 0.786. Some traders add some levels to these levels depending on their trading strategies.
Generally fibonacci retracement level are areas where traders take trades. Fibonacci extensions are tools which traders use to take profit. These tools are very important and have been found useful in finance trading. They were invented using fibonacci numbers, hence their names "fibonacci retracement and extensions."
Thanks to Prof. @imagen , I have learnt one or two things from your course. I'm glad I attended your class.

CC: @imagen
Written by @msquaretk
Gracias por participar en la Tercera Temporada de la Steemit Crypto Academy.
Te felicito, realizastes un gran trabajo.
Espero seguir corrigiendo tus asignaciones.
Thank you Professor @imagen. I'm glad I Participated in your class. It added a whole lot to me. Thanks once again.