Crypto Academy Season 3 Week 5 | Homework Post for Professor @yousafharoonkhan | Death cross & Golden cross, How to use Binance P2P trade
Hello everyone. It is a great time this week. The week has been wonderful and full of experiences here and there. I am happy to be part of this week classes. Truth be told, it has been a very great week for because I have learnt one or two things. It is therefore my pleasure to write this homework task. Respected Professor
@yousafharoonkhan has really done a great job with the topic "Death cross & Golden cross, How to use Binance P2P trade." Thank you, Professor.
As usual, at the end of the lecture, Prof. asked four questions in which each student must answer all the questions.
The questions read:
Question no 1:
Define Death Cross and Golden Cross in your own words. And what is the significance of DC and GC in trade? And what effect do these two have on the market?(in your own words.)
Question no 2:
Explain the points given below:
•How many days moving average is taken to see Death cross and Golden cross in market for better result and why?
•How to see death cross and golden cross on the chart.
•Explain Death cross and Golden cross on the chart, (screenshot necessary)
Question no 3:
What is Binance P2P and how to use it ?
How to transfer cryptocurrency to p2p wallet?
How to sell cryptocurrency in local currency via p2p (any country or coin)(screen shot necessary to verify account)
Question no 4:
What are the things to keep in mind during P2P trade and describe its four advantages and disadvantages.(own words)
That being said. I'm going to answer these questions one after the other based on my understanding of the lecture and my personal knowledge.

QUESTION 1
• Define Death Cross and Golden Cross in your own words.
• And what is the significance of DC and GC in trade?
• And what effect do these two have on the market?(in your own words).
Detailed Definition of Death Cross and Golden Cross
In finance trading, there are two things traders use to predict the direction of price of assets. They use technical and fundamental analysis. In technical analysis, traders use Japanese candlesticks together with many technical indicators. Now, death and Golden cross are terms from one of these technical indicators. If you are following me closely, that recent statement should have prepared your mind. In this section of the question, I am going to talk about the terms of a technical indicator. That being said. Let's get right into the definition of these terms, death cross and golden cross.
Death Cross
In order to understand the term , death cross, it is important to know where it is used. One of the technical indicators that is popular in finance trading is moving average. This indicator is very popular because of its usefulness over the years. This indicator is majorly used by traders to determine the trend of market. Trend is a direction (either upward or downward) of price. It's also used as resistance and support.
Traders add moving averages to the chart to position themselves for the next move in the market. Two moving averages are often added by traders. One is short moving average and the other is long moving average. The short moving average that's added is 50-day moving average and the long-term moving average that's added is 200-day moving average.
Thus, death cross occurs when a short moving average crosses below the long moving average. This process often occurs after a very long upward trend. That is, after the buyers have been in the market for a very long period of time. The buyers have overbought to the extent that they have reached a point of exhaustion. At this point, the investors are greatly investing as bears, that is, they want to join the downward trend knowing and seeing that the trend direction is about to change.
Golden Cross
Golden cross is a direct opposite of death cross.
Remember that in death cross, the short-term moving average crosses below the the long-term moving average. In the case of golden cross, the short-term moving average crosses above the long-term moving average. For easy remembrance, one can decode it as: DEATH, BELOW and GOLDEN, ABOVE
This process of cross often occurs after the asset has been in a very downward trend. The sellers or bears have oversold and it is now time for the buyers or bulls to take hold of the market. In essence, golden cross is a signal for a bull or bullish trend. That is, the buyers are about to overpower the momentum with which sellers came with. This makes investors to invest in buying the asset for that particular time whether for a short term trend or long one. The golden cross always occurs at a key support level or zone. When the cross forms, the traders often position themselves to ride the wave up.
Significance of Death Cross (DC) and Golden Cross (GC) in trade
The importance of death and golden cross in finance trading can never be overemphasized.
• They help traders in knowing the trend. One of the most important things that traders want to know when they open their chart is trend. Trend is so important that it determines the success of the trade. Everything a trader predicts fails when he is wrong in trend. That is why people do say "trend is your friend; never go against it." These death and golden crosses are therefore something important to traders when they don't want to go against the trend. Immediately the crosses occur, traders will know that the current trend is about to change and they will position themselves to ride the wave of the trend which is about form.
• Both DC and GC serve as key levels.
One of the importance of moving averages is that they act as support and resistance. Thus when there is a cross, either a death cross or golden cross, it signifies that the area is a key area. If it is the death cross that occurs, it means the area is a resistance level and it is known that price reverses at resistance level or zone. If it is the golden cross that forms, it means that the area is a key support level or zone and it known that price reverses at support zones.
• They serve as points of entry and exit.
This is another significance of death and golden crosses in finance trading. For example, when traders have ridden the wave of an uptrend and they see that the death cross has formed, they will know it is time to leave or exit the uptrend as the trend may reverse and shift to downtrend. In essence, death cross and golden cross are points where traders enter the new trend and exit the previous one. These and many more are the significances of these crosses.
Effect of Death Cross (DC) and Golden Cross (GC) on the Market
For Death Cross (DC)
What actually happens when the death cross occurs is that the buyers or bulls who have been in the uptrend market seems over-powered. There is a great reduction in the buyers momentum. The cross, death cross often ends the the upward or bull trend and sets the sellers' pace in the market. At the point of this cross, the investors often invest in selling the assets. It is also pertinent to know that death cross causes reversal of price in the market. The reversal therefore may be a short-term or long-term reversal depending on the overall bias of the asset at the particular.
For Golden Cross
Golden cross of the moving averages on the chart often arises after a very long downtrend. At this point, the sellers are overpowered by the strength of buyers who want to step on the market. In essence, when the golden cross occurs, a downward trend changes to an uptrend
Also, the golden cross is a threat zone for the sellers, and therefore a point of exit. But it is a point of advantage for buyers. Hence, simply put, golden cross gives opportunity for investors to invest on the asset by placing a buy order, either limit order or other market executions.
QUESTION 2
Explain the points given below:
• How many days moving average is taken to see Death cross and Golden cross in market for better result and why?
• How to see death cross and golden cross on the chart.
• Explain Death cross and Golden cross on the chart, (screenshot necessary)
How Many Days Moving Average is taken to see Death Cross and Golden Cross in Market for Better Result and Why?
Actually, there are two periods of moving averages that traders add to chart in order to have have death cross. Without two moving averages, there won't be crossing. One moving average cannot cross itself, it has to be two or more. But in the case of death cross and golden cross, the most reliable moving average period that the traders use is 50 and 200. 50 days for short term moving average and 200 days for long term moving average.
Although there are some traders who uses different periods for their moving average, but truth be told, over the time, 50 and 200 periods for short term trend and long term trend have been tested and proved reliable. The combination of the two moving averages have given a great percentage of success rate and that is why the traders use them often.
The death cross often occurs when the 50days moving average crosses below the 200days moving average and the golden cross occurs when the 50days moving average crosses above the 200days moving average.
50 days moving average is very fast compared to 200days moving average. Thus, when trend is about to change, it is the first to react and given a signal that the trend may change. 200days moving average is slow compared to 50days moving average. So 50days moving average is often used in combination with 200days moving average because of it senses the reversal at early time.
Therefore, 50days and 200days moving averages are highly recommended for death and golden cross. It is only taken 200days to see death and golden cross. And the reason is because of the period of moving averages added to the chart which is 50 and 200 moving averages.
How to see death cross and golden cross on the chart.
Having explained what death cross and golden cross mean in the previous section, I am going to explain in detail how to see these crosses on the chart.
Firstly, you can use any platform that has the asset you want to analysis with these indicators, but for me, I am going to use trading view. The full address of the site is https://tradingview.com.
Now, I am going to open my browser, chrome browser and type the said address on it. Then, I will load the address.
When this page opens, it will display the home page. Let's see the screenshot of the site homepage below

Now the next thing to do is to click on the three lines identified in red rectangular box in the screenshot. Some features will be displayed. See the screenshot below
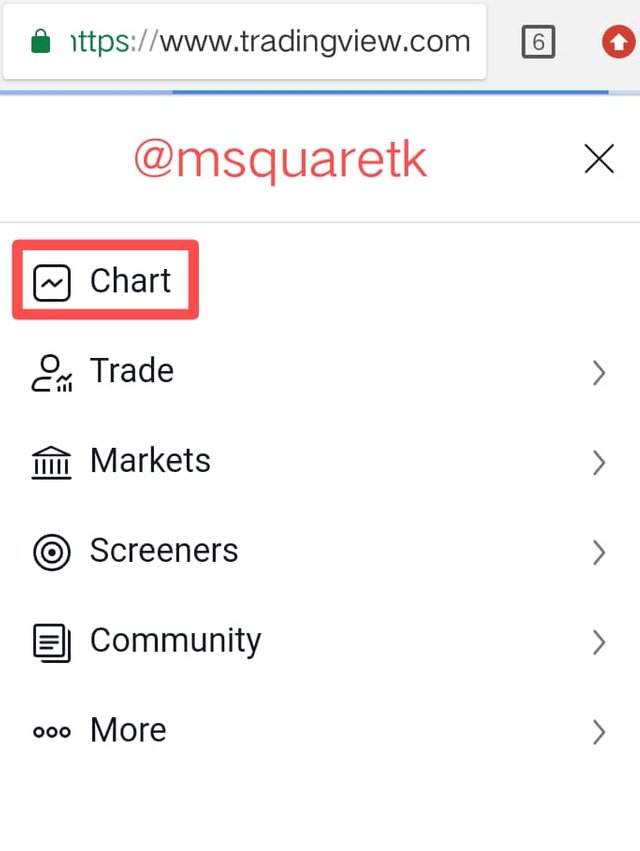
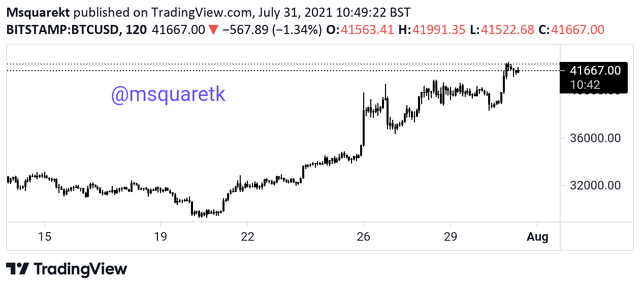
Now, as it can be seen from the screenshot, click on "chart." By clicking on the chart, you will be taken to a page where you will see the chart. Now, the chart opens for me and I can see the chart of BTCUSD which is the last pair I opened. So, I am cool with this pair. I want to see the golden and death cross in this chart. The screenshot below is showing chart that opens for me when I click on the chart.
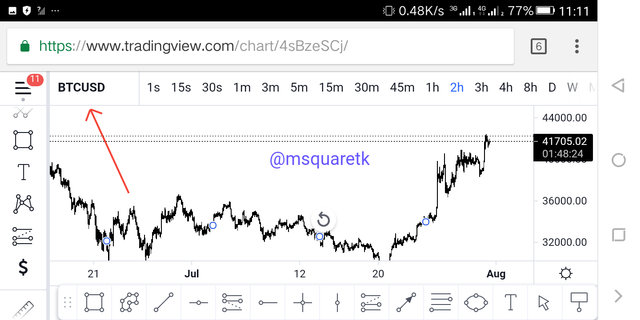
However, if you are not cool with it the pair, you can actually search for the pair you want to analyze. You can do this by clicking on the BTCUSD icon at the top left of the chart. See the screenshot below.
The next thing to look for is where to add our moving averages. At the top of the chart, I navigated to indicators. The sign at the top with "fx" icon is where all indicators are. I clicked on this sign. Let's see the screenshot below
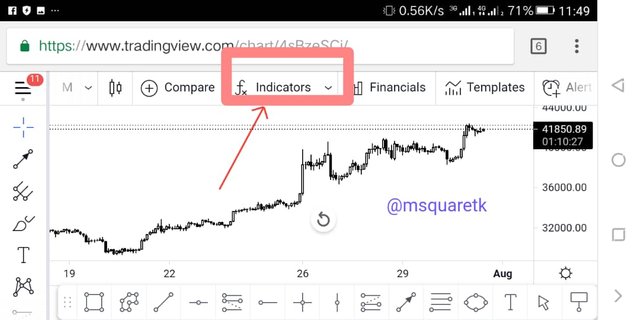
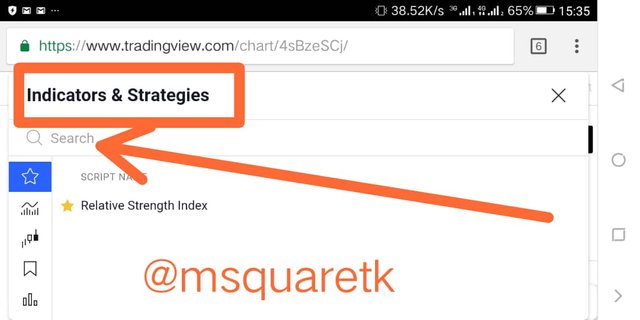
Now clicking on this sign, i.e "fx indicator", it will display where to actually search. In the search box, type "MA" and it will bring moving average. Let's see the screenshot below.
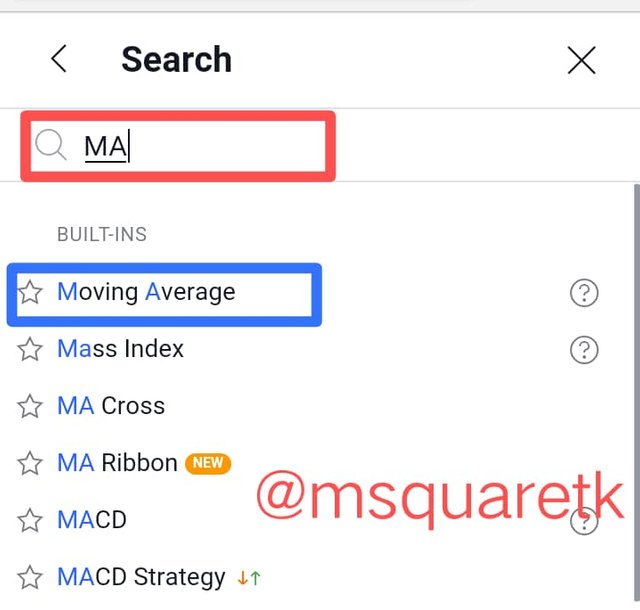
Click on this 'moving average' brought by the search tool bar. As it can be seen, moving average is the first indicator at the top. Moving Average will be added to the chart. But just single one. Repeat the process by clicking on the "fx' icon and add another one. Now two moving averages would have been added to the chart by doing that. Let's see the screenshot below
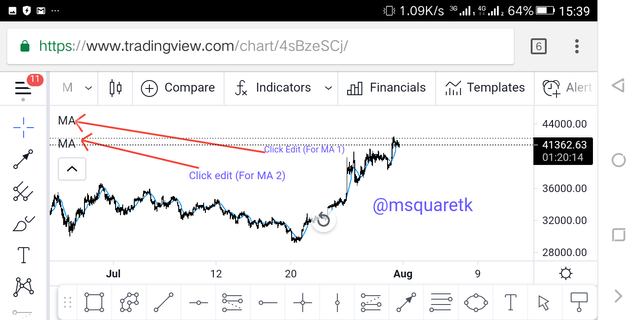
But as we can see in the chart above, there is a line on the chart. But in reality, we have added two moving averages, it is because the period and the color of the moving average is the same, so they are lying on each other. What can we do? If you look at the chart very well, you will see where I pointed two arrow signs, we are going to click on that "MA" and edit the period and choose different color for the two moving averages.
Clicking on the first "MA", it displays this. See the screenshot below.
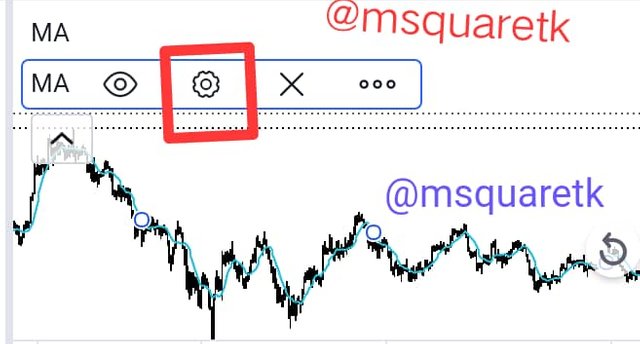
The gear icon in the screenshot above is actually where to click in order to edit the moving average.
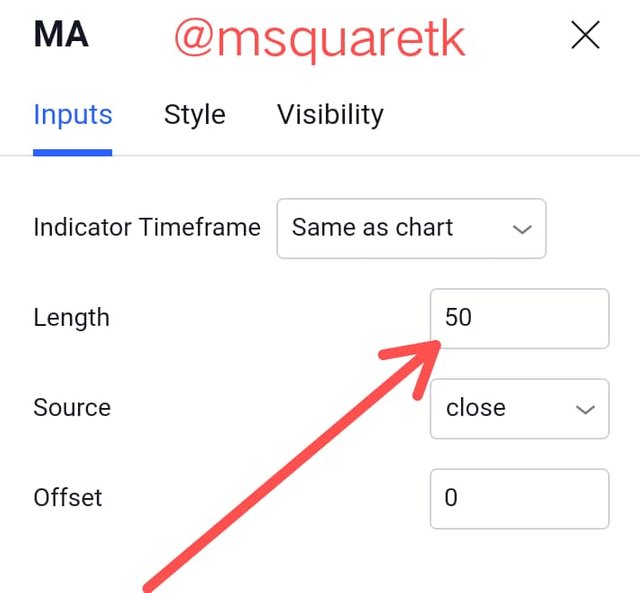
Clicking this, it will bring a box where we can set the length or period of the moving average. In the box, we will see three features at the top, input, style and visibility.
The input is where we will see where to set the length of the moving average we want to use. For the short term moving avreage, I chose the length to be 50 and input it on the box of length.
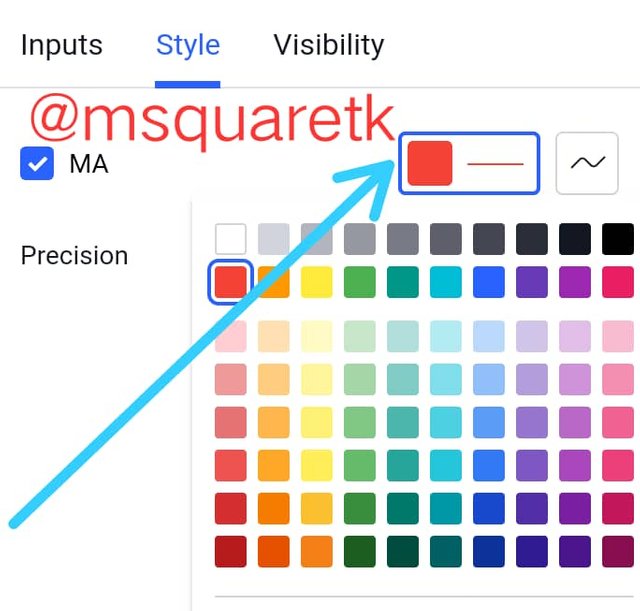
The style feature is where we will see different colors. I clicked on it and I chose the color for 50 moving average to be red. Let's see the screenshot below for guidance.
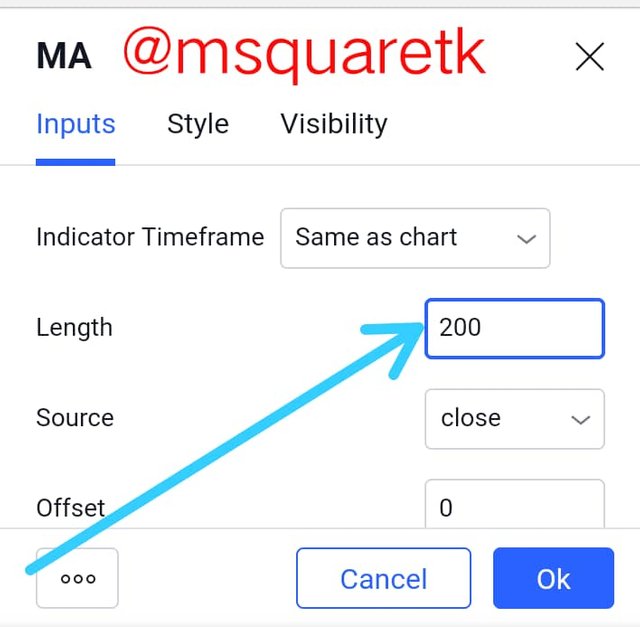
I repeated the same process above to set the length and color for the second moving average. In this case, I chose 200 moving average which is the long-term moving average. You would see that I put 200 in the box ofor the length. And also, I left the blue color for this moving average. See the screenshot below.
Now having set everything, let's go back to the chart and see if the moving averages have been added to the chart.
Now the screenshot below shows that the moving averages are on the chart.
Explain Death cross and Golden cross on the chart
Since, we have added moving averages to the the chart, it therefore very simple to explain the death cross and golden cross on the chart. But before we move further, it is important to remind ourselves that the moving averages we will use are Short term moving average and long-term moving average, which is 50 and 200.
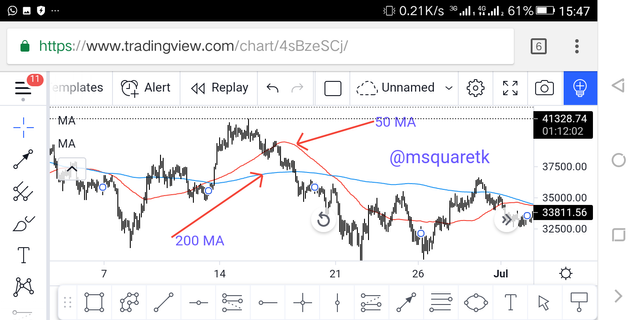
That being said. Let's see the screenshot below to see the death cross that occurred on BTCUSD chart, H1 timeframe.
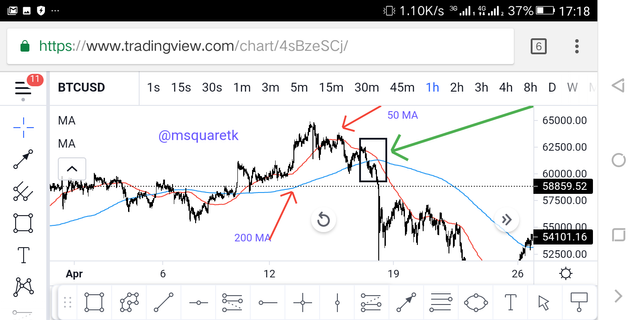
From the screenshot above, the color of 50moving average is red and that of 200-moving average is blue. Just as we know that death cross occurs when 50 moving average crosses below the 200 moving average. It can be seen in the chart above that the red color line (50-moving average) crossed below the blue line (200- moving average). The area I identified with a black square or rectangular box is where the death cross occurred.
Also, for golden cross I used the same pair BTCUSD and chart and the same moving average period, 50 and 200 were used. The screenshot below shows golden cross that occurred on H1 BTCUSD chart.
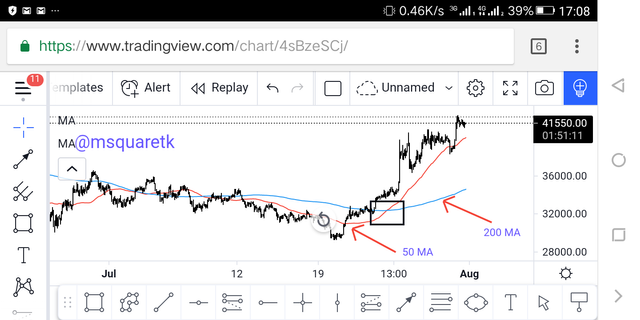
The color of 50 moving average is the same which is red and that of 200 moving average is blue.
The golden cross occurred on this chart when the red line (50 moving average) crossed above the blue line (200 - moving average) As it can be seen, the area identified with a rectangular box is where the golden cross occurred on this chart
QUESTION 3
• What is Binance P2P and how to use it ?
• How to transfer cryptocurrency to p2p wallet?
• How to sell cryptocurrency in local currency via p2p (any country or coin)(screen shot necessary to verify account)
What is Binance P2P and how to use it ?
To start with, the first thing we must understand is that Binance is a cryptocurrency exchange platform where people execute their trade. And P2P means Peer-to-Peer. Therefore, Binance P2P means cryptocurrency exchange that is done between users in binance platform without the help of any third party. For user to use Binance P2P platform, they must sign up with the platform and launch trade ads to sell and buy. In short, Binance P2P helps the users to buy and sell crpytocurrency with their national currency.
Users may also transfer their fund to P2P trading wallet from their spot wallet. With P2P trading, users can directly buy or sell crypto assets with each other. Additionally, Binance P2P support many fiat currencies. When users interact with each other through P2P trading, one can sell his asset in exchange for his country fiat currency or buy an asset with fiat money. It should be noted that there are more exchange platforms that also use the P2P trading.
How to Use Binance P2P
As mentioned earlier, Binance P2P allows user to buy or sell crypto asset by using fiat currency.
• To use Binance P2P, you must have account with binance and verified this account.
• Then login to your account. When you logged in, the first page you will see is the binance home page
• Then from the home page, click wallet
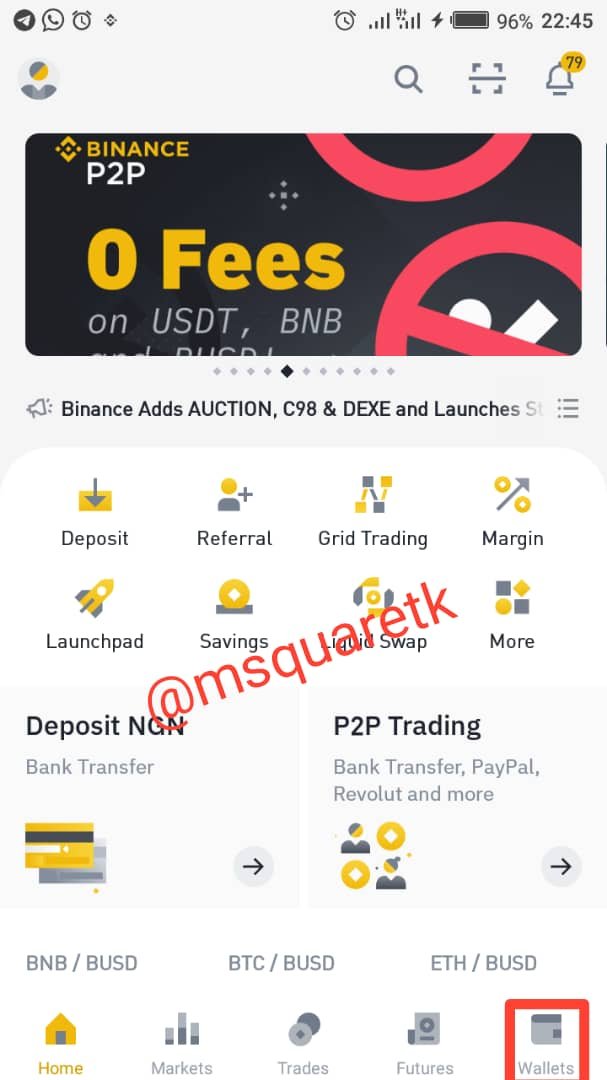
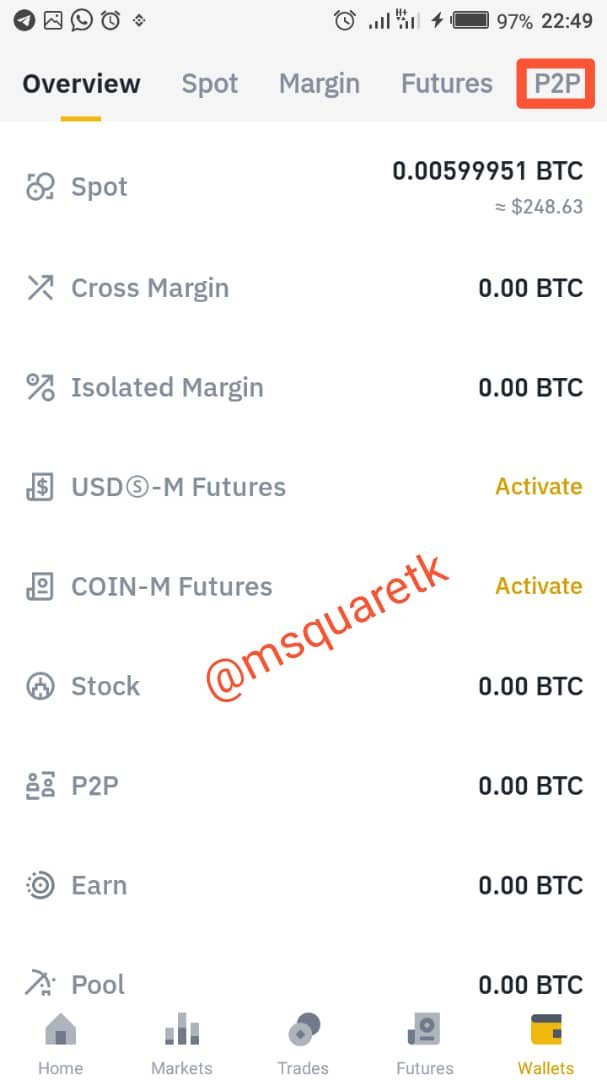
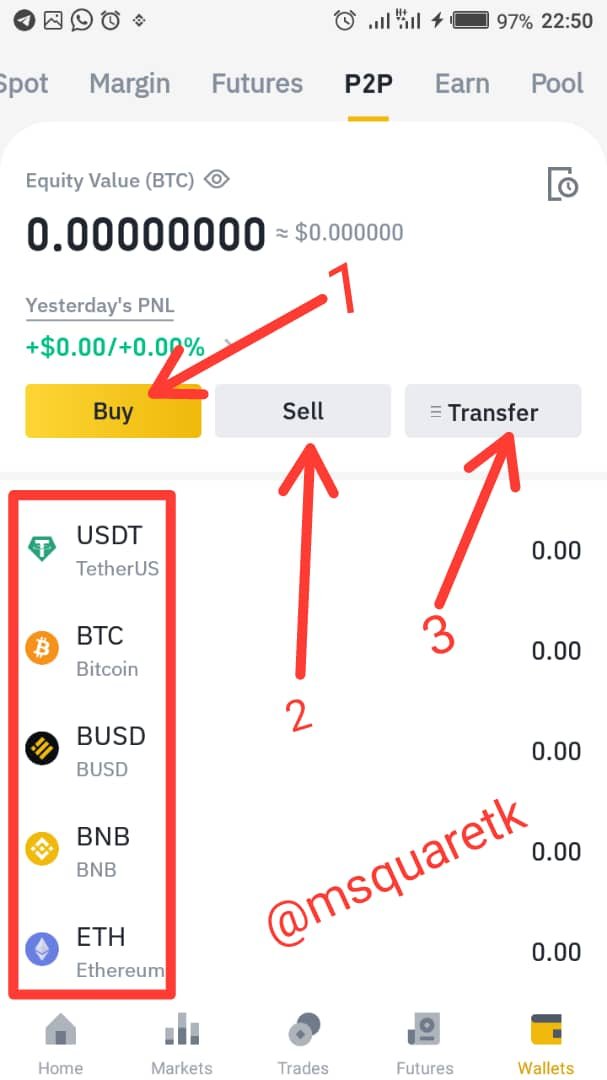
• From the wallet page above, click P2P, the placed in a red box. Then Binance P2P page will appear. Let's see the screenshot of Binance P2P page below.
From the screenshot above we have
1. Buy : This option allows traders to buy any crypto asset with fiat currency.
2. Sell : Sell allows trader to sell any cryptocurrency asset they are willing to sell in exchange any currency.
3. Transfer : This allows users to transfer cryptocurrency from binance P2P wallet to another binance wallet or from binance wallet to P2P wallet.
How to transfer cryptocurrency to p2p wallet?
To transfer cryptocurrency to P2P wallet in binance platform;
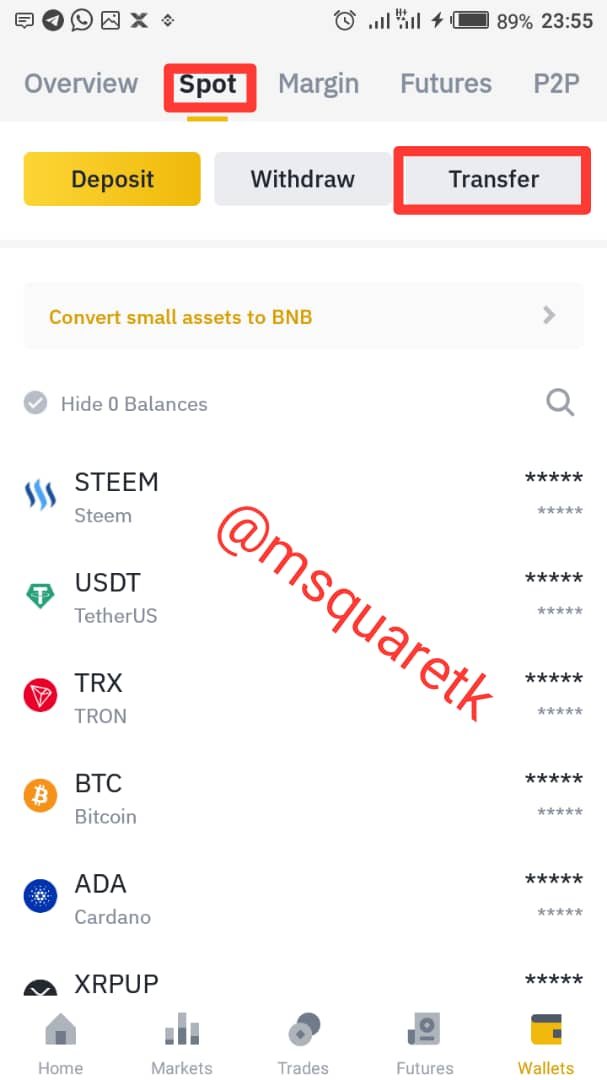
• Click wallet from your binance app
• Then click spot at the top of the wallet page
• Then click transfer as shown in the screenshot on the left page.
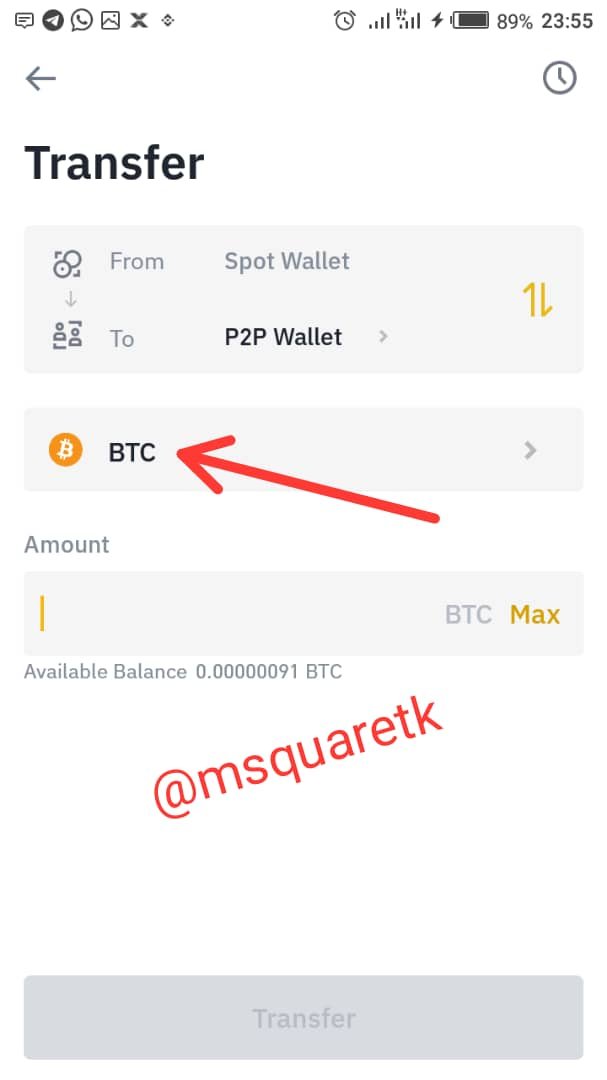
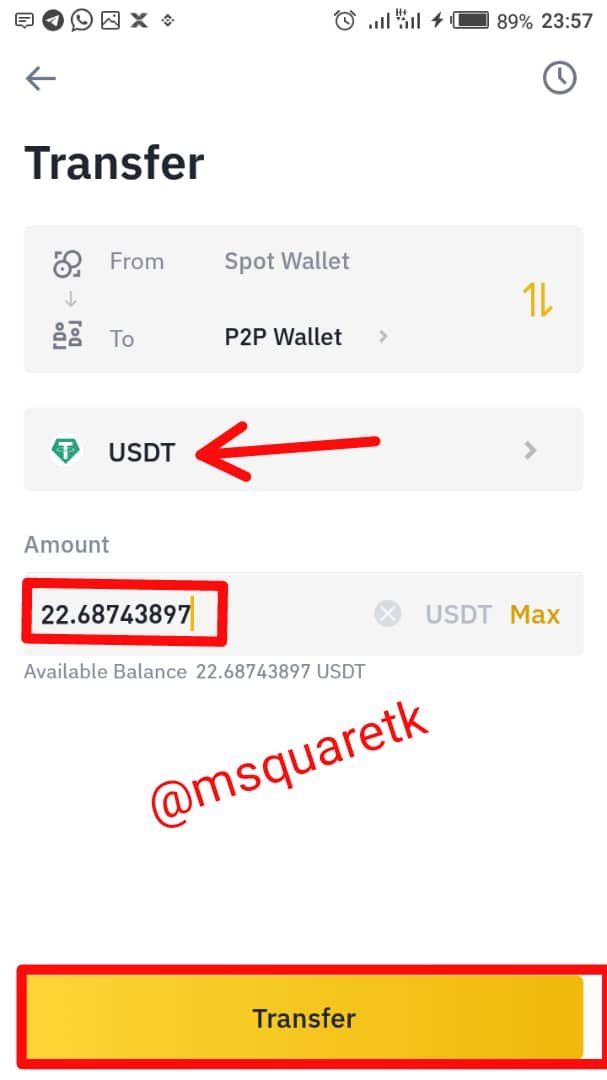
• Then a page to transfer crypto asset will appear. In this place we have BTC. But I want to transfer USDT to my p2p wallet, so I clicked on BTC to change it to USDT.
Let's see the screenshot of this process below.
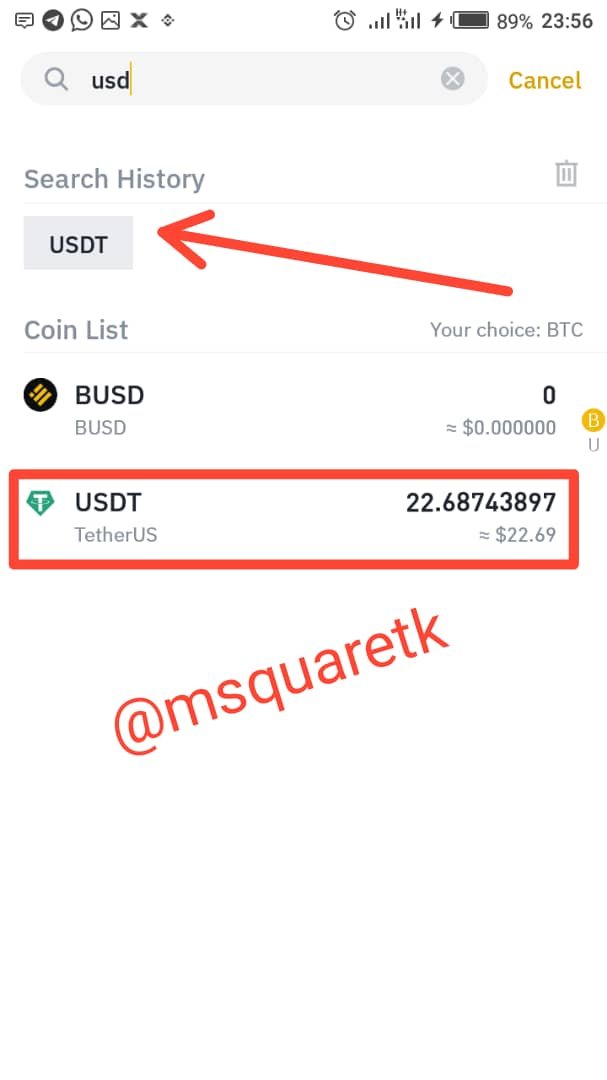
• After clicking on BTC, a search button will appear, search for USDT and I click it
• Then input the amount you want to transfer to your p2p wallet. In my case, I put all my USDT which is 22.687. After that, click transfer. Let's see the screenshots below
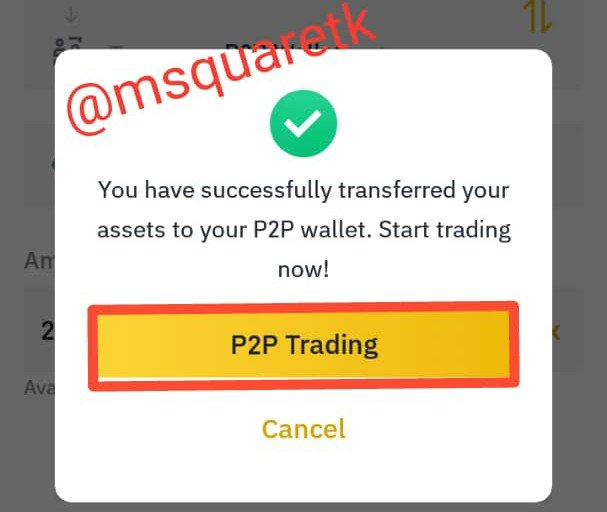
• Then a page will come up telling you you have successfully transfer your crypto asset to your p2p wallet. Let's see the screenshot of this page below.
How to sell cryptocurrency in local currency via p2p (any country or coin)(screen shot necessary to verify account)
Step 1
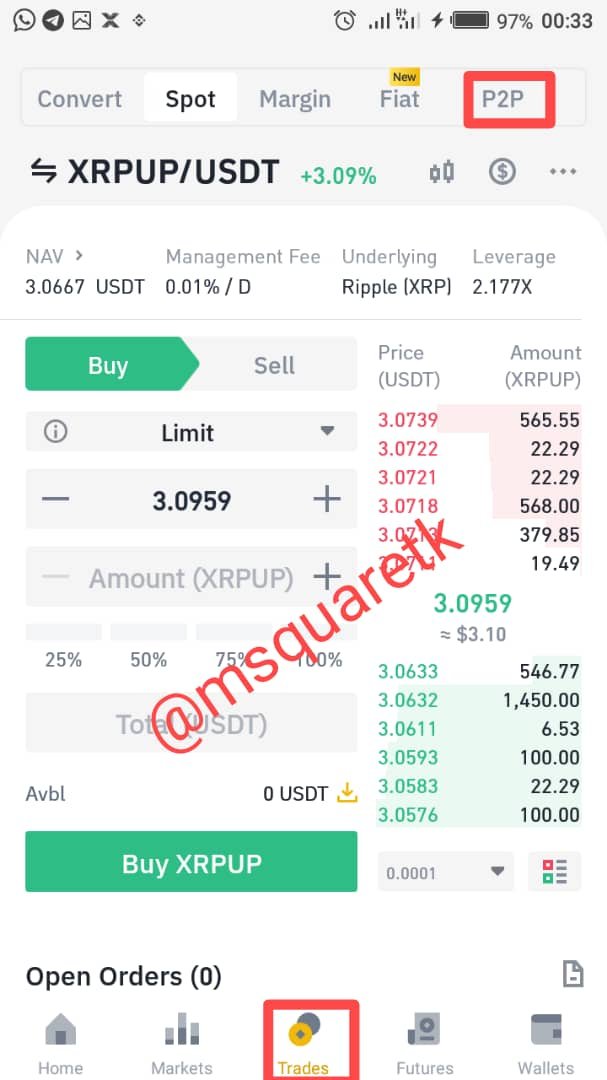
From your binance app, click trades at the bottom of the app then, click P2P at the top of the page. Let's see the secreenshot below
Step 2
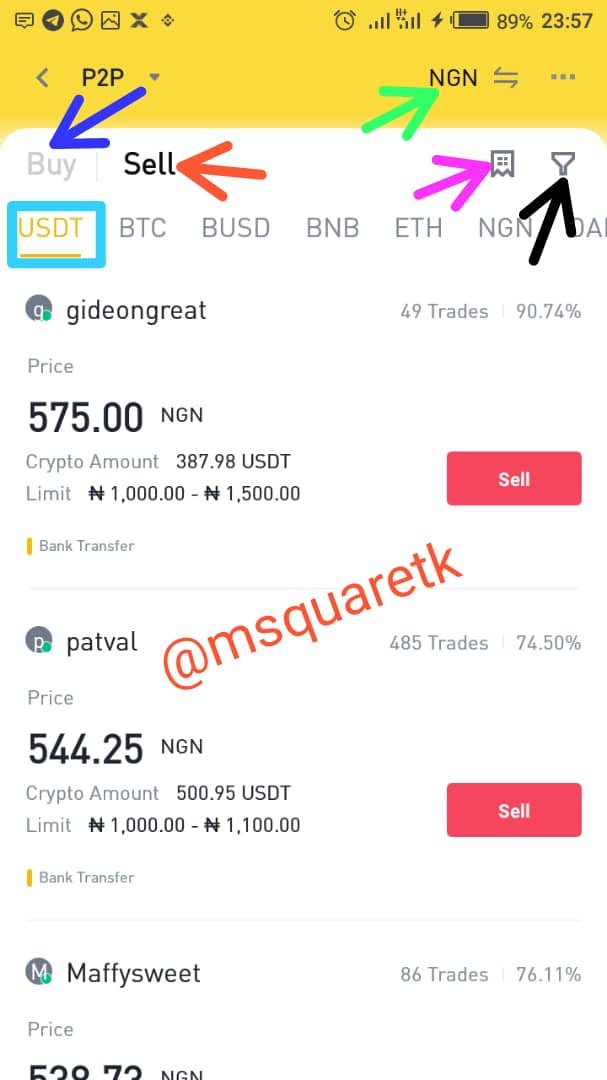
Then Binance P2P page will appear. In this page we have some features.
• The buy area, indicated by the blue arrow in the screenshot is where you will click if you want to buy any asset.
• The sell button indicated by the red arrow is a place to tap for you to sell your asset.
• The place where Green arrow is pointing to is where to change any national currency that you want to buy or sell with. In my case I put my National currency, NGN.
• The place indicated by the magenta arrow is the place to click to view order history.
• The icon like funnel at the top right conner of the page, indicated by the black arrow is the icon to click to filter ads. More will be added to this later.
• Lastly, you have many assets at the top of the page. From there, you can choose any asset that you want to buy or sell. For me, I sold USDT, that is why I clicked sell and picked USDT asset.
Let's see the picture of this step below.
Step 3
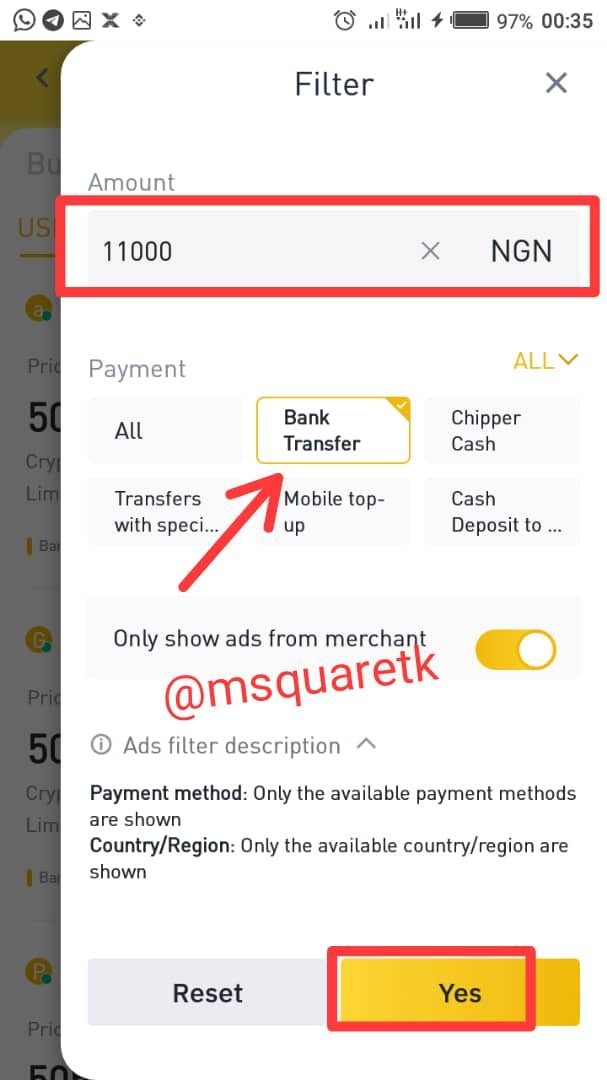
• Before you place your sell, it is good to filter. You filter to see buyer or sellers who are available to transact the amount of order you wish to place. With this, the system will just display many buyers or sellers who are within the limit of the total amount of order you want. Therefore, to do this, as mentioned above, click the funnel icon, indicated by black arrow in the screenshot above.
• When you click that, a pop up will appear to filter.
• From the screenshot, you will see total amount at the top of the page. Enter the total amount in your national currency, the number of asset you want to sell. In my case, I entered 11,000 NGN.
• Right below the amount, you will see payment. In this place, you can set the payment method that suit you. In my case, I clicked bank transfer.
• Also, you can check the "only show ads from merchant" as displayed in the picture and then click yes.
• Immediately you click yes, the pop up will disappear and you will have your p2p page, but now filtered. Let's see the screenshots of this step below
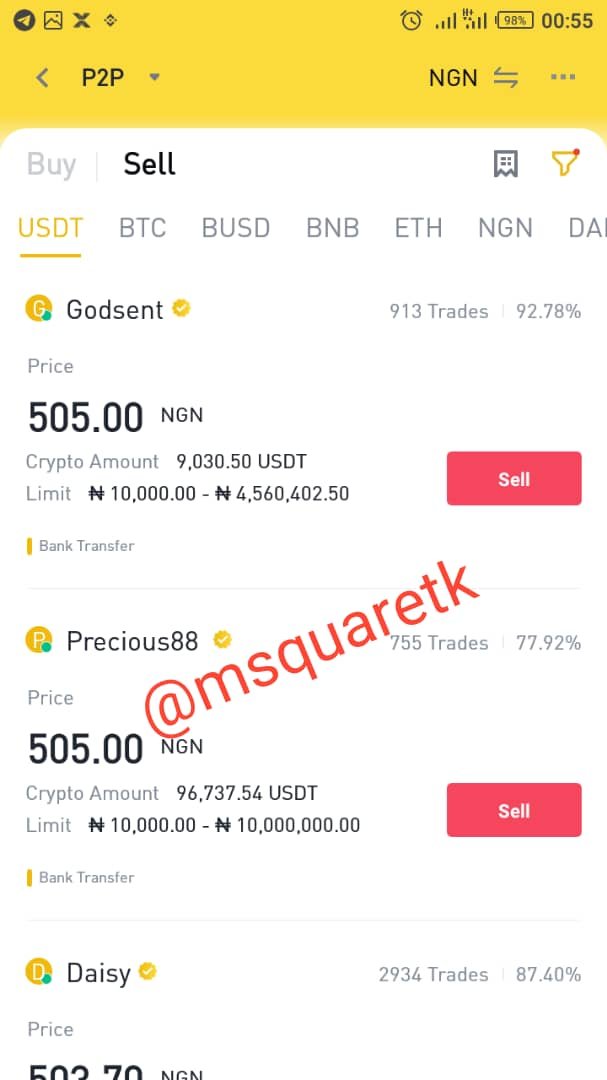
Step 4
• Then you will see a list of buyers who want to buy starting from the limit of the asset you want to sell. Click on anyone of your choice. In my case, I scrolled down and clicked on one buyer.
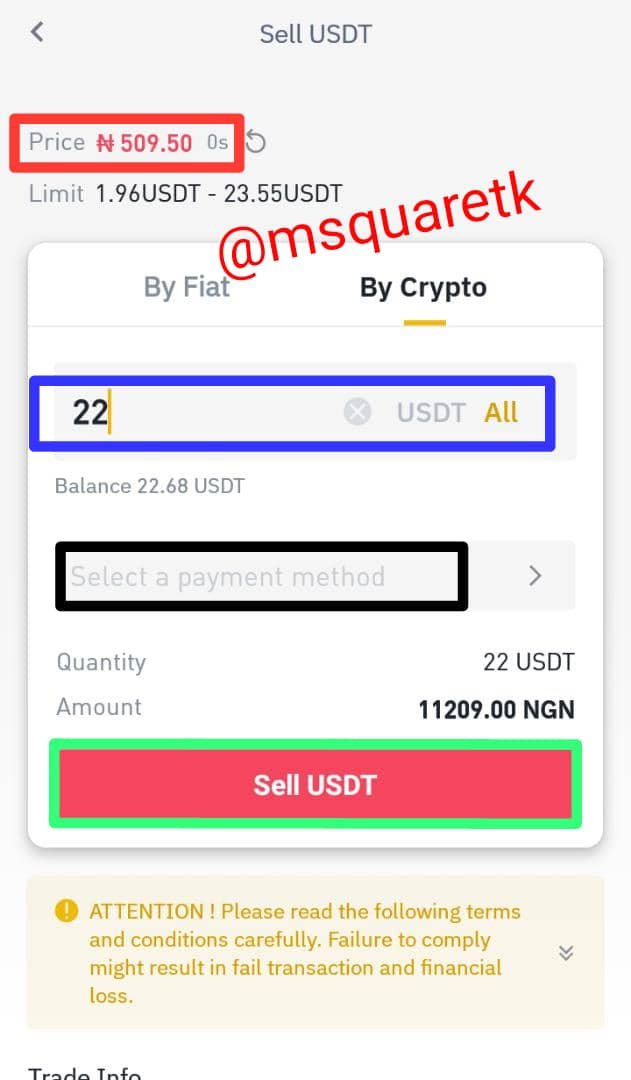
• After the above, a new page will appear immediately you click on the name of any buyer.
• Then from this page, you can set your order. Put the number of asset you want to sell. In my case, I put 22 USDT.
• Also, there is market price at the top left corner of the page. The price was 509.00NGN in the screenshot.
• Another important place is select payment method, boxed with black colour in the screenshot. Click it and select the payment method you want. I selected bank transfer for my own.
• Then click sell USDT
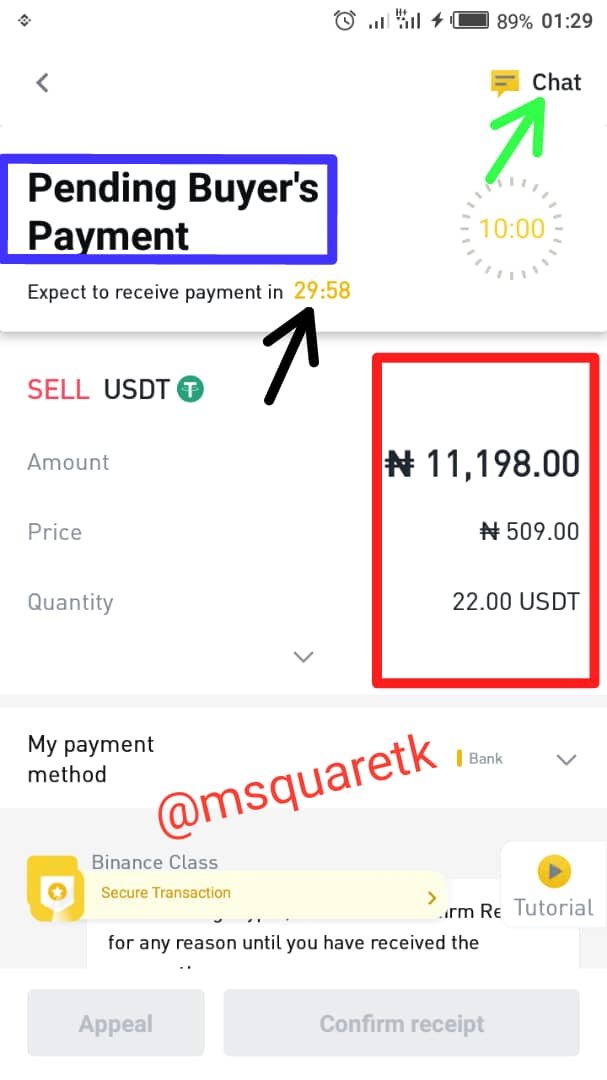
• When you click this, another page will appear, the page is the Pending Buyer Payment Page. In this page, you will see the details of the asset you just sold, the number of time the buyer have to transact before the order is cancelled. The time indicated by the black arrow is the time the buyer has. The icon indicated by the green arrow is the chat area where users can chat, that is, both the buyer and seller.
• You then wait for buyer to pay. If he doesn't pay before the time elapses, the order will be canceled automatically. Before we move on, let's see the screenshot of this step below.
Step 5
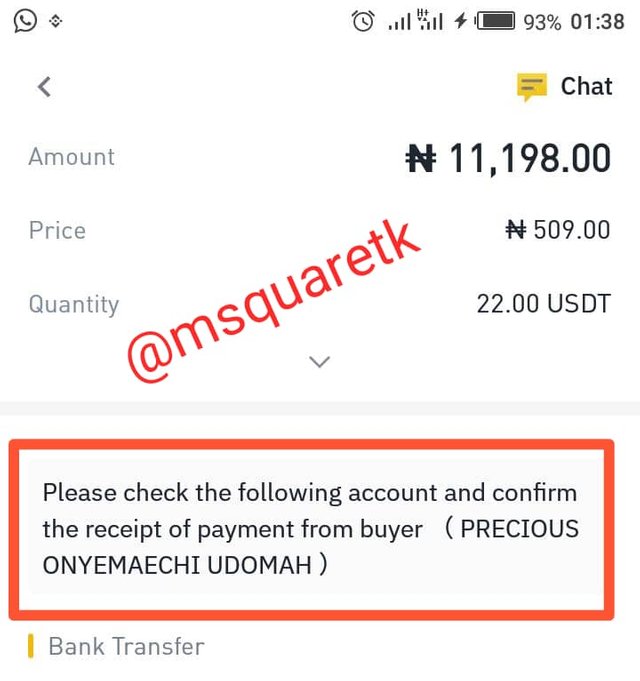
• You will see a notification when the buyer has sent the money to you via the payment method you chose. Then you will see a message that read thus; "Please check the following account and confirm the receipt of payment from the buyer"
Let see the screenshot of this below.
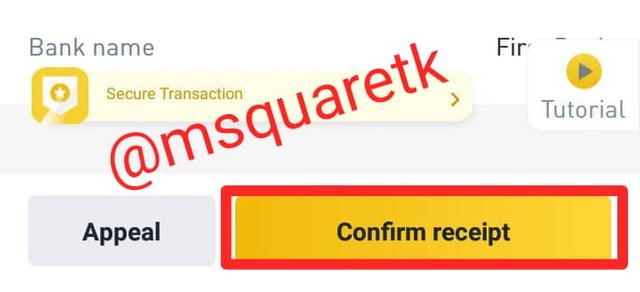
Step 6
• Then, check your mobile account to confirm. In my case, I opened my mobile account and confirm if the money has dropped and I saw that the buyer has sent the actual amount of USDT I sold.
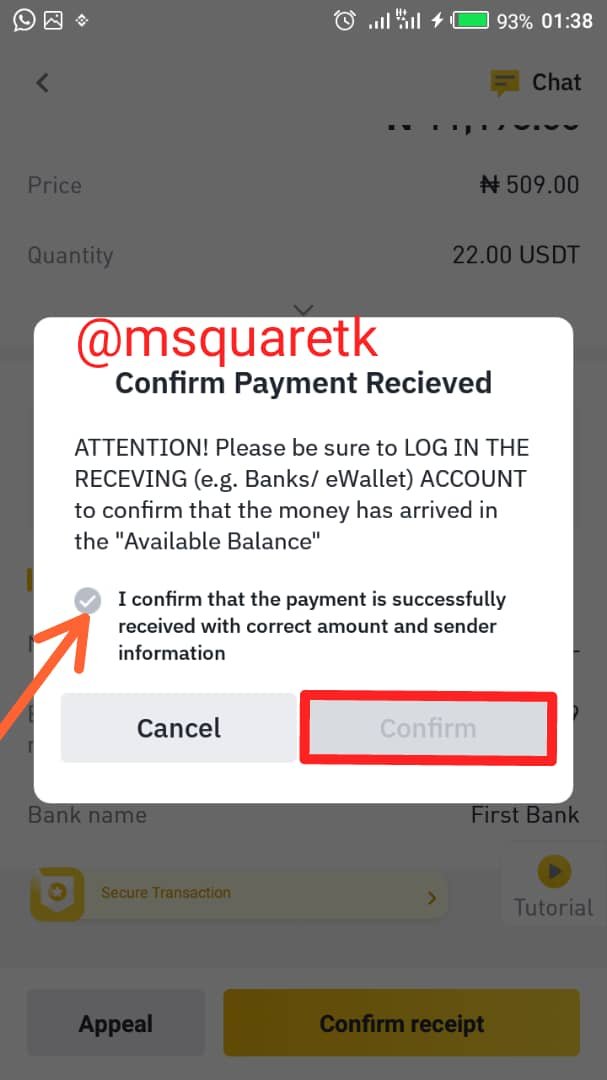
• Then you can go back to binance App and click confirm to release the asset. When you click this, a pop up warming will appear which I said above. Please always check your mobile account to know if the buyer has sent in money before you confirm his payment on the Binance App. Note that when you click confirm, the asset is no longer yours. So, always check.
The screenshots of this step are displayed below.
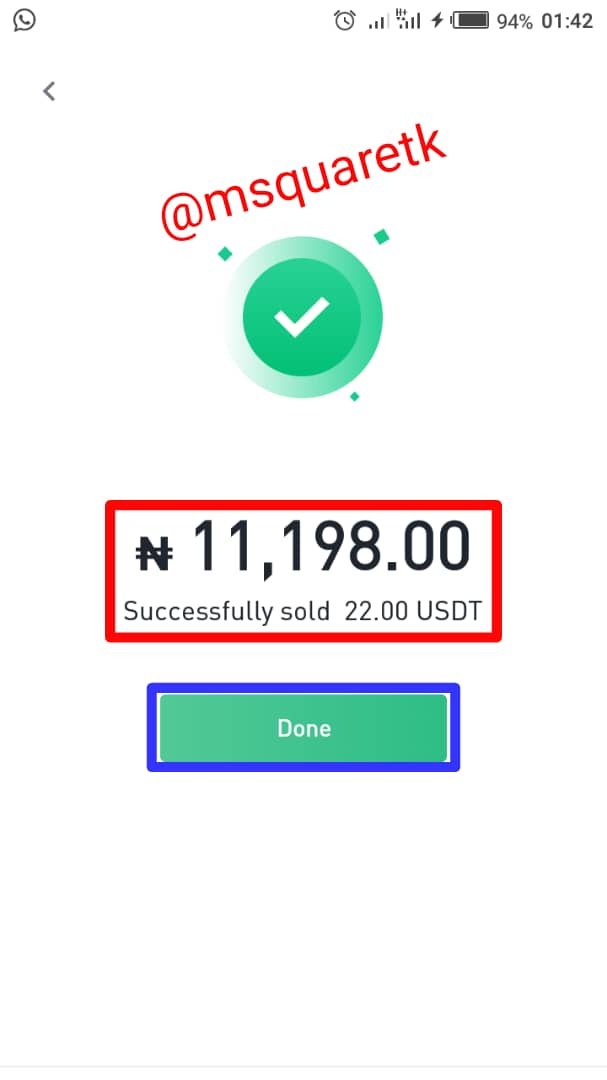
Step 7
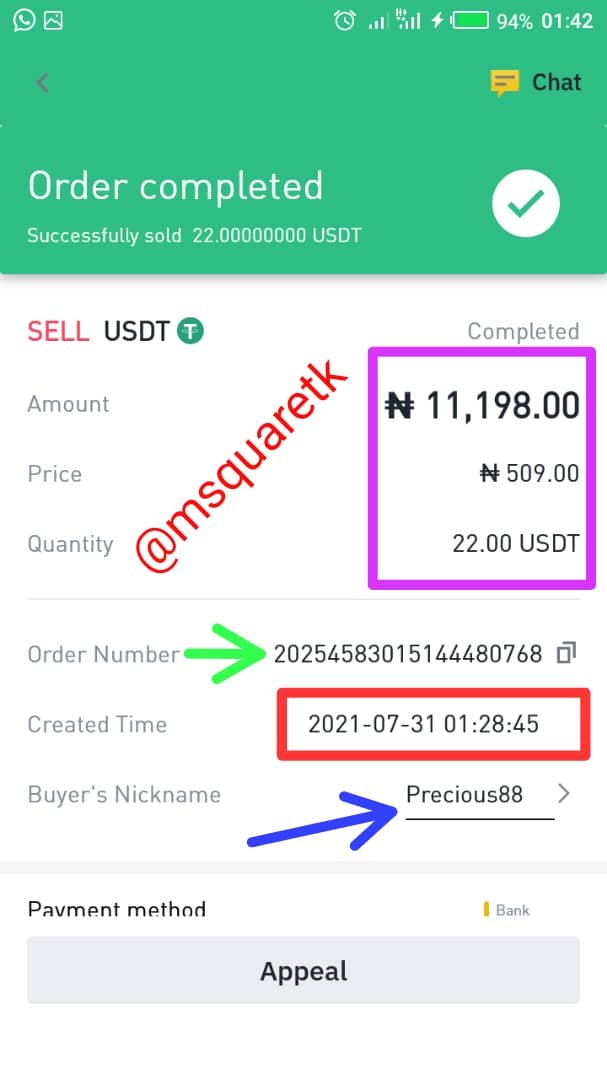
• Then when you click confirm, a page will appear and you will see Successful sold. That means you have successfully sold you asset. Then click done.
• You can see the order details or history immediately or by clicking the history in the P2P page as discussed in one of the screenshots above. Check below my order details
QUESTION 4
Things to Keep in Mind During P2P Trade
There are so many things to keep in mind during P2P trade. Some are listed below
- Don't be in a hurry to trade. If you are in haste, it is better not to trade than to trade and lose your fund. Lack of patience can make a trader to lose his fund. A trader who is in hurry to either buy or sell via p2p may not check some important details which may lead to lost of fund.
- Always confirm the receipt of any fund before you release your crypto asset. This is very important when you are selling asset. Confirm if the buyer has sent in the amount worth your asset in your mobile account or wallet as the case may be before you confirm him on binance p2p.
- The trading platform here is P2P. Never allow any third party. Allowing third party is dangerous. Be careful of this!
- When you are sending fund from your mobile account or doing bank transfer during p2p trade, always make sure that the account number and name tally with what you are given in the platform.
- Don't run trade ads when you are not online.
Advantages and Disadvantages of P2P Trading
Advantages
• The transaction process is easy
• There are wide ranges of payment method
• There is what is call escrow to monitor the security of the system.
• Buyers and sellers are always available because of market globalization
• Since it does not involve third party, transaction can be done at anytime of the day.
• Easy accessibility
Disadvantages
• Fraudster may scam people in p2p trading.
• One's order may be placed more than one time if the buyers or sellers list their ads while offline.
• There can be slowness in the system since every user will be working with his system.
CONCLUSION
The importance of golden and death cross can never be overemphasized as it has helped traders in many ways. The moving averages which is the indicator that are added to the chart to see death and golden cross is used to determine the trend of the market. When the cross occur either death or golden, it is often signifies trend reversal. I have learnt to use these indicators.
The development of Binance P2P platform is helping many traders to easily buy or sell their crypto assets, especially, some countries like Nigeria where buying or selling of cryptocurrency directly with fiat money is banned. Thank you Respected Professor @yousafharoonkhan. The lecture added a whole lot to me.
CC: Respected Professor @yousafharoonkhan
Written by: @msquaretk
Respected first thank you very much for taking interest in SteemitCryptoAcademy
Season 3 | intermediate course class week 5
thank you very much for taking interest in this class
Thank you , Respected Prof for the review