Crypto Academy Season 3 Week 5 | Homework Post for Professor @lenonmc21 | Trade with 'Simple and Exponential Moving Averages' + application of 'Fibonacci Retracements'

It is another week in the crypto academy. The past few weeks have been awesome. I must say I have learnt a lot of things in the academy from sagacious professors. The first lecture I started with this week titled "Trade with 'Simple and Exponential Moving Averages' + application of 'Fibonacci Retracements' on the chart" by Professor @lenonmc21 is very interesting and I believe the rest I will undergo would also be. Thank you Professor @lenonmc21. Anytime I undergo your lecture, I get value.
That being said. At the end of the lecture, we were asked to answer some questions in which it is in two parts, theory and practice. I'm going to be answering the questions one after the other.
The questions given are:
Theory (No images)
- Define in your own words what are simple moving averages and exponential moving averages.
- Explain how simple and exponential moving averages are calculated
- Briefly describe at least 2 ways to use them in our trading operations.
- What is the difference between simple moving averages and exponential moving averages (Explain in Detail)
- Define and explain in your own words what "Fibonacci Retracements" are and what their gold ratios are
Practice (Only Use your own images)
- It shows step by step how to add a "Simple and Exponential Moving Average" to the graph (Only your own screenshots - Nothing taken from the Web).
- Use "Fibonacci Retracements" to chart a bullish and bearish move (Own screenshots only - Nothing taken from the web).

THEORY (NO IMAGES)
1: Define in your own words what are simple moving averages and exponential moving averages.
Simple Moving Average
Simple Moving Average (SMA) is one of the indicators used by many traders. It is very popular because of lots of strategies attached to it. Moving average is a trend indicator. It is an indicator that calculates the average closing price of a particular assets of the last "x" periods. Where 'x' could be any time. For example, if a '10' moving average is used on a H1 (H1 means 1 hour) chart, it will calculate the average closing price over the past 10 hrs and then add it on the chart. It is important to know that moving average is added to the chart inform of line. Simple moving average just sums up the average without giving weight to recent price action.
Exponential Moving Average
Exponential Moving average (EMA) is another type of moving average which is used on the chart to know the direction of the trend. EMA unlike SMA calculates the recent price. Hence, it is not a lagging indicator like that of simple moving average.
2. Explain how simple and exponential moving averages are calculated
How Simple Moving Average is Calculated
Like I said above, simple moving average calculates the average closing price of an asset over a particular period of time. If we want to use 5 moving average on our chart, say 1Hr chart, then, a simple moving average will calculate average of each closing candle for 5hrs.
Let's try to see it in form of mathematics to understand it very well.
Assume: to use 5 simple moving average on H1 (1hour) chart.
Given that the closing price of the the candle for the past five (5) hours are: $30, $28, $28, $35, $34.
Now, moving average will sum these closing price together and divide it by 5. I.e ( 30+28+28+35+34) ÷(5) = 31.
Therefore the average of these values which is 31 is what will be plotted on the chart.
How Exponential Moving Averageverage is Calculated
It is pertinent to know that exponential Moving Average is used where the closing price of an asset is far to each other. And traders use EMA because it is not a lagging indicator. It calculate the most recent price. Let's see how to calculate it.
Assume we have a closing price of an assets for the past 4hrs on an hour chart as $2.5 , $32.1, $2.6, 2.8
If we notice in the price, there is a large closing price, this may be because of suddenly move in price which always result in spike up or down. The EMA is uses to correct the abnormality like this.
The following formula is used to calculate the current EMA:
EMA = Closing price x multiplier + EMA (previous day) x (1-multiplier)
Most traders still use Simple moving average, because even though it's slow to react fake outs are less.
Some traders use EMA are mostly after Volatile news events.
3. Briefly describe at least 2 ways to use them in our trading operations.
Moving Averages, both simple and exponential moving average are used to determine the trend in finance trading. This indicators are used by various kinds of traders. Majorly they are used in combination with other indicators to predict the the direction in which price is heading to.
Moving Average is used with a trend line. When the moving average crosses where candlesticks meets the trend line, they serve as confluence. In essence, they are used as confluence with trendline
Moving averages are also used with support and resistance. When moving averages cross at a support or resistance level, it gives the trader more reasons to take a trade. Therefore, moving averages are used with support and resistance Since moving averages are majorly used for trend, they are best for dynamic support and resistance (Dynamic support are support formed in slant direction when trend is bullish and Dynamic resistance are resistance formed in a slant direction when trend is bearish)
Also, They are used to predict reversal in a market. The golden cross at a very extreme area may signify reversal.
Both intra day and swing traders utilize this tools. However, the number of moving average they use differ.
4. What is the difference between simple moving averages and exponential moving averages (Explain in Detail)
Simple moving average (SMA) is a technical indicator which calculate the average closing price of an asset over a period of time. Simple moving average doesn't give the recent price.
Exponential Moving Average (EMA) is antype of moving average which calculate the recent price of data. Exponential moving average is also known as weighted moving average. It is called the weighted moving average because it gives the weight to recent price.
The calculation of simple moving average is very simple. It is just like average arithmetic. To add the closing price of the an asset together and divide them by their numbers, it will give us simple moving average. Whereas, exponential is very complex. It is not like moving average. Some traders believe that simple average is still most commonly used. However, the combination of the two are very powerful, especially golden cross that signify reversal or continuation of trend.
5. Define and explain in your own words what "Fibonacci Retracements" are and what their gold ratios are
Fibonacci retracement is one of the most important tools that has been proved useful. Almost all traders use Fibonacci retracement. The indicator is designed to use Fibonacci numbers. ** And the person who designed Fibonacci numbers is called Leonardo Pisano.
**The Fibonacci numbers are series or sequence of numbers in which the preceding number is the sum of two previous number. The number starts from 0 and 1. That's
0+1 =1
1+1 =2
1+2 =3
2+3 = 5
3+5 = 8
5+8 =13
and so on
0, 1, 1, 2, 3, 5, 8, 13 ............ n
Thus, Fibonacci retracement is an indicator which is used by traders to enter a continuation market. What do I mean by that? Let me explain in detail. As we know, price doesn't move as rocket. When price is a bullish momentum or run, it must definitely corrects itself. Now, Now when price moves and corrects itself, traders who didn't have opportunity to enter the first leg of the move wait for correction and enter. (Let me say that the first move of the price up is called "impulse" and the correction is called "retracement") It is this retracement phase that traders use Fibonacci retracement tool to predict in order to position themselves for the next move.
It is pertinent to know that the Fibonacci retracement is used both for bullish trend and bearish trend. (I will show in the next question Fibonacci retracement on bullish and bearish trend)
Before I mention Fibonacci golden ratios, it is important to know how Fibonacci ratios are calculated. Fibonacci ratio is gotten by dividing the previous number by the next second number to the right in the sequence
For example, in the list of the numbers I highlighted above as the Fibonacci numbers (0, 1, 1, 2, 3, 5, 8, 13, 21, 34, 55, 89, etc)
0/1 = 0
1/2 = 0.5
1/3 =0.33
2/5 = 0.4
3/8 =0.375
...................
13/34 = 0.382
etc.
Also, it is also gotten by dividing the previous number by the next to the right of the sequence.
0/1 = 0
1/1= 1
1/2 = 0.5
2/3 = 0.66
3/5 = 0.6
...................
34/55 =0.618
Now, the most important Fibonacci ratio that that is used by traders are:
✓ 38.2%
✓ 50 %
✓ 61.8%
✓ 76.8%
And the golden ratio is 61.8% or 0.618
Among these numbers, traders believe that, when price comes to 50%, the price is at equilibrium. That's equilibrium between the sellers and buyers.
These gold ratios are a very key levels, because traders believe that they resistance and support levels.
Practice (Only Use your own images)
1. Show step by step how to add a "Simple and Exponential Moving Average" to the graph (Only your own screenshots - Nothing taken from the Web).
In this question, I am going to show step by step way on how to add both simple and exponential moving average on the chart. For me, I will do this on MT4 platform
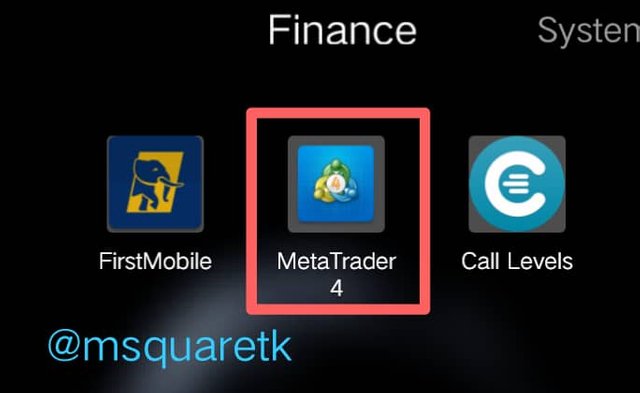
Step 1
Firstly, I navigated the apps to see MT4 on my phone. I then opened the app. See the screenshot below.
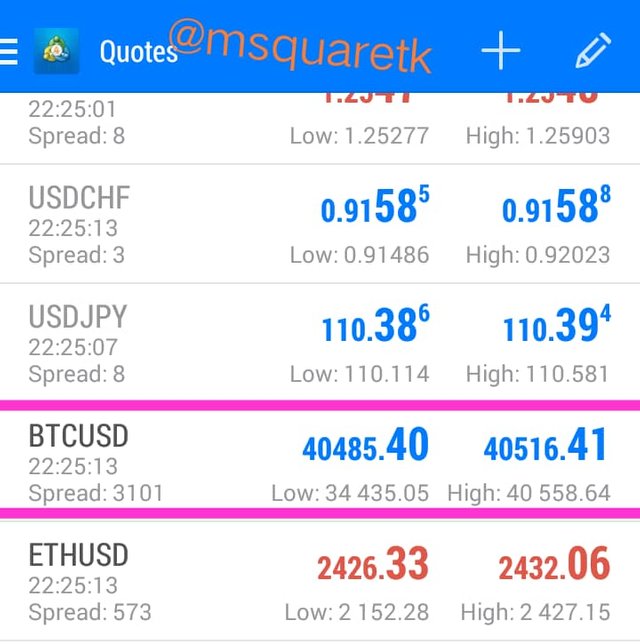
Step 2
The next step is to click on the pair you want to analysis or add moving averages to. For me, I clicked on BTCUSD. See the screenshot below
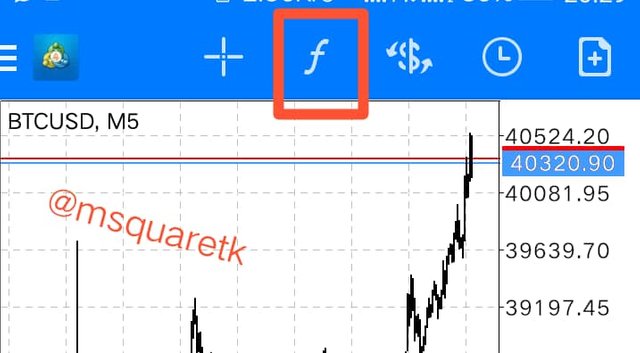
Step 3
After opening the pair, you see that it is showing only the chart. Look at the the top of the chart and click "f" icon. See the screenshot below.
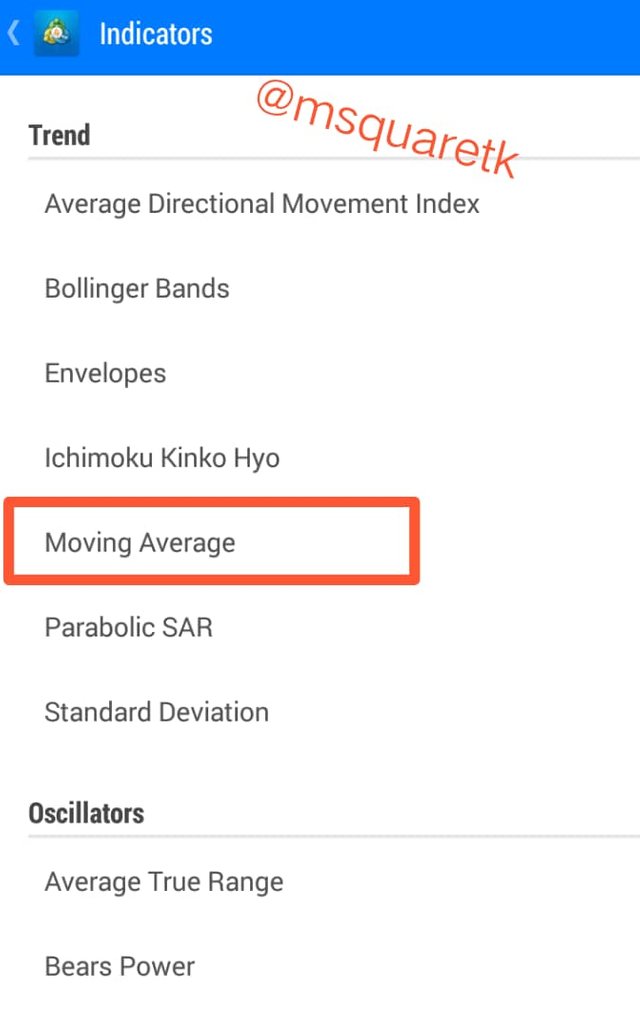
Step 4
The next thing is to locate the trend indicator. Then click on "moving average." See the screenshot below.
Step 5
Then, what we need to do now is to add simple moving average. For this exercise, I have decided to add "10" simple moving average and 50 exponential moving average.
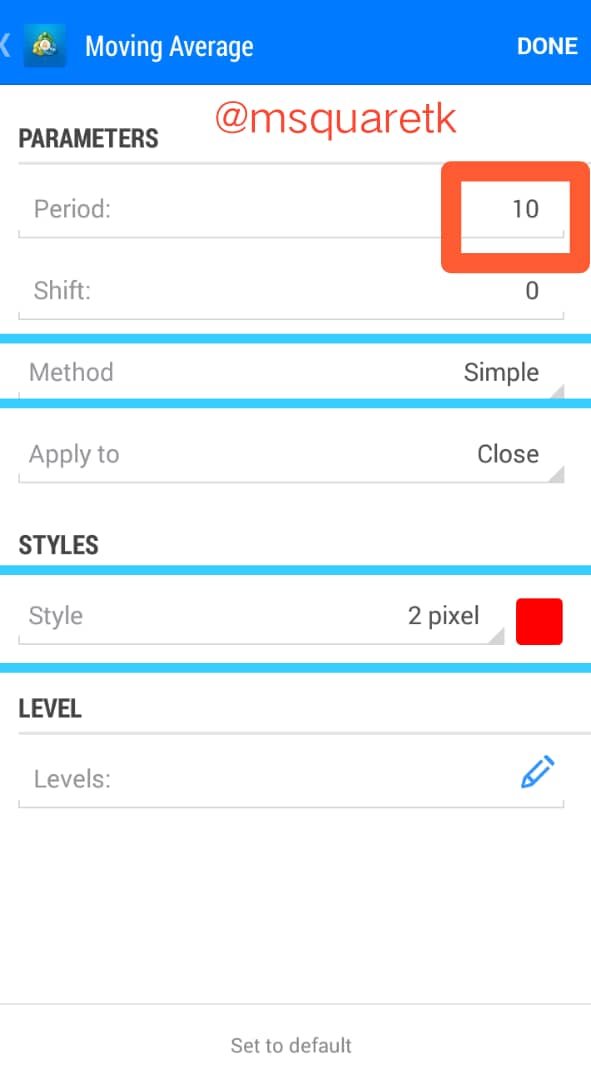
As it can be see in the screenshot, we can see some features which are of interest to us. For example, period. I changed the period to 10 and chose "simple" in the method. After satisfying with the settings, then I selected done. This 10 simple moving average will be added to the chart.
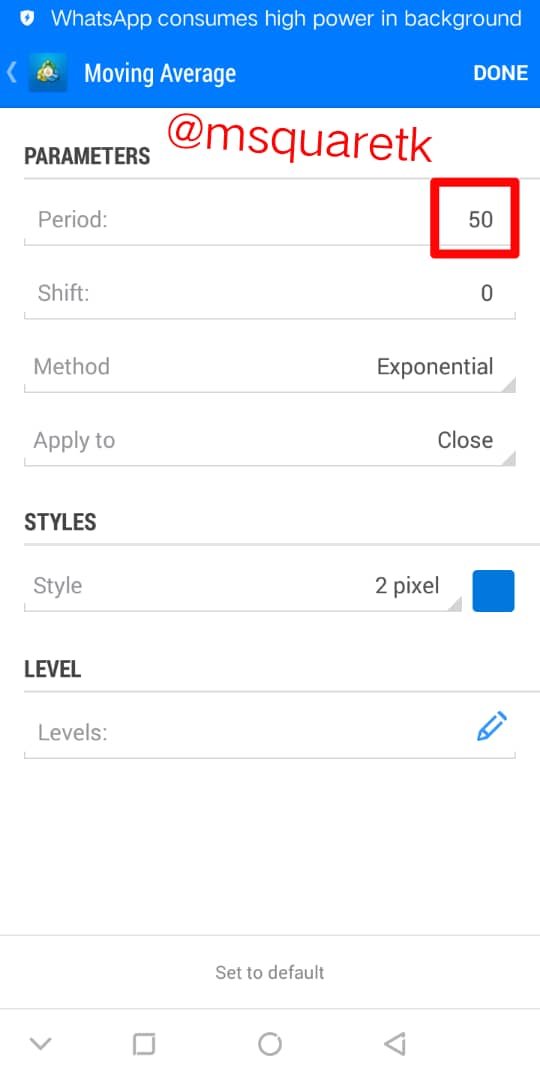
Here, for exponential moving average, I chose 50 for my period. And the method which is exponential that we want to add. After setting everything, then I then clicked done. This exponential moving average will be added to the chart
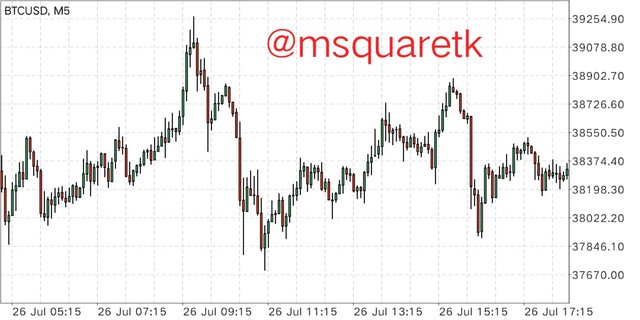
Step 6
Then, the next step is to return to the main chart to see if these moving averages have been added to the chart. See the screenshot below.
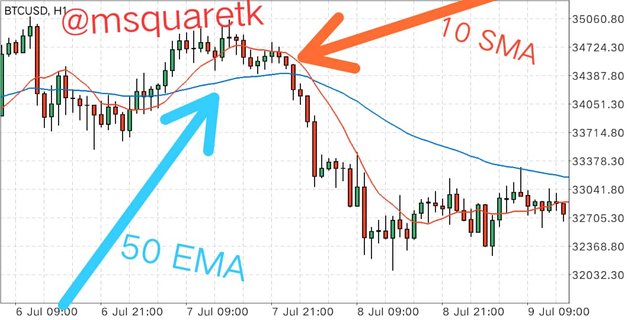
As it can be seen, the moving averages have been added to the chart. The red line on the chart is 10 simple moving average and the blue line is 50 exponential moving average.
2. Use "Fibonacci Retracements" to chart a bullish and bearish move (Own screenshots only - Nothing taken from the web).
Using Fibonacci Retracement to Chart a Bullish Move
Now, the first thing to do is to navigate to where Fibonacci retracement tool is. For the MT4 platform, we tap on the chart. Let's see the image below to see what we will click.
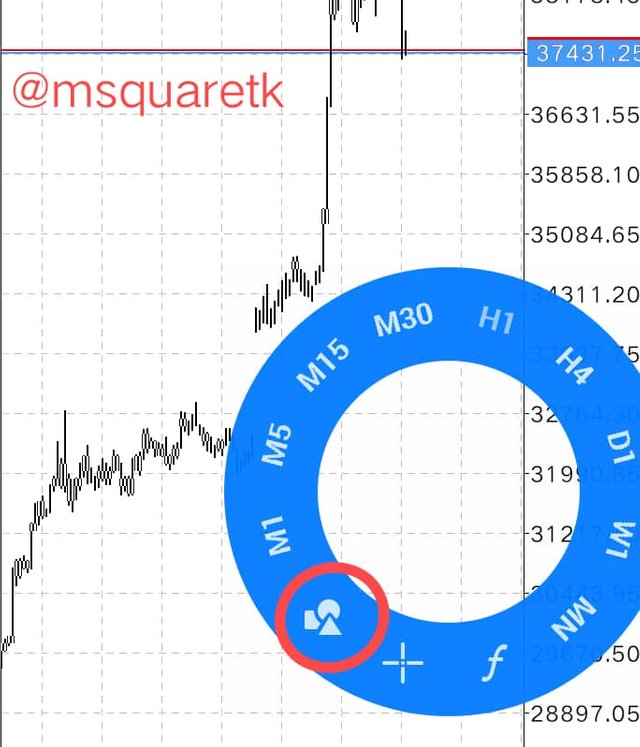
The next thing is to click on the circled icon.
After that, it will display this:
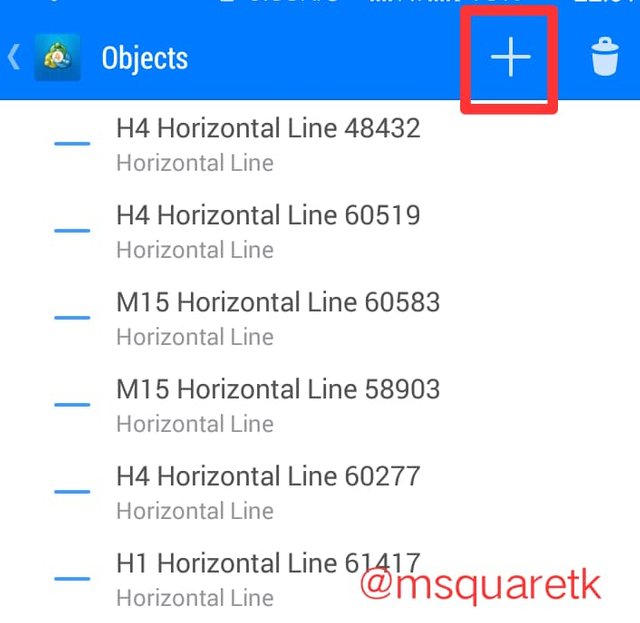
Then click the plus sign boxed in rectangle. After that, it will show where to add Fibonacci retracement. See the screenshot below
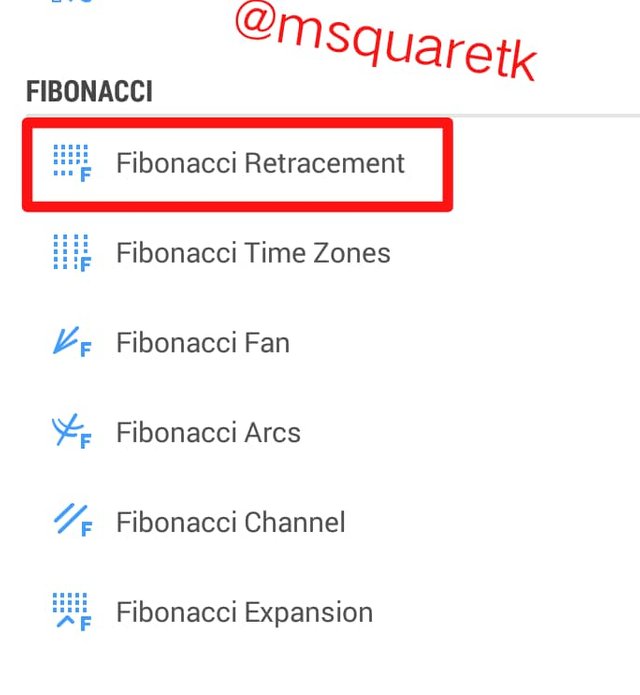
Now the Fibonacci retracement is set already. We can use the default settings or we can edit the settings to add to it depending on our trading strategies.
Now let's see the screenshot for a bullish chart using Fibonacci retracement
To draw Fibonacci retracement on a bullish trend, we draw from the lowest or start of the move to the highest or peak of the bullish run. Below is the screenshot.
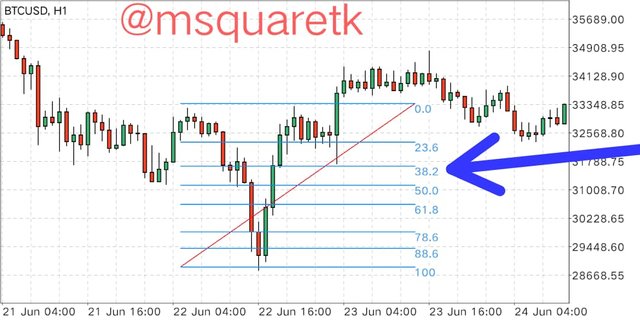
The retracement of this move dipped to 32.8 which is one the key levels which traders wait for to take trade. Then it moved up and continued the bullish run.
Using Fibonacci Retracement to Chart a Bearish Move
To draw a fibonacci retracement for a bearish move, we draw from the highest point where the bearish move start to the lowest point where it starts retracing. Let's see the screenshot of this below.
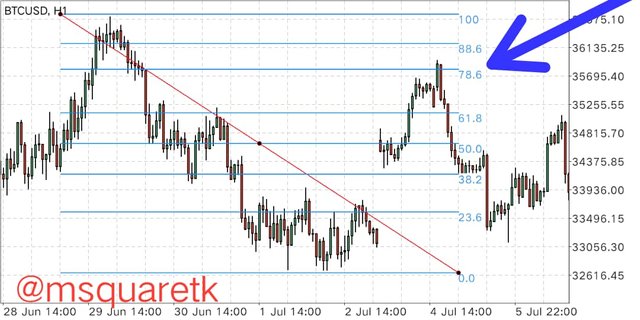
As it can be seen from the screenshot, the price retraced to 78.6 % of the final and the bearish move continued.
Conclusion
Moving Average is an indicator which is used by many traders. I have learnt to use the two types of moving averages, simple and exponential moving averages. I have also learnt to set these moving averages not chart.
Fibonacci retracement is one of the indicators that is popular because of the Fibonacci numbers that's used to design the tool. Fibonacci retracement is used for both bullish and bearish trend. The ratios used in taking trade are considered as area of key supports and resistances.
CC: @lenonmc21
Written by @msquaretk
You've got a free upvote from witness fuli.
Peace & Love!