Crypto Academy Season 3 Week 4 | Homework Post for Professor@reminiscence01 | Candlestick Patterns
So I will be answering these questions one after the other.

1. In your own words, explain the psychology behind the formation of the following candlestick patterns.
• Doji Candlestick pattern
• The Hammer candlestick pattern
• The morning star candlestick pattern
• The evening star candlestick pattern.

Bullish Engulfing Candlestick Pattern
Bullish engulfing candlestick pattern is type of candlestick pattern that forms when sellers have been exhausted the buyers take hold of market. The candlestick pattern forms when the bullish candle that forms engulf, cover up the last bearish candle.
Let's see the image of bullish engulfing candlestick pattern below
.png)
This candlestick pattern when formed on the support level, it usually signifies reversal. The last bearish candle that forms must be smaller in size to the previous ones formed in the down trend. This actually means that the sellers have been over powered since there is no much volume to the downward side. As soon as a bullish candle forms and the candle engulfs (Engulfing means that the bullish candle covers up the other candle with total body) the last bearish candle, it means the buyers have gained momentum and that the price may reverse.
It is pertinent to know that the bullish candle that forms must close above the opening of the bearish candle. If that doesn't not happen, it means the candle doesn't engulf.
Doji Candlestick Pattern
Another important candlestick pattern that traders use to position themselves in finance trading is doji candlestick pattern. Doji candlestick pattern can be either reversal or continuation pattern. Doji candlestick pattern forms when sellers and buyers are dragging price between each other. The sellers want to push price down and buyers want to push price up. This period, where there is no clear way, that is whether the odd will favor sellers or buyers, is often called indecision period. Let's see the image of a doji candlestick pattern below
.jpeg)
The closing and opening of price in doji candlestick pattern is almost the same as there is no clear difference between them. Traders have given many names to this candlestick pattern. As it can be seen from the image above, sometimes this candle forms in such a way that the closing and opening price is very close to the high of the price. In such a case, there will be a long tail will form from the low of the price and vice versa. But the normal doji forms in when the opening and closing of the price form at the middle, leaving both upper and lower shadow almost the same.
Hammer 🔨 Candlestick Pattern
As its name sounds, hammer Candlestick Pattern is in form of hammer. It is formed after the price has been in a very downward momentum. When this downward momentum is about to shifted to upward momentum, the hammer Candlestick pattern forms. In essence, this pattern forms after the the sellers drag price downward and because the buyers came in to the market with a very strong momentum which greater than that of the sellers, the draw the price up significantly to the extent that it leaves a long tail. This long tail signifies rejection.
Let's look at the image of the hammer Candlestick pattern below:
.png)
Notice that in the image, the color of the candles is green and red. The color doesn't matter as long as this pattern forms on a support level and after a very downward trend. All these pattern when form on higher time frame, they are strong.
The Morning Star
The morning star is a type of pattern which forms when a price wants to reverse after the market has been in a downtrend for a long period of time. It is a reversal pattern. When it forms at a support level, especially higher time frame, it will drive price up. Let's see the image of the morning star below
.png)
The morning star forms when the sellers are exhausted the selling pressure. I is comprised of a large bearish candle, follows by an indecision candle, a small candle and a large bullish candle. The bullish candle forms in the direction of the upward trend must engulf the small indecision candle.
The Evening Star
The evening star which is the opposite of the morning star is a candlestick pattern that forms at a resistance level. It is a bearish reversal pattern. When it is spotted on higher time frame, traders do take advantage of it to ride on the bearish trend.
Let's see the image of the evening star below
.png)
This pattern comprises of a large bullish candle, and indecision candle which signifies exhaustion and follows by a large bearish candle which engulfs the indecision candle.

2. Identify these candlestick patterns listed in question one on any cryptocurrency pair chart and explain how price reacted after the formation. (Screenshot your own chart for this exercise)

For identification of these candlestick patterns on the chart, I have decided to use BTCUSD pair and MT4 platform.
Identification of Bullish Engulfing Candlestick Pattern
Now let's start by identifying bullish engulfing candlestick pattern on the chart.
Below is the screenshot of the bullish engulfing candlestick pattern

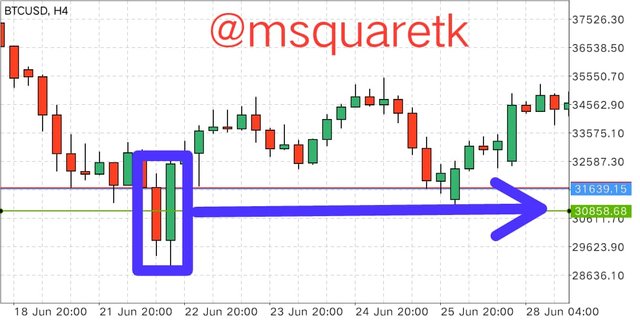
As it can be seen in the screenshot, we have a bullish engulfing pattern after the market has been in a downtrend for a particular period of time. The chart on H4 time frame. After the formation of the pattern, the price rally up and came to retest the 50% of the bullish candle. It
therefore can be seen that bullish engulfing candle pattern is a reversal pattern when formed on a support level.
Identification of Doji candlestick pattern
Now, having identified bullish engulfing, let's try to see doji candlestick pattern on the chart. See the screenshot below
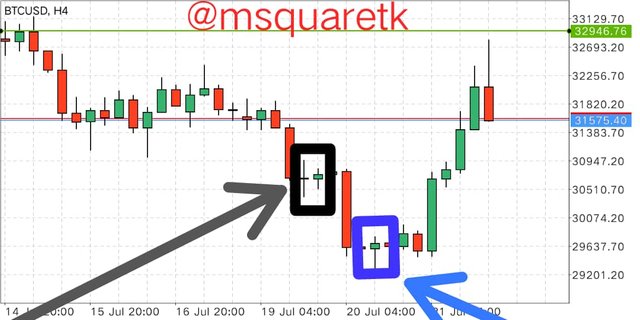
As it can be seen from the screenshot, doji candlestick pattern can be a continuation pattern and a reversal pattern. The one forms in the middle of the bearish trend with black color rectangular box is a continuation pattern, while the one that's formed at the bottom is a reversal pattern which drove the the price upward.
Identification of Hammer Candlestick Pattern
Another pattern which we will see on the chart is hammer candlestick pattern. Below is the screenshot of the hammer candlestick pattern on H4 time frame.
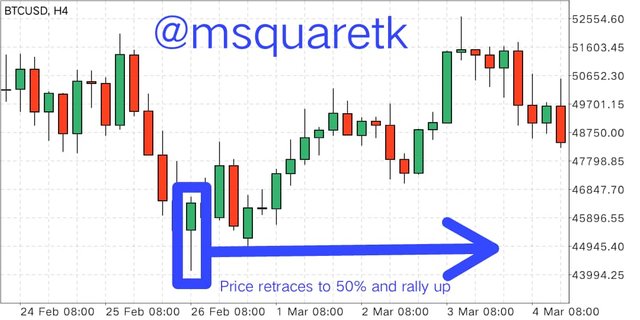
Like I said earlier, hammer candlestick pattern is a reversal pattern. In the screenshot, hammer candlestick pattern formed after the market has been on down trend. After the formation of this pattern, the price rally up for a moment, about 8 hrs and retrace back to the 50% of the candle at about 12hrs. From there, the price rally up with a very great momentum.
Identification of the Morning Star
Let's see this screenshot for an example of the morning star on the chart.
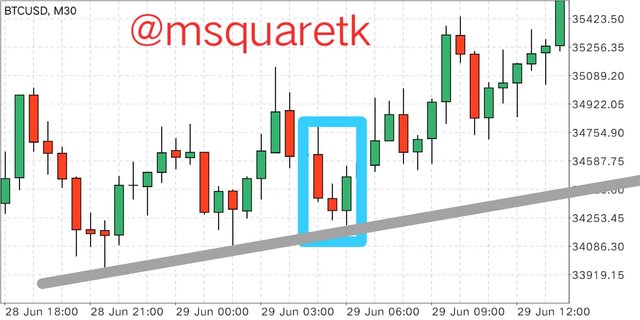
The price has been moving in a upward trend on M30 timeframe BTCUSD chart. After the price broke the structure up, the price retraced downward and needed to reverse to continue it's uptrend. The morning star formed and then the price boom upward.
Identification of the Evening Star
Lastly on this part, we are going to identify the evening star on the chart. See the screenshot of evening star below.
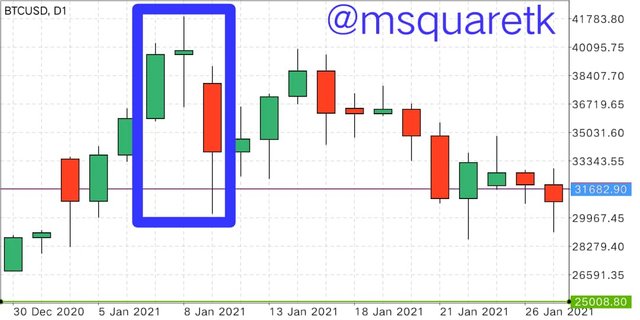
The evening star formed at a key resistance level. After the formation of this pattern, price rally down. This pattern is a reversal pattern that when spotted, the traders can take advantage.

3. Using a demo account, open a trade using any of the Candlestick pattern on any cryptocurrency pair. You can use a lower timeframe for this exercise.(Screenshot your own chart for this exercise).

In using one of these changes pattern. I will use bullish engulfing candlestick pattern on M5 BTC chart.
I spotted a bullish engulfing candlestick pattern. Below is the the screenshot
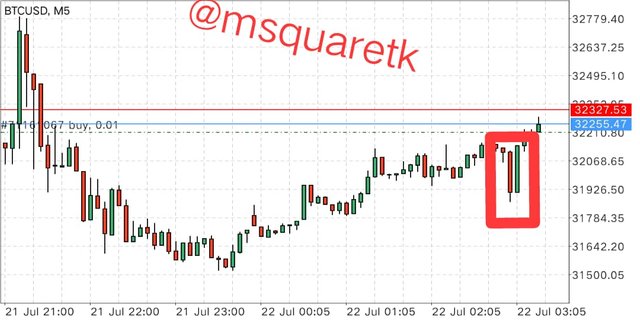
Then, knowing that the market has retraced and formed at a key level based on the time frame M5, I placed the trade with 0.01lot size, set both stop loss and take profit.
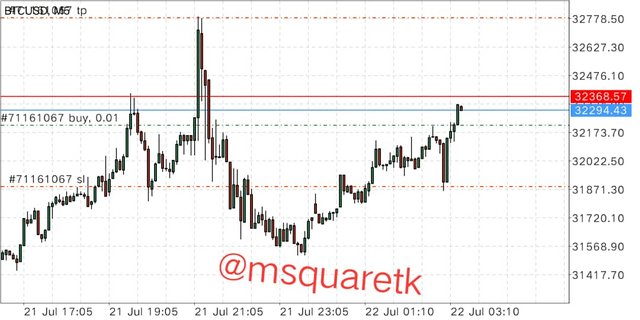
Stop loss was set below the opening of the bullish candle and take profit was set to the next supply or resistance zone.
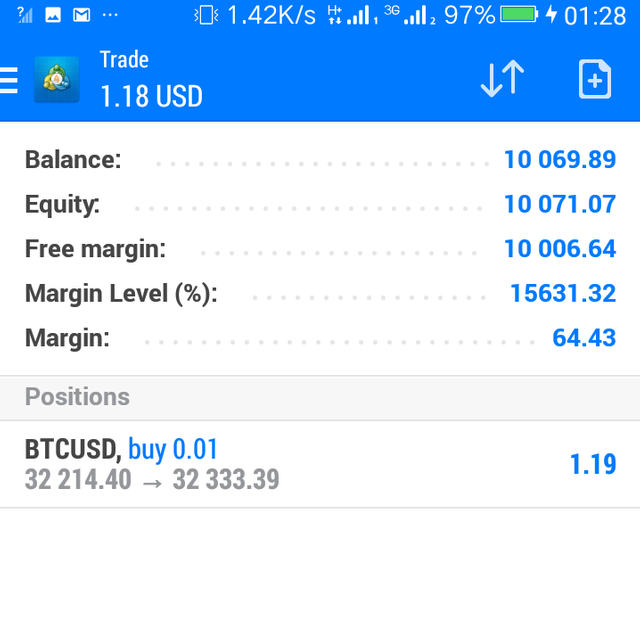
Some moments after I executed the trade, boom! I'm already in profit. See the screenshot below.

Conclusion

Candlestick patterns are used by traders in finance trading to know when the reversal or continuation of the trend will happen. These patterns are very useful as they signify important turning points in the market. These patterns are formed as a result of behavior of sellers and buyers in the market.
It is important to know that traders use these patterns together with others tools. When combined with other tools or indicators, they are very effective. It is therefore important to learn this pattern, know them, the psychology and anatomy behind their formation.

CC: @reminiscence01
Written by @msquaretk
Hello @msquaretk, I’m glad you participated in the 4th Week of the Beginner’s class at the Steemit Crypto Academy. Your grades in this task are as follows:
Observation
It depends in your trading style. But the higher the timeframe, the stronger the signal.
Recommendation / Feedback:
I'm impressed with your submission. You gave a technical explanation of candlestick patterns and the psychology behind its formation.
Thank you for completing this homework task.
Good work done bro... Can I have ur WhatsApp number? I want to have a chat with you 😊