Crypto Academy Season 3 Week 2: Homework Post for Professor @reminiscence01 | Introduction to Charts

Design by @msquaretk
App: Canva
• Explain the Japanese Candlestick Chart? (Chart screenshot required)
• Describe any other two types of charts? (Screenshot required)
• In your own words, explain why the Japanese Candlestick chart is mostly used by traders.
• Describe a bullish candle and a bearish candle identifying its anatomy? (Screenshot is required).

EXPLAIN THE JAPANESE CANDLESTICK CHART

To explain this question well, let me start by saying that, there are key words in the question which must be understood. These are: candlestick and chart.
CANDLESTICK
Candlestick is like candle. Candlesticks are one of the components of graph in crytographic trading. They form up and down movement of price in a finance trading.
CHART
Chart, from our basic knowledge of economics, is an information given or provided in form of graphs or table. A chart always contains information about something.
Having defined those two key words, what is now a Japanese candlestick chart?
A JAPANESE CANDLESTICK CHART is a type of chart developed in Japan used in finance trading which contains information or data relates to price movement at a particular period of time. This information or data are represented inform of candlesticks. A candlestick chart shows presents past and present data of price. It shows the behavior of buyers and sellers in relation to price and time.
Below is an example of a Japanese candlestick chart.
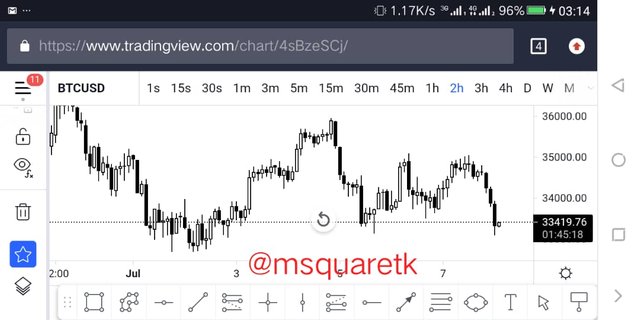
IMAGE SOURCE
The candle form are of two types. Bullish candle and bearish candle. The candles which form when price increases are called 'bullish candle.' While those that form when price decreases are called 'bearish candle.'
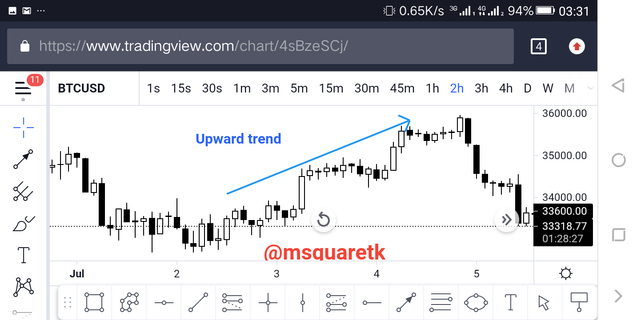
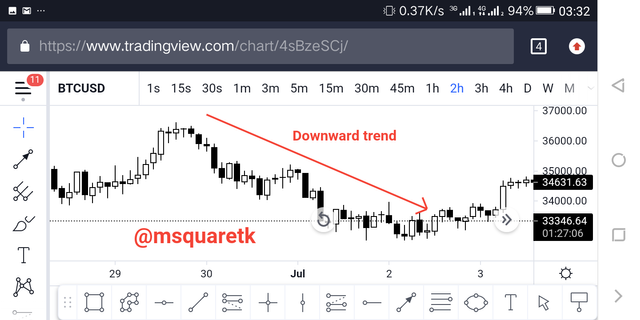
We shall talk more about this later. When candles are formed in the same direction, either upward or downward direction, it will form what is known as trend. To this effect, there's downward trend and upward trend.
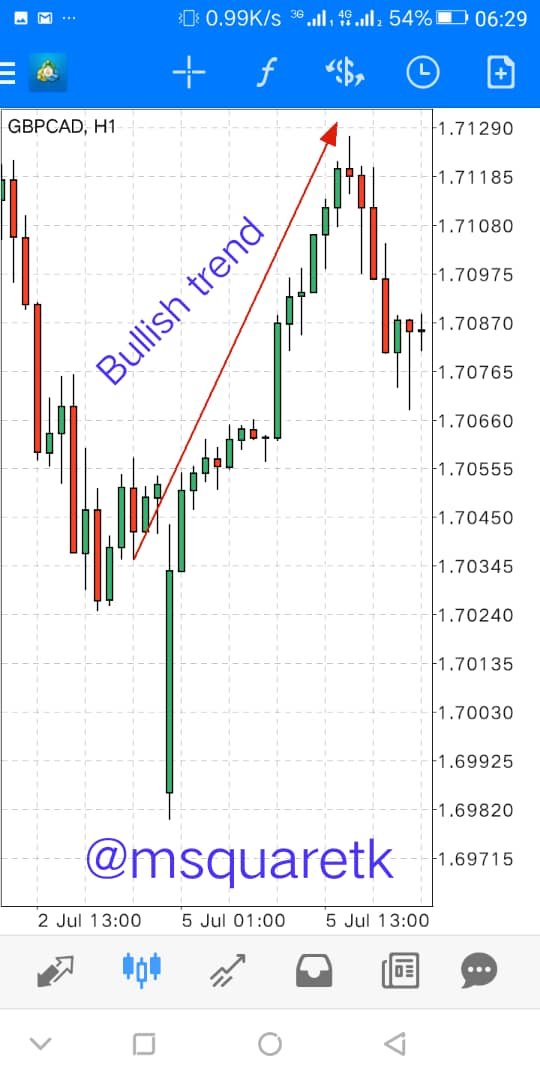
The screenshot below shows a candlestick chart with an Upward or Up trend.
And this screenshot shows a chart in a downward or down trend.

DESCRIBE ANY OTHER TWO TYPES OF CHARTS

I will like to describe these two charts because of their peculiarities.
LINE CHART
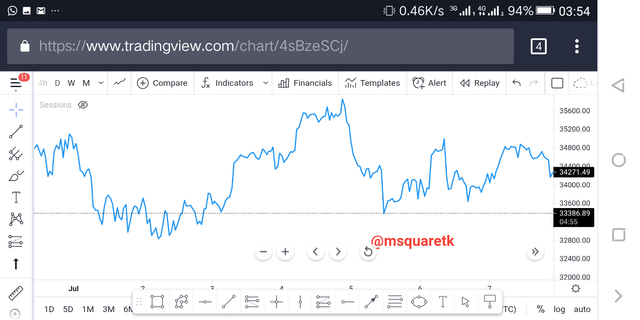
Line chart is a type of chart uses in crytographic trading which also shows the direction of price over a particular period of time. Line chart is the most basic type of chart. Unlike Japanese candlestick chart where each candle shows both the opening and closing price, line chart only shows the closing price. Line chart shows information related to price movement on a line. It's plotted by connecting the data points together.
Below is a screenshot showing an example of a line chart.
Line charts show how the value of price changes over time. One of the perculiarities of a line graph is that it can show small changes. It is a type of a chart in which trend is clearly and visibly seen.
BAR CHART
Bar chart is another type of chart in which price movement can be represented graphically. Bar charts allows traders to see patterns more easily.
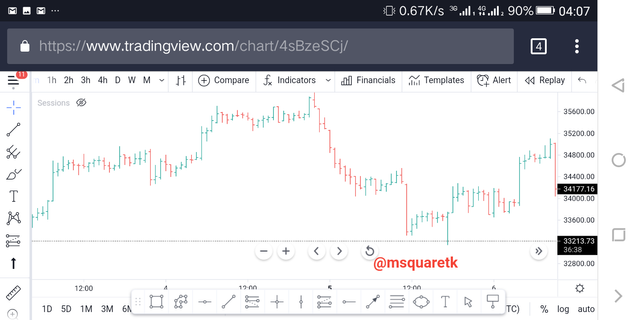
See the screenshot of a bar chart below
Like a Japanese candlestick chart, bar chart has opening, closing, high and low of price. That's bar chart also clearly shows these values which make traders to know the relationship between buyers and sellers for the particular time.
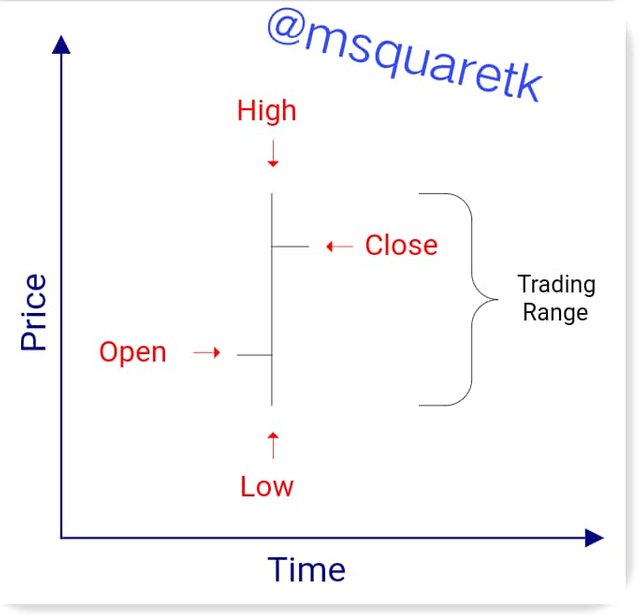
Bar charts provide a lot of information that the day trader can use when making trading decisions and are relatively easy to read and interpret.

IN YOUR OWN WORD, EXPLAIN WHY THE JAPANESE CANDLESTICK CHART IS MOSTLY USED BY TRADERS

The Japanese candlestick chart is mostly used by traders because of the following factors:
• It provides detailed information about the price.
Of what use a chart is if it doesn't give accurate information about the price of asset? Each candle formed, shows the opening, closing, high and low of price. Traders are interested in knowing the direction the price will move and as such, they need a chart which can give them, to some extent, detailed information about the relationship between the buyers and sellers for a particular period of time. Technical analyst use Japanese candlestick chart because of detailed information about the past and the present it gives so they can position themselves for the future.
• Japanese candlestick chart form patterns which traders use a lot.
One of the reasons why traders use Japanese candlestick chart is because of the chart pattern it forms over time. These patterns are of great importance to traders because some of them signify reversal of price, and others depict continuation. In essence, when this patterns forms, traders take advantage of them. That is they position themselves to ride the move either for reversal or continuation.
Also, these patterns help to know the trend. For example the movement of market in an ascending channel signifies an uptrend.
See the screenshot below to see how a rising or ascending channel looks like.
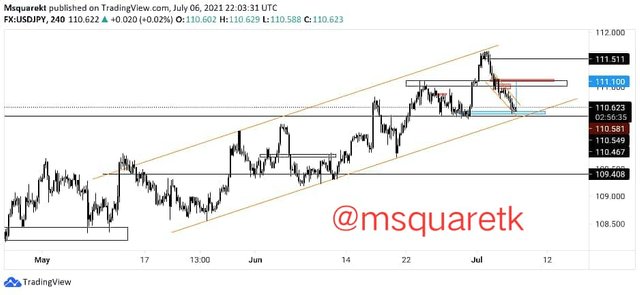
If a trader spots this kind of channel, he would know that the price is moving in an Upward direction. As such, he will look for where to join uptrend moves.
• The Japanese candlestick chart clearly shows the behavior of buyers and Sellers
Candlesticks formation is one the reasons why traders use the Japanese candlestick chart. There are some formation of candles which when formed on the chart, traders may be able to know the behavior of of the buyers and sellers. For example it is believed that when a doji candle (A doji candle is candle without body or which has a tiny body) is formed, it signifies an indecision between the buyers and the sellers.
• The Japanese candlestick chart is clean, clear and simple to read.
Unlike other charts which can not be easily read, Japanese candlestick chart is very simple to read. And it is always clean. Perhaps its clarity makes traders to admire it.

DESCRIBE A BULLISH CANDLE AND A BEARISH CANDLE IDENTIFYING ITS ANATOMY (Screenshot is required)

It is important to explain what the term "bullish" and "bearish" mean.
Bullish– Thi is a name given to a market which is in an uptrend. I.e when a the price of an asset moves from a low concentrated of price to a high concentrated of price, it is said to be bullish. The traders who trade the bullish markets are sometimes reffered to as bulls.
Bearish – Bearish is an opposite of bullish. A market is said to be bearish when price moves from high concentrated of price to low. In bearish markets, the traders who short or sell are called bears.
That being established, let's look at the bullish candle and bearish candle and their anatomy.
BULLISH CANDLE
A bullish candle is candle whose the closing price is higher in price than the opening price. I.e the price when the the candle closes has been risen than where the candle opens.
The screenshot below shows an example of a bullish candle.
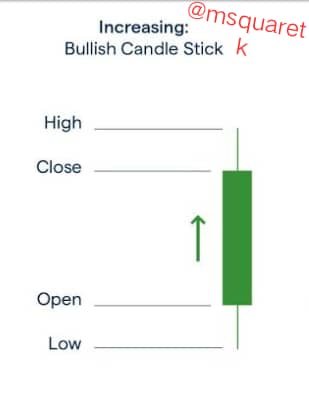
Bullish candle has six important parts. Namely:
- Opening
- Closing
- High
- Low
- Body
- Wick or Shadow
Opening
This is the opening price of the market. That's, it the point price at which the market opens.
Closing
Closing of a candle is a particular point of price where the market closes. I.e it is the point at which buyers stop their agreement or vacate the the market.
High
This is the maximum point where the buyers reach at a particular point in the market. The market could not close to the maximum high as result of the dragging of price between the sellers and buyers before it slightly close below the high of the candle.
Body
Body is the distance between the opening and closing. Just like the body of candle, it is big with volume.
Wick or Shadow
Shadow is the distance between the closing and high of the candle (For upper shadow). It is the distance between the opening and low of the candle (for lower shadow).
As it is started earlier, when a bullish candle forms repeatedly on a chart, it is called a bullish trend.
BEARISH CANDLE
Bearish candle is a candle that formed which the opening price value is higher than the closing price value. That is, the price decreases when the candle closes.
The screenshot below is an example of a bearish candle.
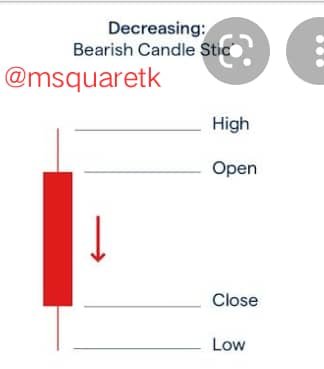
Just like a bullish candle, a bearish candle also has six important parts. (Opening, closing, high, low, body and shadow)
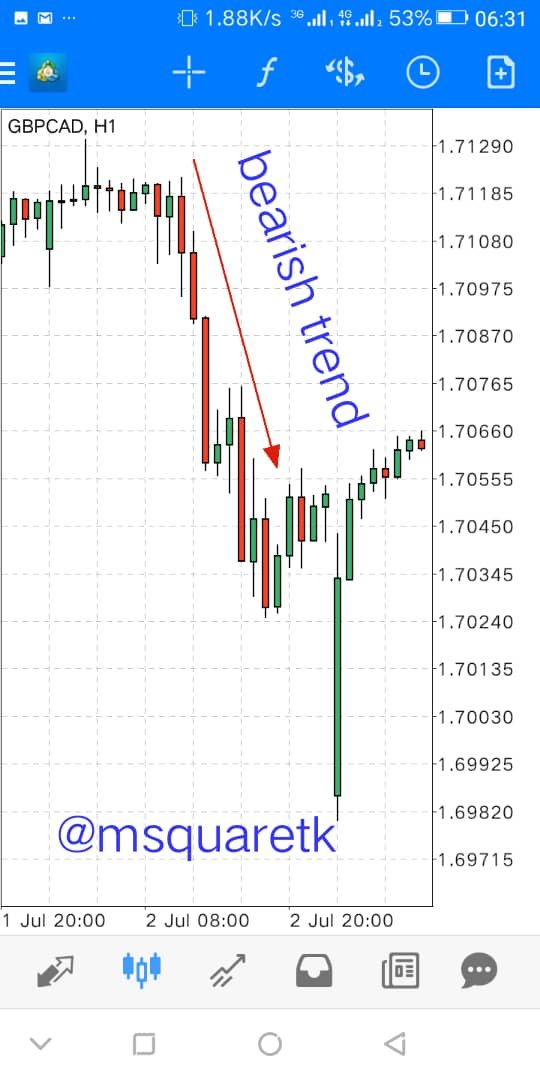
Also, when a bearish candle forms repeatedly on a chart, it is called bearish trend
The screenshot below shows an example of a bearish trend.

CONCLUSION

Charts are graphical representation of information or data. There are many types of charts used in finance trading which show the movement of price for a particular period of time. Some of these charts are Japanese candlestick chart, line chart, bar chart etc.
Japanese candlesticks chart are most widely used chart by traders because of its importance. It gives detailed information, shows the direction of trend, the behavior of buyers and sellers and it is easy to read and understand. Technical analysts have found this ancient Japanese candlestick chart useful and therefore it most common and popular among charts.
Thank you professor @reminiscence. The lecture was worth attending.

CC: @reminiscence01
Written by @msquaretk
Hello @msquaretk , I’m glad you participated in the 2nd week of the Beginner’s class at the Steemit Crypto Academy. Your grades in this task are as follows:
Recommendation / Feedback:
Thank you for submitting your homework task.
Thank you Professor @reminiscence01
.