Crypto Academy Season 3 Week 1 — Homework Post for Professor @lenonmc21 | What is Cryptocurrency Trading and on what platforms can we do it?
WHAT TRADING IS, ITS FUNCTION AND HOW IT RELATES TO CRYPTOCURRENCY MARKET
WHAT IS TRADING?
According to my basic knowledge of economics,
trading simply means buying and selling of goods or services. In order words, it is the exchange of goods or services between two people or group of people. Trading involves both the action of buyers and sellers.
FUNCTION OF TRADING
One of the major function of trading or trade is that it makes exchange of goods or service possible. For example a buyer who needs a pair of shoes can have it by giving the currency he has at hand in exchange for the shoes he needed.
It is also pertinent to know that interactions between buyers and sellers is made possible through trading.
When goods are needed by the buyers and the sellers are able to supply it, the demand of the buyers is meant. So trading helps seller to send in out his goods.
In the case of International trade, if goods are being delivered to other countries, it increases the economy of country.
HOW IT RELATES TO CRYPTOCURRENCY MARKET
Cryptocurrency trading also involves the interaction of buyers and sellers. But in this case, it is done through crpyto graphic. What we trade in cryptocurrency are assets. That is, buyers buy assets and sellers too sell assets.
Some assets that are traded in cryptocurrency trading are Btcoin, Dogecoin, Lumen, Stella etc.
Unlike, forex trading where the market opens for five days in a week, cryptocurrency market opens everyday and it doesn't close. Forex market has openings and closing time.
Cryptocurrency are very volatile and it can move greatly with a short period of time.
A Cryptocurrency trader may be a buyer some times and the other times a seller depending on the opportunity that presents itself at a particular time. So it can therefore be said that cryptographic has a lot of advantages.
DEFINITION AND EXPLANATION OF THE TOOLS USED FOR TRADING
As explained earlier, trading, cryptographic trading involves buying and selling of financial assets. And there are tools for trading this asset.
But we look into this tools, let's look at some of the examples of assets we can trade.
Currencies: currencies are one of the assets that can be traded. Examples of currencies such are US dollar (USD), Canadian dollar (CAD), Euro (EUR), Britain pound, (GBP) etc. Actually, when two currencies are combined together, they are called currency pair.
Commodities: examples of commodities are, silver, gold etc.
Indices: Indices such as volatility index, boom and crash etc.
Cryptocurrencies: Btcoin (BTC), Etherum (ETH) Stella (XLM) etc are examples of Cryptocurrency that can be traded.
Fortunes:
Actions: Actions such as Facebook, Twitter, Apple etc can also be traded.
Now, having shown some of the examples of assets that can be traded, let's look at the tools we can use to analyze the market. As I rightly said that, what is done in trading is buying and selling of financial assets. To be therefore profitable, there is need to know when to actually know when to enter the market, either to buy or sell and when to exit the market, when to take profit. The tools which help to know whether an asset will rise or fall is therefore of great importance which must be considered.
The tools which will use for trading are;
- Technical
- Fundamental
Technical Analysis
Technical Analysis is one the tools which many traders use to analysis financial markets. This involves the study of graphs. And what forms the graph of each market are Japanese candles. These candlesticks are different in formation, which traders consider as the behavior of of buyers. That is the candles that form, for example per hour may represents the behavior of buyer and seller for that period of time.
When this candle or candlesticks form over a period of time, it shows overall behavior of whales. Whales are the big investors of Cryptocurrency. Those who have accumulated a large amount of cryptocurrency. They are the ones who actually control market. That is, they determine the direction of market.
The combination of this candles over time is what is called chart.
It is the chart that the traders now look at to know how to position themselves.
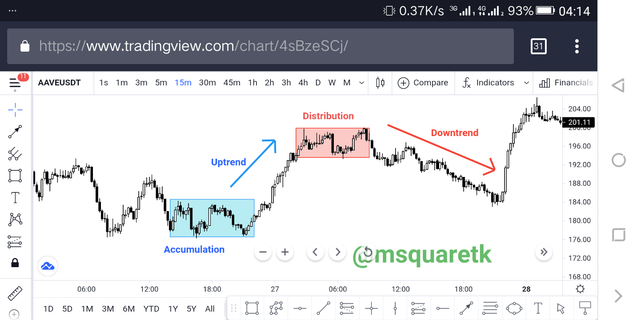
Examples of a chart is shown below.
It is pertinent to know that there are some tools called indicators which traders combine together to analyse market. Some of these tools are volume related tools, some are trend related and some are Strength related tools.
When a trader doesn't combine any indicator with his chart, such a trader is called "price action trader." The Price action traders look Only at the formation of candles in relation to price and time to trade.
The candle that form in a period of time shows if the market is bullish or bearish. Bullish means rising and bearish means falling.
In the chart above, some candles are white and some are black. The white candle are bullish candles, while the black ones are bearish candles. However, it should be noted that some traders set the color of bullish candles to green and bearish to red. The color however doesn't matter. It could be set to any color depending on the taste of individual. The common ones are green and red, and white and black.
Traders analyse market with technical analysis to predict the future of the market. They do this by using the past and present information. The chart shows what has happened in the past, i.e the behavioral attitude of the bulls and bears and what is happening presently.
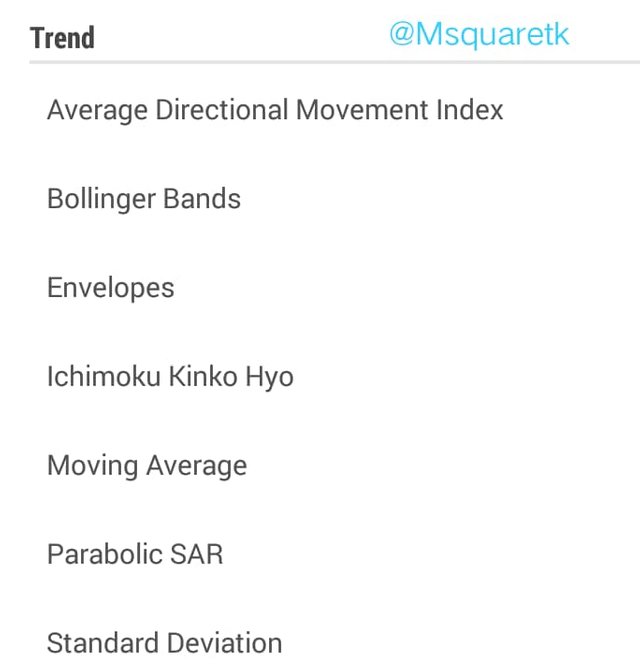
Some of the indicators used to predict markets are shown below.
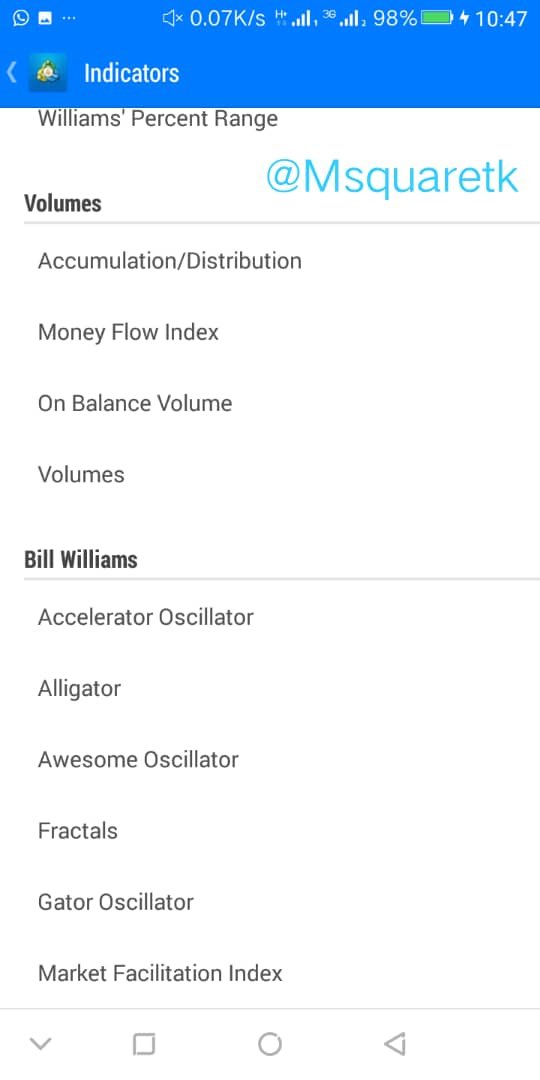
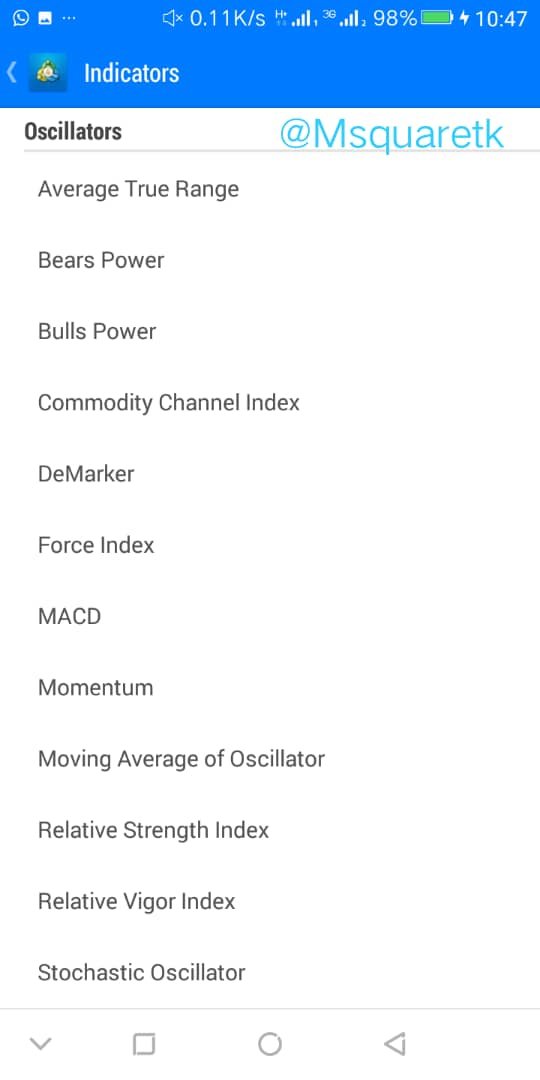
Let's look at one or two examples of this indicators on the chart.
Let's use RSI, relative Strength index as an example.
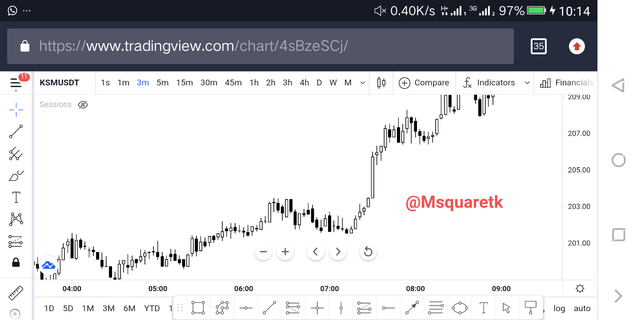
Relative Strength index is used to know the Strength of the market. As the price increases, RSI indicator will also be increasing.
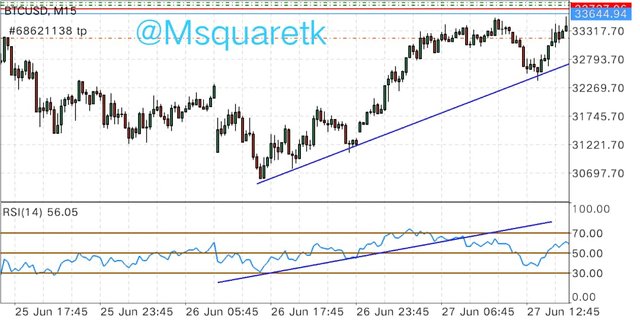
In the screenshot above, as the price is increasing, RSI is showing increase in strength, that signifies that the market is bullish. However, it will come to a point where price will be increasing and RSI will be decreasing. It is called divergent. That means, the market is loosing momentum and there may be reversal soon.
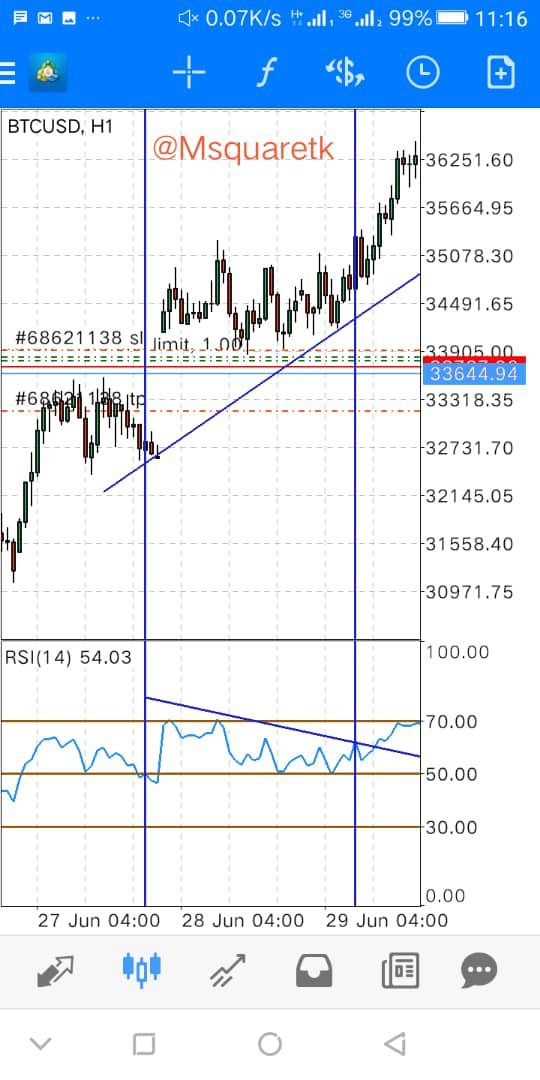
The screenshot below shows increase in price but decrease in the strength of RSI
Having talked on technical analysis to some extent, let's now talk about fundamental analysis.
Fundamental Analysis
Fundamental Analysis is a tool that's basically used by some traders to position themselves for the opportunities that may present itself. This is based on economic events at a particular period of time. Traders check at the past news and look at the probability of the news repeating itself and or changing.
The study of each of the assets based on the information given on them are actually used to trade in fundamental.
Because cryptocurrency is very volatile, it is expected that one knows and study well this tool so that one will know how volatile the asset he wants to trade is.
Each developer of a coin or Cryptocurrency actually give details of the coins and this details could be utilized by the traders to actually predict the future of the market. They use those details to do their analysis to know when the market will either rise or fall.
Let's look at example of details that could be given on a particular Cryptocurrency.
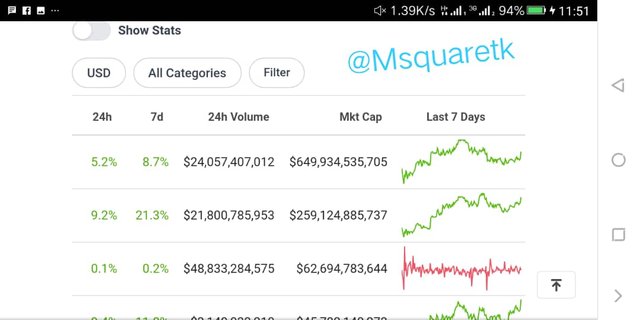
The information on the screenshot below is showing the list of Cryptocurrency. The price of each coin, the timeframe.
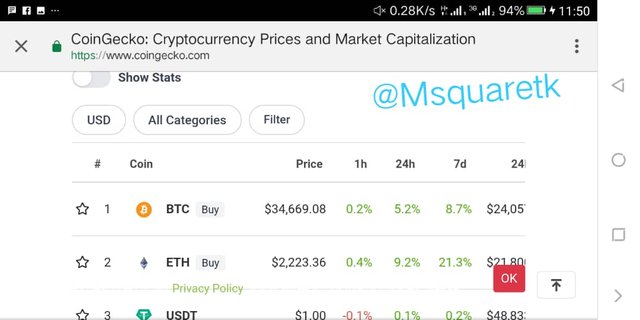
Also this showing the volume of the coin, the market cap and the chart. These information are useful to predict the future of the market.
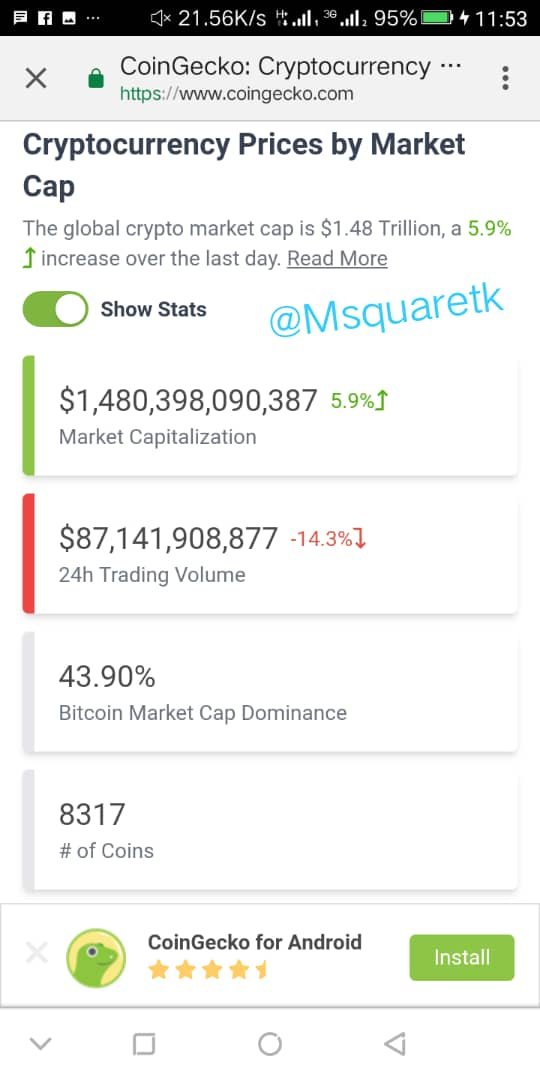
The statistics of the Cryptocurrency cap is displayed on the screenshot below. We can see that knowing the stat. will help to predict the direction of the market.
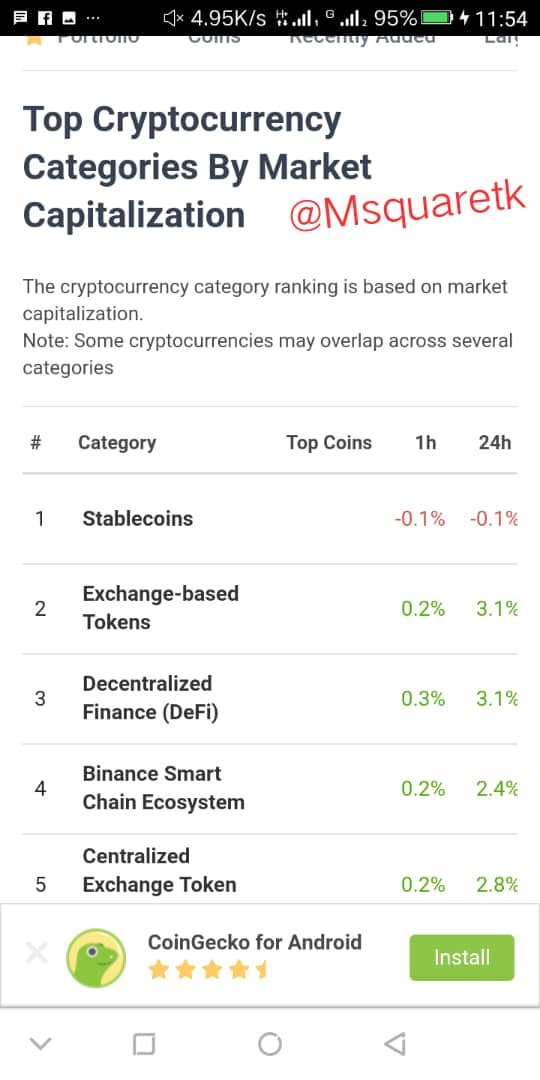
There are categories of the coins. Some are stable and some are not. If a trader doesn't cool with a coin which can change value anyhow, he should invest in stable coins.
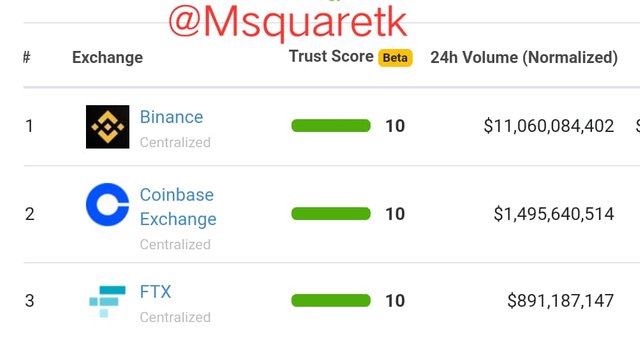
THREE CRYPTOCURRENCY EXCHANGES WITH HIGHEST TRADING VOLUMES WHERE WE CAN BUY CRYPTOS AND EXPLANATION ON HOW WE CAN BUY FROM ANY OF THEM (EXCEPT BINANCE)
There are platforms in which cyrptos are exchanged. To know this platforms, we normally use coindengo.
Below is the screenshot showing some of these platforms.
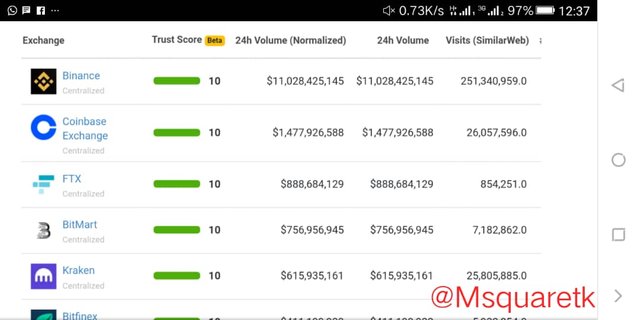
The three Cryptocurrency exchange with the highest volume are :
1.Binance
2.Coinbase Exchange
3.FXT
How To Buy From Any One of this Platform
There are two ways to buy Cryptocurrency from exchange platform.
- We can buy through Fiat currencies, and
- We can also buy through P2P exchange.
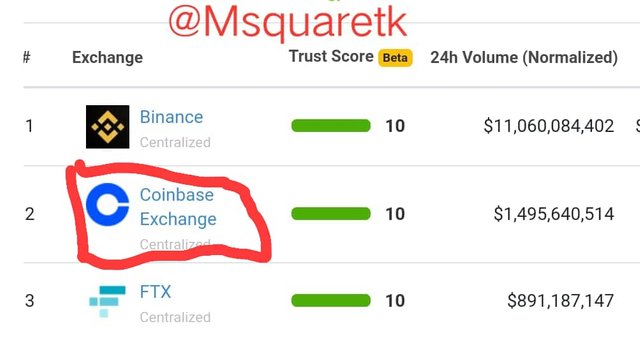
Since we are asked to explain how to buy cryptos from an exchange site except binance, I will choose the next exchange platform next to binance which is Coinbase Exchange.
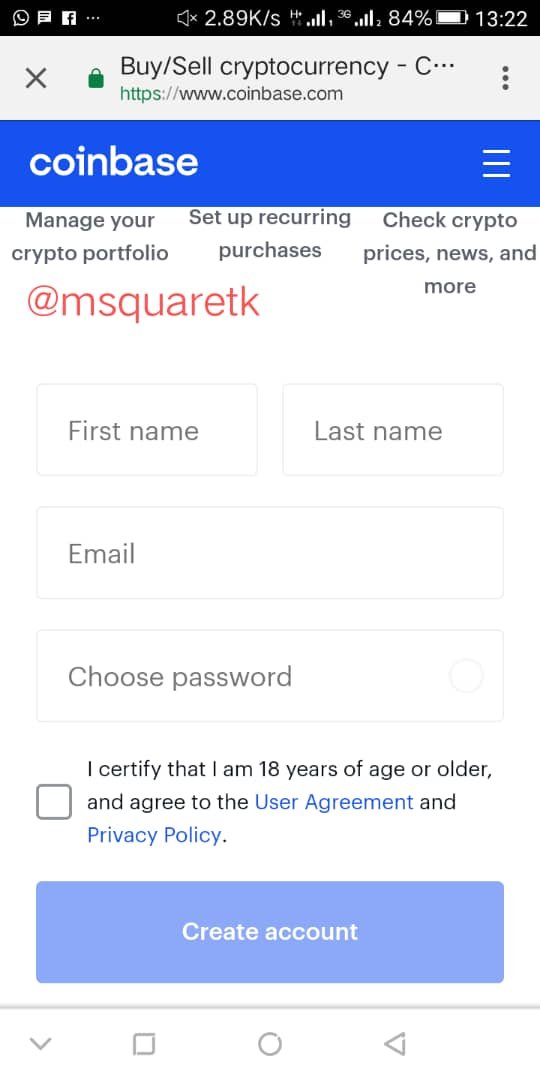
The first thing is to log in or if you are first time user of the app, you sign up on the app. Or
You can click the Coinbase directly from coindengco website
If you are first time user, input your details and sign up.
See the screenshot below
The next thing is to click on your portfolio.
You will see a drop down box with blue color icon, click on it.
Click on the blue icon . I.e the drop down box.
Then, it will display some features where we can actually buy, sell and perform some other important things depending on what we want to do.
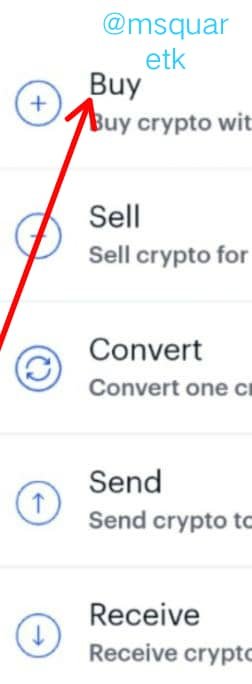
In this case, we are interested in buying. Then we click the buy icon. When we click on this we will use our debit cards to buy the coin directly.
However, details of what and what we needed can't be displayed futher because the federal government of Nigeria has banned using credit card to purchase coins directly.
But we actually do is that we buy coins or Cryptocurrency via P2P. But unlike binance exchange platform, there is no option for this on Coinbase Exchange platform.
CONCLUSION
Trading is an exchange of goods or services. Cryptographic trading is buying and selling of financial assets. The trading is done via exchange platform such as binance, Coinbase exchange, Ftx etc.
There are tools which can help traders focast or predict the movement of Cryptocurrency market. We have technical and fundamental analysis. Each of the tools must be known by the traders and studied well to know the direction of the market.
CC: @lenonmc21
Written by @msquaretk