Basic trading strategy using the Harmonic AB = CD + Fibonacci pattern – Crypto Academy / S4W2 - Homework post for @lenonmc21

Cover Page Created by me, @msquaretk with Canva App
I welcome everyone to my post.
It's second week of season 4 in the Crypto Academy. It is my pleasure to submit this homework to Professor @lenonmc21. This post is in response to the assignment that Prof. gave after his lecture on "Basic trading strategy using the Harmonic AB = CD + Fibonacci pattern."
So, in the next paragraphs, I will be responding to the questions, three of them are theory while one is practice. Follow me closely as I show my understanding of the topic.

THEORY
1. Define in your own words what Harmonic Trading is?
Harmonic trading is a type of trading technique that is based on price patterns which are formed on the chart in combination with the fibonacci retracement. These patterns that form on the chart repeat themselves and based on this, traders capitalize on them and make trading decision.
Now, to get this better, let me say this.
In life, people believe that incidence repeats itself. For example, eclipse of the sun and that of the moon are one of the incidences of life that repeat themselves. An eclipse of the sun that occurs will likely going to occur again and again. Even, human beings repeat what they do. For example, every morning, mostly between hour of 7 and 8am in the morning, I brush my teeth. This has become constant and keep repeating itself with almost the same or equal length of the time. The same is true for price in cryptographic trading. It is believe that price of an asset forms pattern which must constantly repeat itself.
We know that price moves in either upward or downward direction. So, when price moves in a certain direction, say upward direction, there will be a pause that will normally pull the price back. This is necessary in order to keep the balancing in the market. So the first movement of the price to the upward direction is normally called impulsive move and the pull back, which is not expected to go beyond the start of the first move , impulsive move if the trend is uptrend is called retracement move. Now, it is now believed that the next impulsive move that would be formed must be almost or the same with that of the first impulsive move and conversely the next retracement move must be almost or the same with the first retracement move. When this happens, the price patterns has undergone repetition process. It's on this basis that harmonic trading is established.
Simply put, harmonic trading is a trading technique which is based on the principle that price pattern repeats. This means that every impulsive move in an uptrend should be equal or similar to in size or percentage and the retracements in this trend should also be equal or almost equal in size or percentage.
To better understand this, let see some examples of what I have been explaining on the chart.
In the chart below, you will see that I have made an editing on the chart using a path way tool drawing to show you how the movement of price is on the bullish and bearish run. You will see that the length of the first impulsive move is similar to that of the second impulsive move. And the retracements wave are also similar to each other.
It's however pertinent to know that, sometimes these length or percentage may not totally be equal, but to some extent, they should almost be similar which is the beauty of the repetition I'm talking about.
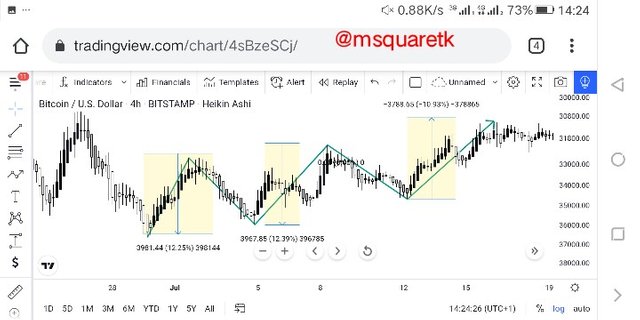
Fig. 1: Illustration of Repetition of Movement in an Uptrend | tradingview.com
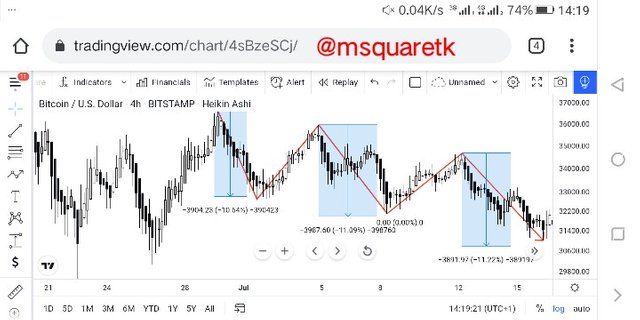
Fig. 2: Illustration of Repetition of Movement in a Downtrend | tradingview.com
2. Define and Explain what the pattern AB = CD is and how can we identify it
Having defined what harmonic trading is and given some examples to clearly understand how the repetition of the movement of price often occur on the chart, let's now go see one of these harmonic patterns.
Harmonic pattern AB = CD which is also referred to as ABCD patternis one of the patterns of harmonic. This pattern is reffered to the simplest pattern of the harmonic because of the less rule attached to its formation.
ABCD pattern is formed based on four (4) movement of price, in which two are impulse and the remaining two are retracement. The start of the first impulse is the beginning of the formation which is known as A and the end of this impulsive move or the beginning of the retracement is termed B.
The end of the retracement which is a counter trend to A or the beginning of the new impulsive move is known as B, and the end of this new impulsive move is labeled D.
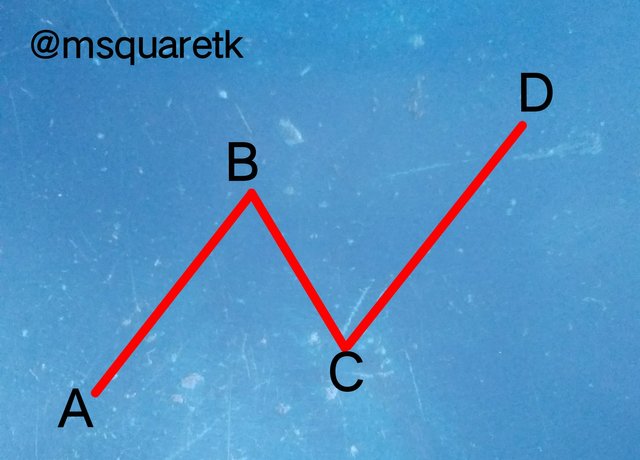
Fig. 3: ABCD Pattern Illustration | Image Snapped with Gionee S11 and edited with iMarkup by me, @msquaretk
For the ABCD pattern to be valid, C must not retrace beyond A and D must go higher than B. Later, we will look at exact percentage which these legs must have in order to know if is harmonic pattern ABCD or not. More on this later.
Harmonic pattern ABCD is a reversal pattern. When this pattern forms in an uptrend, it is known as bullish reversal pattern and when it forms in a downtrend, it is called bearish reversal pattern. This means that traders look for sell opportunities when they see the pattern form in an uptrend, because they know that the pattern signifies exhaustion of buying pressure. On the other hand, traders look for buying opportunity when the pattern forms in a downtrend because it often signifies exhaustion of the selling pressure.
Identification of AB = CD Pattern
You remember I mentioned above that ABCD pattern are reversal pattern. It can be a bearish reversal pattern when it is formed in downtrend and can be bullish reversal pattern when it's formed in an uptrend. Here, we will look at both scenario and try to illustrate how to identify them.
For AB = CD Bullish
To recognize or identify the bullish movement that will be formed, the price of an asset must be declining, that is, the market must be in a downtrend with series of lower lows and lower highs. This means that the points A, B, C and D must fall in a downward trend. After you are clearly sure the asset is in a downtrend, then wait for the four points to form.
In the screenshot below, you will see that the four points labelled with A, B, C and D are in a downtrend.
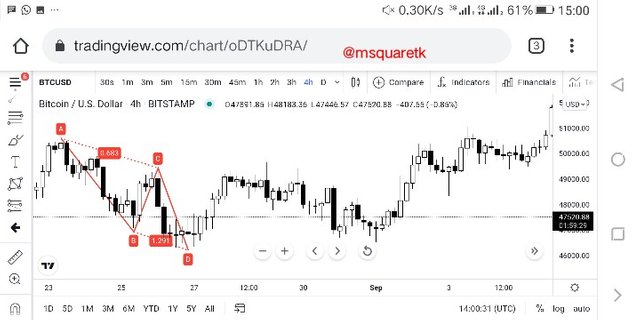
Fig. 4: ABCD points formed in a downtrend | tradingview.com
After you have seen the four points, ABCD formed on the chart, the next thing is to validate them. This is important because rules are rules and they are meant to be followed. To validate them, we will use fibonacci retracement tool.
- To validate them, firstly, the first impulsive movement represented by A and B, there should be no secondary movement which go beyond them.
- Point C must not go beyond point A. That's it must be lower than point A. It should also be between 61.8% and 78.6 % of the fibonacci retracement of the leg AB
- Point D must be below point B and should be between 127.2% and 161.8% Fibonacci retracement of the leg BC.
Let's see the screenshot below to understand the points mentioned.
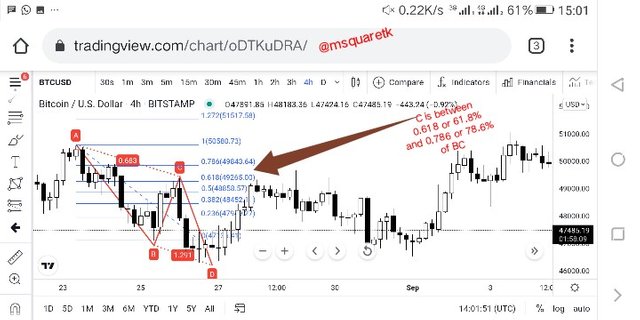
Fig. 5: Fibonacci retracement of leg AB | tradingview.com
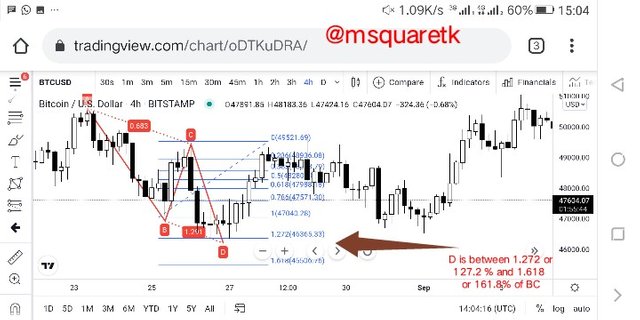
Fig. 6: Fibonacci retracement of leg BC | tradingview.com
For AB = CD Bearish
To capitalize on the bearish move that would happen, the price of an asset must be in the upward direction. That's market must be in an uptrend with series of higher highs and higher lows. Then after identifying the trend to be a uptrend, the next thing is to wait for for the four points, ABCD to form.
In the screenshot below, you can see that the the market was in an uptrend and the four points are formed.
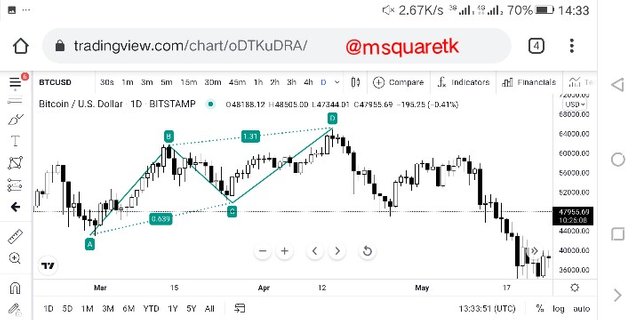
Fig. 7: ABCD points formed in an Uptrend | tradingview.com
Now, the next thing, after identifying the trend which an asset is and confirm that the points ABCD have formed, is to confirm whether the pattern is valid or not. To do this, we use fibonacci retracement tool.
- Firstly, in the movement of the leg AB, there should be no be secondary movement that go beyond point A.
- Point C must be higher in price level than point A and should be around 61.8% and 78.6 % of the fibonacci of the leg AB
- Point D must go beyond point B and should be between 127.2% and 161.8% fibonacci retracement of leg BC
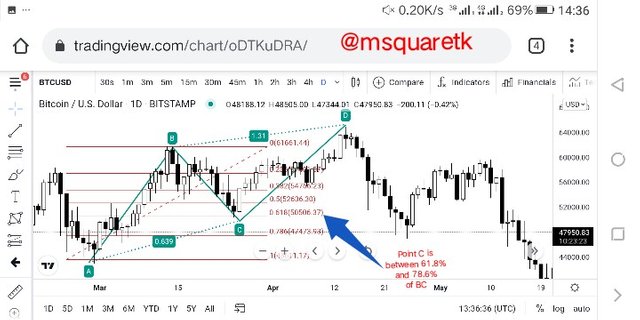
Fig. 8: Fibonacci retracement of leg AB in an Uptrend | tradingview.com
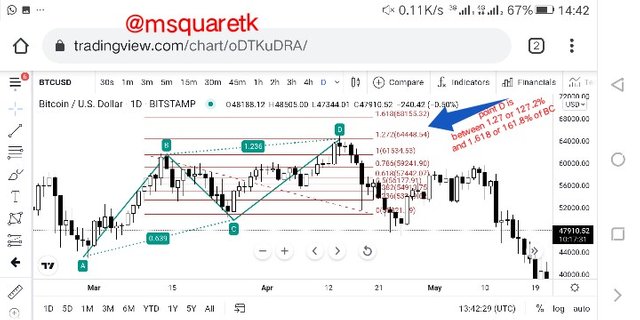
Fig. 9: Fibonacci retracement of leg BC in an Uptrend | tradingview.com
3. Clearly describe the entry and exit criteria for both buying and selling using the AB = CD pattern?
Entry Criteria for buying and selling
- The first thing to look for when you want to buy or sell with harmonic ABCD pattern is to look for the four (4) points on the charts.
- Now, next is to confirm if the pattern is valid. To to this, use fibonacci retracement to measure the retracement of AB that form point C. Make sure that this retracement is between 61.8% and 78.6%. Also, check if the retracement of D is between 127.2% and 161.8 of the leg BC.
- If the all the rules don't follow, discard the setup and look for another four points, ABCD. If the rules are intact, then we can proceed with the set up.
- As soon as the point D finished its phase, then you can enter the market. To sell, enter when you see a bearish candle forming, this is after D has completed its phase. To buy, enter when you see a bullish candle form after D has completed its phase.
Exit Criteria for Buying and Selling
- For this pattern, the best exit criteria which is recommended is to put your stop loss 2% below the point D for a buy order, and 2% above D point for a sell order.
- Then, take profit should be but in place which gives risk reward ratio of 1:1. This means that stop loss should be equal in ratio to take profit. That's take profit should also be placed 2% above the entry level for a buy order and 2% below the entry for a sell order.
- If the trade goes against you and hit your stop loss, that means the trade is invalidated and you will be taken out of the market, and if it goes in your direction, it will hit your take profit, you make gain and exit the market.
Below are the the screenshots showing graphical illustration of exit and entry criteria for sell and buy order.
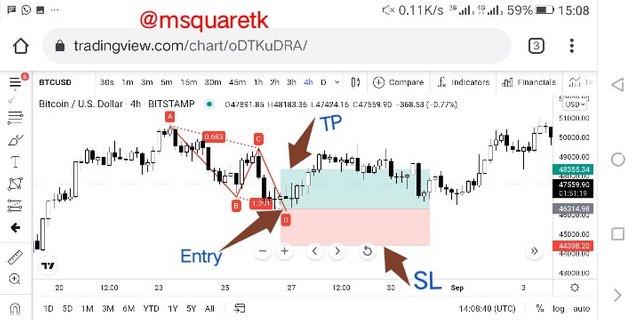
Fig. 10: Graphical Representation of Entry and exit criteria for buy order | tradingview.com
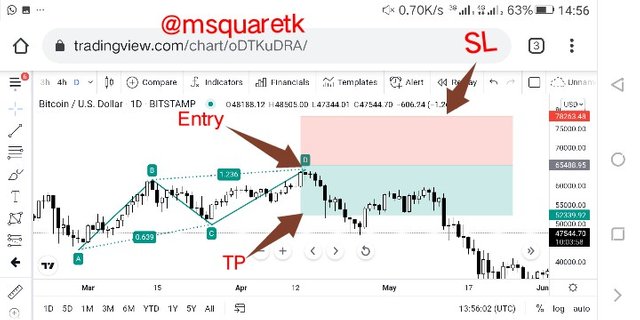
Fig. 11: Graphical Representation of Entry and exit criteria for Sell order | tradingview.com
PRACTICE
1. Make 2 entries (Up and Down) on any cryptocurrency pair using the AB = CD pattern confirming it with Fibonacci.
In this part of the question, I am going to make two entries with simulation. One is buy order and the other is sell order. Now, let's get in right there.
Buy Order
We know that to use harmonic pattern ABCD to buy an asset, that asset must be in a downtrend. Which means we want to catch the reversal. So, i spotted a cryptocurrency pair of LTCUSD in a downtrend with series of lower lows and lower highs. This is the firs thing that must be considered. Then, four points which are labeled ABCD must form to see harmonic pattern. In the screenshot below, I have clearly identified the four points.
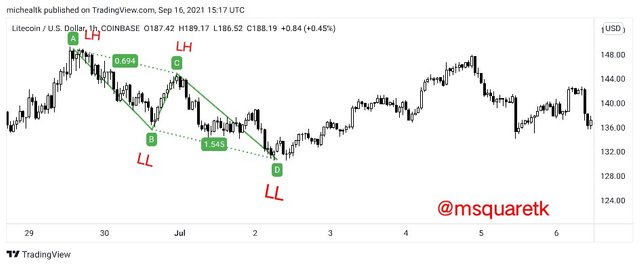
Fig. 12: LTCUSD in a downtrend with ABCD points formed | tradingview.com
Then since the points have been formed. The next thing to check I to confirm if the pattern is valid with fibonacci retracement. Firstly, I confirmed if the percentages of retracement of C is between 61.8% and 78.6 of the leg AB, and this between them. Check the screenshot below.
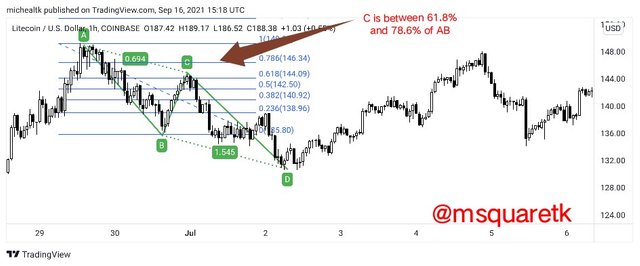
Fig. 13: C is between 61.8% and 78.6 of the leg AB | tradingview.com
Also, the next to check the retracement of D. So I checked if D retracement is between 127.2% and 161.8% of BC and it is very correct, it's between the level.
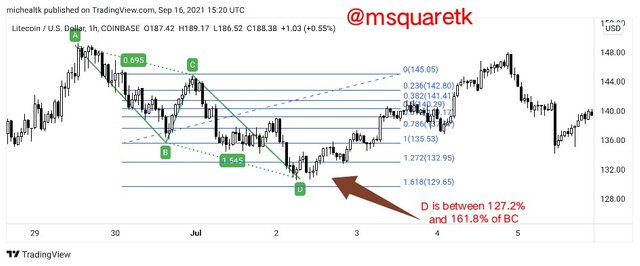
Fig. 13: D is between 127.2% and 161.8% of BC | tradingview.com
So, everything is intact now. The setup has been confirmed. The next thing is that I put a buy order at the end of D, that is when a bullish candle formed to the upside. My stop loss was set at 2% below the D and the take profit was placed 2% above the entry point to have a risk reward ratio of 1:1.
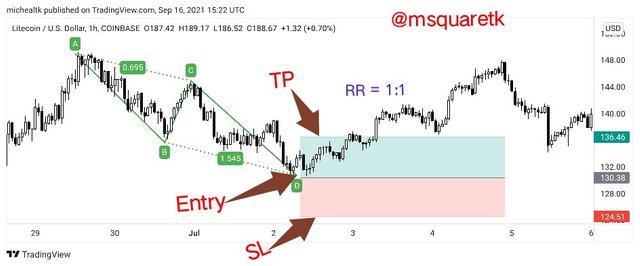
Fig. 14: Entry, stop loss and take profit for a buy order on LTCUSD | tradingview.com
As it is seen in figure 14 above, the trade went in the direction I predicted, the take profit was hit.
Sell Order
For sell simulation, I'm going to use ETHUSD chart. Since I know that to sell an asset with harmonic pattern ABCD, market must be in an uptrend, and so I was at a look out for market in an uptrend. I spotted a chart of ETHUSD in an uptrend with series of higher highs and higher lows. Then I looked for the four points ABCD if they are forming. The screenshot below shows the that the ETHUSD pair was in an up trend and that the four points have formed.
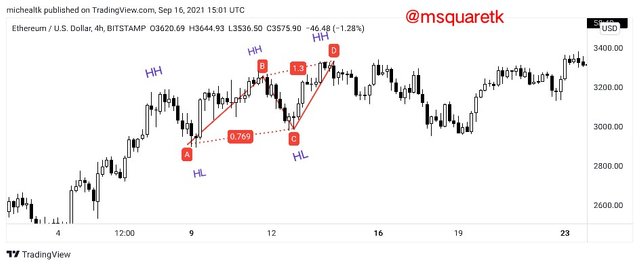
Fig. 15: ETHUSD in an uptrend with ABCD points formed | tradingview.com
Then, since the four points ABCD have been formed, the next thing is to check if this pattern is valid. Then I used fibonacci retracement tool to check if C is between 61.8% and 78.6% of the leg AB. And it was between the levels.
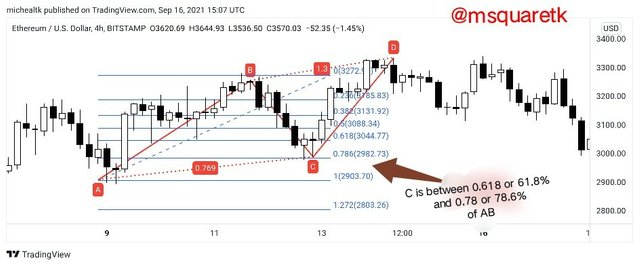
Fig. 16: C is between 61.8% and 78.6 of the leg AB on ETHUSD chart| tradingview.com
Next, I checked D if it's between 127.2% and 161.8% of BC. And it was between these levels. See the screenshot below.
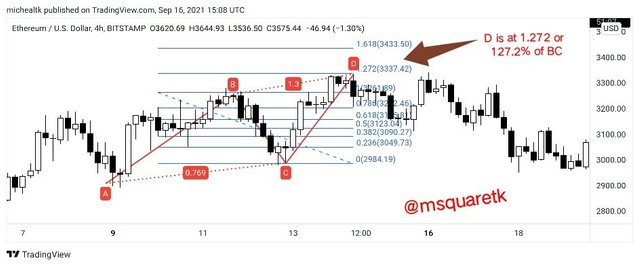
Fig. 17: D is between 127.2% and 161.8% of BC on ETHUSD chart | tradingview.com
Immediately i confirmed the validity of the pattern, I entered a sell order after the finish of the point D, when bearish candle formed to the downside. Stop loss was placed 2% above D, the entry point and take profit was placed 2% below the entry point to have a risk reward ratio of 1:1
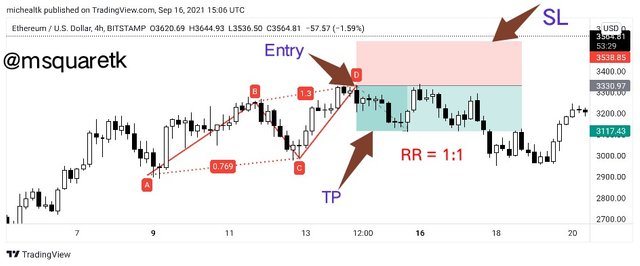
Fig. 18: Entry, stop loss and take profit for a buy order on ETHUSD | tradingview.com
As we can see from the figure above, the trade went in the predicted direction and take profit was hit.
Conclusion
Harmonic trading involved the use of harmonic patterns form on the chart in combination of fibonacci retracement to take trades. Harmonic pattern is one of the patterns used in finance or cryptographic trading. One of the most simplest harmonic patterns is ABCD pattern. The pattern is simple because there no too much rules attached to it and it's easy to spot it on the chart. This ABCD pattern can be traded with any timeframe in as much as the rules of the pattern are complete.
Thanks to Professor @lenonmc21 for the teaching. I habe been able to use harmonic pattern to simulate a buy and sell order enteries. The pattern is quite easy to support I combination with the fibonacci retracement.
CC: @lenonmc21
Written by @msquaretk