[Perfect Entry Strategy using Stochastic Oscillator + 200 Simple Moving Average] || Crypto Academy S5W3 || Homework Post For Professor @lenonmc21 || BY @msalmanjaved
Hello Everyone!
Greetings to All
I Hope everyone is doing well!
Today i am going to complete the Home Work Task of Season 5 Week 3, and task is Related to "Perfect Entry Strategy using Stochastic Oscillator " given by the Professor @lenonmc21.
I would like to thanks Prof @lenonmc21 for this Course which helped me to develop the understanding of Perfect Trading Strategy which will help me in future prediction while trading

Question# 1

State in your own words what you understand about the Perfect Entry Strategy (Place at least 2 examples on crypto assets)?
According to what I understood from professor lecture there are three main points in the perfect trade entry strategy
- Identification of the trend
- Seeing a harmony between market structure by using the 200 moving average
- Stochastic indicator for the overbought and oversold market sentiment

1. Identification of the Trend
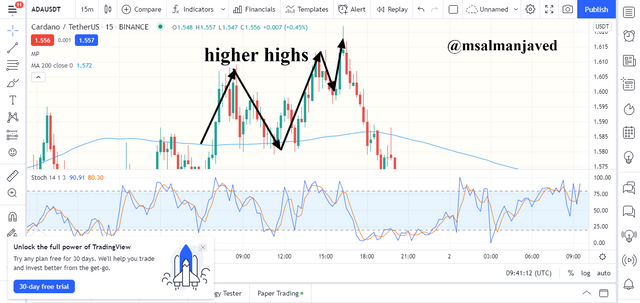
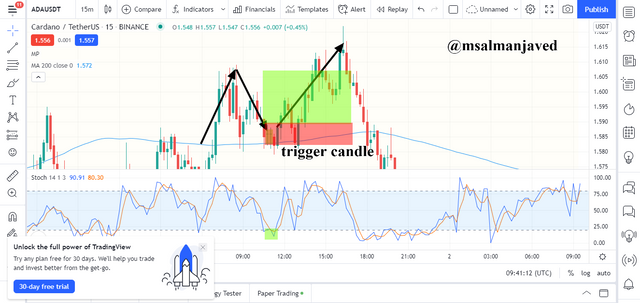
The first part in any strategy is to determine the trend and for this we should not confined to the 200 moving average but also apply our knowledge of the price action. The price action shows different patterns including the different market structure supportive to the current trend. By this we can see is the price action is in harmony with the 200-line.
In the chart below we can see that the price is making higher highs and is trading above the 200-line.
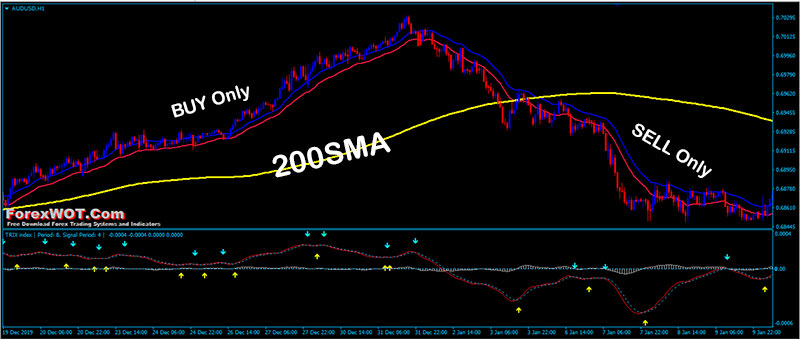
2. Relationship Between the Candlesticks and the 200-Line
The relationship between the 200-line and the price action is so that when the price is trading above the 200-line it indicates an uptrend and when the price is trading below it, it indicates a downtrend. In addition to that the candle sticks when come closer to the 200-lien they may revert back or cross this depends on the strength of the underlying trend.
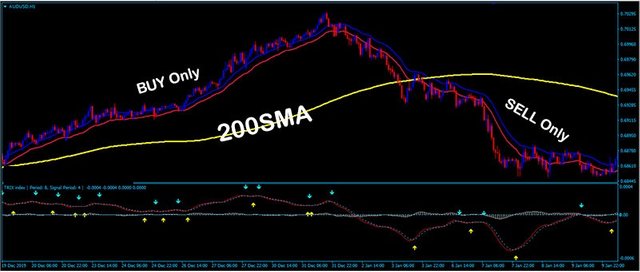
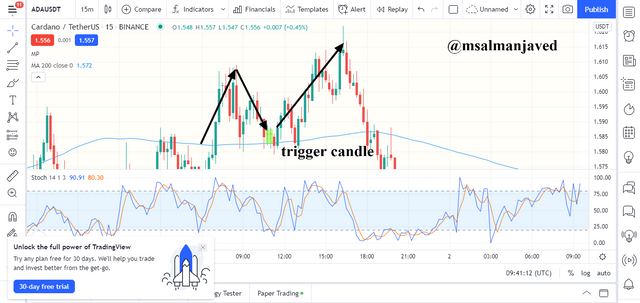
If the current trend is weakening a trigger candle will be formed when the price action comes closer to the 200-line. This trigger candle has a short body and thus indicate that the previous trend is losing strength.
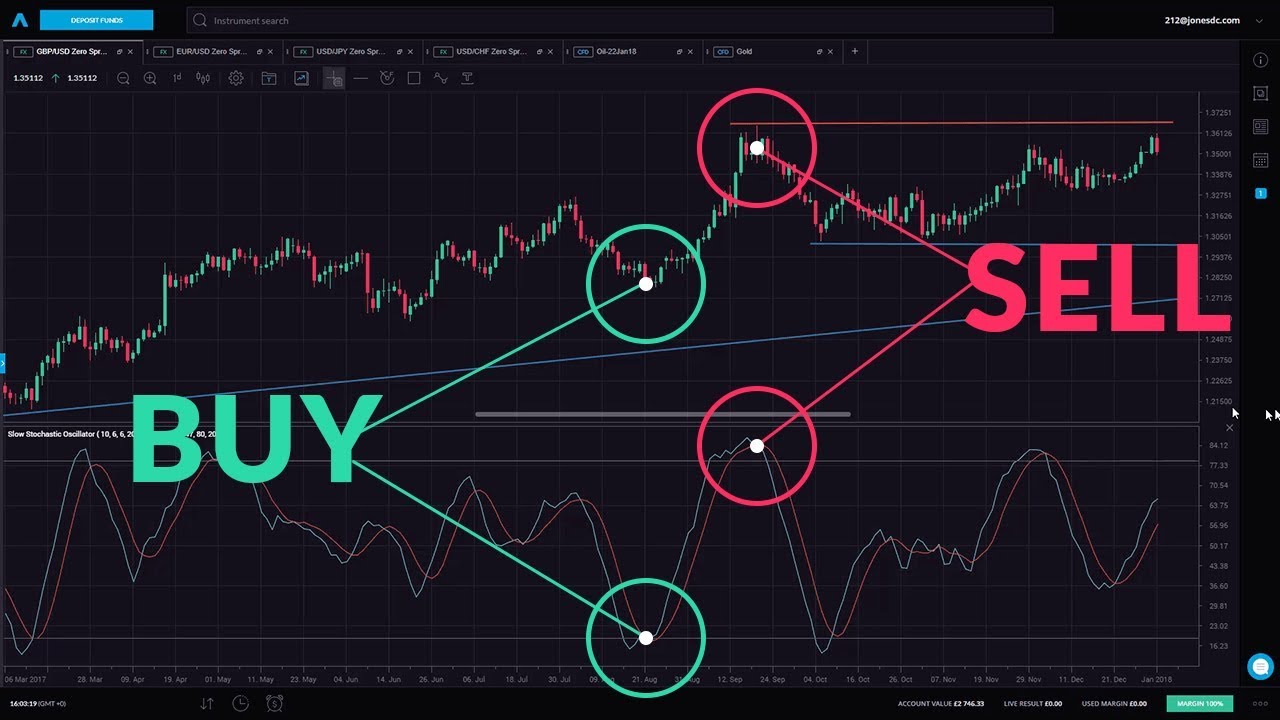
3. Stochastic Oscillator
It helps in identifying overbought and oversold regions. The price reverses back to the top after the Oscillator turns back from the 0 to 20 regions. The price moves down when the oscillator turns back from to 80 to 100 range.
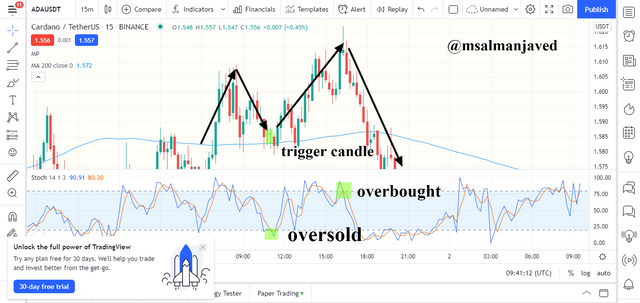
When all the above conditions are satisfied and the stochastic is returning back from the 80 to 100 level place a sell order and if it is recovering from the 0 to 20 place a buy order. As it is the perfect condition.
Slow Stochastic for New Traders
.jpg)
Question# 2
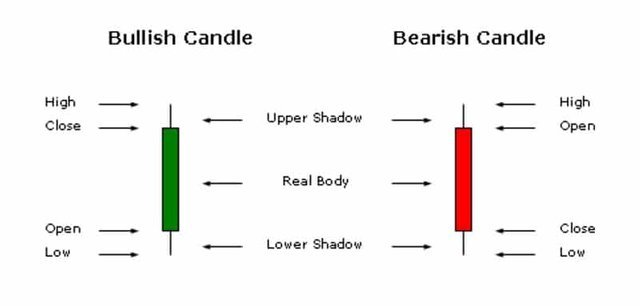
Explain in your own words what candlestick pattern we should expect to execute a market entry using the Perfect Entry Strategy?
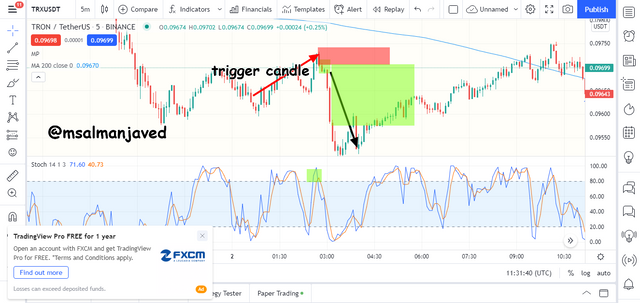
The trigger candle is very important candlestick pattern that help us in finding the right time to execute our order. A trigger candle is a small bodied candle that is a clear indication that the previous trend is losing strength hence a reversal is expected.
If you want to place buy order you should look for a small bodied bearish candle with or without absorption wick and if you want to place a sell order look for a small bodied bullish candle.
This is what professor has talked about in his lecture. The importance of the trigger candle as the name suggests is that acts like a trigger for the trend reversal. Through its formation the traders can easily presume that the previous trend will be exhausting soon.
Question# 3
Explain the trading entry and exit criteria for buy and sell positions in any cryptocurrency of your choice (Share your own screenshots)?
Trade entry and exit for a buy position
- All three above criteria must be fulfilled
- The market structure should initially be bearish consisting of lower highs and higher lows
- Then a trigger candle can be seen forming
- The stochastic oscillator should show an oversold condition
- The buy signal should be placed when the stochastic moves back from the oversold condition
- The stop loss should be placed closer to the trigger candle and the take profit near the 80 level on the stochastic oscillator.
Trade entry and exit for sell position
- All three above criteria must be fulfilled
- The market structure should initially be bullish consisting of higher highs and higher lows
- Then a trigger candle can be seen forming
- The stochastic oscillator should show an overbought condition
- The sell signal should be placed when the stochastic moves back from the overbought condition
- The stop loss should be placed closer to the trigger candle and the take profit near the 20 level on the stochastic oscillator.
Practice
Trade 2 demo account trades using the “Perfect Entry” strategy for both a “Bullish” and “Bearish” scenario. Please use a shorter period of time to execute your entries. Important you must run your entries in a demo account to be properly evaluated?
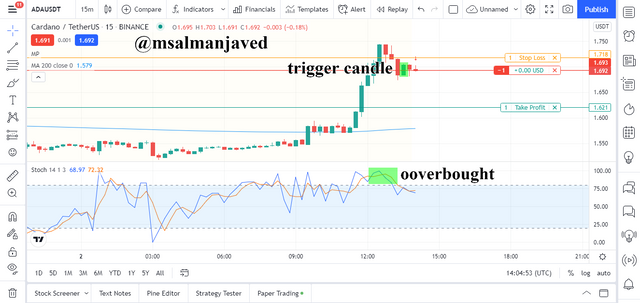
Although the price is trading higher to the support a trigger candle and the overbought signal was spotted.
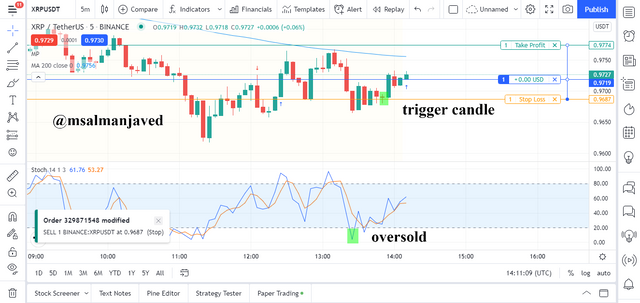
Similarly, the we can see here the oversold region and the trigger candle for the buy order.
Conclusion
This assignment gave us an understanding about how important is to consider different factors including the price action, moving averages and the harmony between the two and an indicator to find the best entry signal. In this way we can place right signals that have les chances to go into the loss.
I hope I would get some good remarks from professor on my effort.
Note : All screenshots are taken from www.tradingview.com and all the Images that i have used have been citied and source have given with every image.
Cc :
Professor:
@lenonmc21

#Club5050 Eligible
