Crypto Academy Season 4 Beginner's Course-Task 10: Candle Stick Patterns
Hello, dear friends, I am @mrsokal. I am going to write my 1st post in Steemit Crypto Academy. I have already completed all the criteria that are needed. I have already completed my achievement 1-4 and now my reputation is 50+ and I have powered up my steem . At present, I have 150sp in my wallet. So today I am going to write about Japanese candlestick chart
.png)
Image designed in Canva | by @ mrsokal

QUESTION
a) Explain the Japanese candlestick chart? (Original screenshot required).
b) In your own words, explain why the Japanese Candlestick chart is the most used in the financial market.
c) Describe a bullish and a bearish candle. Also, explain its anatomy. (Original screenshot required)
Question (a) : Explain the Japanese candlestick chart? (Original screenshot required)
Japanese Candlestick Chart
This chart was invented in the year 1700. Homma developed candlesticks so that traders can easily understand the patterns of the price and make a decision based on the direction of the price. In the year 1870, when the Japanese stock market started, the local technical analysts included Homma's methodology in the trading process. Then day by day this candlestick chart spread in the west and it became so popular. Nowadays this candlestick chart becomes the most used chart for traders.
Now I am sharing a screenshot of the Japanese candlestick chart so that you can see how it exactly looks.

That's how candlestick pattern look like Source
From this candlestick chart, a learned user can easily understand the sentiment of other buyers and sellers. On the other hand, from the other chart like a bar chart or line chart users can not predict what is the sentiment of other buyers and sellers. This is why the candlestick chart or the Japanese candlestick chart is worldwide famous among traders.
Question (b) : In your own words, explain why the Japanese Candlestick chart is the most used in the financial market.
1. Superior to Traditional Charts: Without candlestick charts, other traditional charts have very little explanation by themselves. They can not show the action of the market in much greater detail. On the other hand, candlestick charts have a detailed meaning. It can show the action of the market in much greater detail immediately. It allows using pattern analysis to decide the probability equity's future movement. Candlestick chart pattern analysis can play a vital role in just about any investment methodology after a little practice and familiarization.
2. A Proven Technique for 250 Years: Candlestick chart is helping traders to understand the price action in the market for 250 years. Homma Munehisa developed its concept in the year 1700. In the city of Sakata Homma started trading in the rice market in the year 1750. From that time candlestick chart become more and more famous among the traders. Nowadays it becomes a proven technique in any kind of trading. In this long time, no more charts can be more useful than candlestick charts.
3. Easy to understand: Users get a clear and easy to identify set of patterns that are mostly accurate for predicting market trends from a candlestick chart. You can easily start to see emerge in the market with a basic technical analysis of the candlestick chart. You can take advantage of these patterns in the time of trading. You don't need months or years to be a master on candlestick charts. You can memorize the patterns by practicing a couple of times only.
4. A Phycological Portrait: Sometimes prices are influenced by fear, greed, and hope. We need some form of technical analysis to understand these changing psychological factors. We can get information about this investor sentiment from the candlestick chart. We can see the interaction between buyer and seller by this candlestick chart. It also reflects in the price movement. Candlestick's chart clarifies the financial markets that are not possible for the other traditional charts.
Question (c) : Describe a bullish and a bearish candle. Also, explain its anatomy.
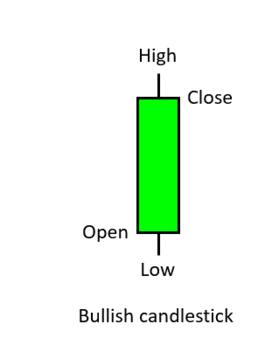
Bullish Candlesticks
Bearish Candlestick
Anatomy of a Bullish candlestick:
We can see 4 main parts in a bullish candle. They are :
- Open
- Close
- High
- Low
1. Open: From where the price movement starts is called the opening part of a bullish candle. The movement of price starts from here. It is also called an opening price of an asset. At this point, the price goes up for the day.
2. Close: The end of a bullish candle is called the closing part of a bullish candle. It declares the last part of a bullish candle. It is also called a closing part or price.
3. High: It declares the highest value of an assent during a particular time.
4. Low: It declares the lowest value of an assent during a particular time.
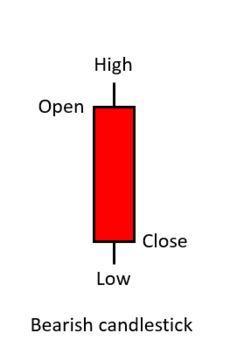
Anatomy of a Bearish candlestick:
We can see 4 main parts in a bearish candle. They are :
- Open
- Close
- High
- Low
1. Open: This is the starting part of a bearish candle. At this point, the price of an asset starts to go down.
2. Close: This is the last part of a bearish candle. It indicates the last price of the asset for a particular time.
3. High: It declares the highest value of an assent during a particular time.
4. Low: It declares the lowest value of an assent during a particular time.
Conclution
I have answered all the questions given. Hope you will like it. See you next time in another post. Till then take care & stay happy.
#club5050 😀