SEC S18-W4 || Mastering Liquidity Levels in Trading
(15).png)
The trading liquidity refers to the ability of an asset to be traded within a specific period with out influencing the market price of the commodity. High liquidity is commonly associated with both a high number of buyers and sellers who are able to trade this particular asset and a narrow spread between bid and ask prices and a fast execution of trades. On the other hand, low liquidity entails can entail limited number of participants and figure larger than the spread, meaning that large quantities cannot be traded without putting pressure on the price level.
Importance for Traders
- Liquidity levels are crucial for traders for several reasons
Efficient Execution: High liquidity also provides assurance that the trades can be done quickly and at an optimal price.
Reduced Risk: Liquidity can help in reducing slippage—the variation between an anticipated price that a transaction will occur and the final price that the transaction is executed.
Market Stability: Liquidity plays a role in maintaining market stability by allowing clients’ orders to transact in large volume without much effect on the prices of stocks.
Price Discovery: A lively trade also helps in the development of accurate price levels which reflect the going market situation of supply and demand.
Strategy Adaptation: Some traders benefit from specific market conditions, and that’s where the concept of liquidity plays an important role, both for gaining advantages and avoiding unfavorable circumstances.
Tools and Indicators for Determination of Liquidityiciencies .Traders use various tools and indicators to identify liquidity levels on a price chart.
Level 1 Bid and Ask Spreads: This is a primitive tool used to illustrate the gap between the maximum level that a buyer is willing to purchase a good or service for in exchange for the minimum amount of money that a seller is willing to accept in exchange for the same product. The wider the spread in this context, the lower the level of liquidity, while tight spreads refer to high liquidity levels.
Liquidity Indicators: What is more there are indicators like the ‘Liquidity Levels’ based on TradingView (ID: 4) that employ the use of pivot highs and the lows with an offset to define important levels in the market environment.
Smart Liquidity Profile: As mentioned earlier the ID: 5, this indicator helps to determine the price levels with respect to the trading importance for framing the support and resistance, trade voids, and consolidations.
Volume Analysis: Increased trading frequency is usually an indication that securities have higher liquidity. Tools like the Liquidations Indicator (ID: 8) They are useful in helping detect areas that traders with high leverage ratios might be potentially facing liquidation.
Liquidity Zones and Voids: These are places on the price chart where the amount of trades is high (zones of heavy trading activity) or low (zones of low trading activity), according to what is defined in section ID: 3. They can attract prices or warn of a reversal or potential reversal of a particular trend or pattern.
Market Depth Indicators: These indicators present the level of orders at certain price levels and offer an initial insight into the market liquidity at a range of prices.
Liquidity Level Finder Indicator: According to what is discussed in ID:2, there are software that could help compare structural, buy side, and sell side liquidity in the market such as the Sonarlab Free Liquidity Level Finder.
Otherwise, in case of levels of liquidity, fake-out is used to describe a pattern where a price gives a signal in one direction and rather than continuing in that direction, the price reverts the opposite way, thereby hiding the truth and trapping people into making a trade based on the false signal. There is always a probability for fakeouts to happen near the support and resistance level and usually happen in the zones with lower volatility.
Why the most problematic fakeouts exist for traders
Psychological Triggers: Speculators always possess prior beliefs of how profit can be earned; these beliefs are inclined towards a certain direction particularly when important levels are in sight. Such a false breakout may instill these expectations on the trader, resulting in him opening positions with the anticipation of a breakout or a momentum run.
Stop Loss Hunting: Large-scale market makers or other traders may front-run and manipulate the prices so that they would hit the ‘stop loss’ levels of these inexperienced traders. They can get all the liquidity at these levels by taking the price above or below such order’s execution levels and reap the benefits.
Algorithmic Trading: Moreover, algorithms having high-frequency trading can worsen real-time fakeout conditions due to the rise in the initial price movements. These algorithms are capable of responding to a price surge and in a recursive fashion, continue driving the price to further heights till the amount of volumes available for trading is exhausted and the price starts its reversal.
News and Events: They can also be initiated by fakeouts that occur when people make unexpected changes in their behavior or when some event or news alters certain expectations. What these cause is sudden and volatile movements of the market which can bite the traders who are trading based on historical tendencies or technical information acquired on the markets.
How Fakeouts Happen
- Fakeouts can happen in several ways
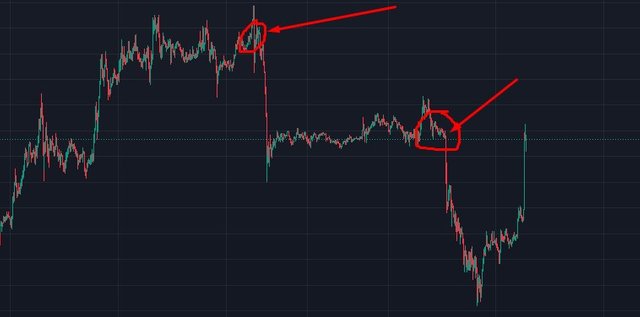
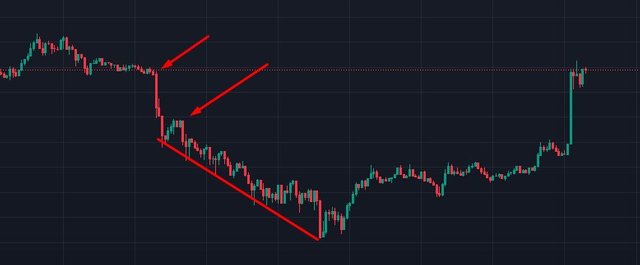
Spikes and Reversals: This is an entry technique whose reversal often occurs in sharp form just above a resistance level or just below a support level to create the impression of a breakout. However, when the liquidity is depleted, the price goes the exact opposite of what the traders have anticipated, putting them into positions that are contrary to the actual trend of the market.
Wick Formation: A Candlestick chart may contain wick, vertical lines that indicate price range, the highest and the lowest that were attained during the period. A long wick also points to a fakeout because the longer wick means that the price range has expanded but the actual candle never managed to reach the extreme level it seems to suggest.
Volume Dry-up: Another situation that may be referred to as fakeout is a situation where there is congestion and no volumes to back up the prices. First of all, the price may indeed go up or down and do so decisively yet this high price rarely comes with the volume needed and after the volume is gone the price usually returns to normal.
Order Book Manipulation: Market operators through quantitative buying or selling pressure dominate the market in a way that deceives other traders or market makers into perceiving a support or resistance level. When the orders are canceled or filled, the market may trend in the reverse direction of the perceived strength, leaving those who traded based on it in a rather vulnerable position.
Techniques in order to prevent one getting caught in fakeouts
Use Multiple Indicators: Such a risk arises when a person relies on the use of a single indicator or a price level while budgeting. Employ a number of variables and equipment to get information on the specific direction of the market.
Volume Analysis: Especially when high volatility is detected, by checking for volume at key levels this can confirm that such type of movement is supported by volume and therefore is credible.
Risk Management: Always include nonstop-loss loss orders and can use trailing stops if the price direction suddenly reverses.
Market Depth Awareness: Review the order book as this helps one to know how deep the market is and the exact point where lots of buyers and sellers are active.
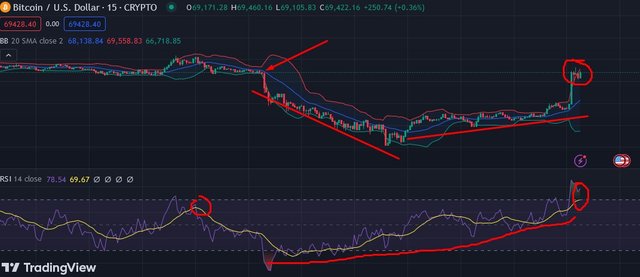
Divergence Indicators: In identifying fakeouts, look at the difference of price action from other OSCs such as the RSI or MACD.
News and Event Awareness: Understand when specific information pertinent to the economy that may affect the value of the currency is expected to be published or if an important event will take place.
Overall, by learning about the workings and the risks involved with fakeouts, traders can be wiser when it comes to fraudulent schemes of the markets of liquidity-based trading strategies.
In the worst-case scenario, trading given that strategies are aligned with liquidity levels pose a vast challenge when meeting fakeouts occur. Here are some tips and techniques to help you avoid being trapped by these deceptive market movements: Here are some tips and techniques to help you avoid being trapped by these deceptive market movements:
Use Multiple Indicators and Tools: Using only one index raises the possibility of falling into a fakeout where a security appears to be bullish or bearish only to reverse its direction in the opposite direction. By inviting other technical indicators are associated with measurements of liquidity, we can get a more complete view of the market.
Volume Analysis: Verify the volumes at points where fixed price levels are observed or touched. This might be effective in confirming an exaggerated price move since volume typically amplifies price movements whereas constricted volume can point to a fake-out.
Market Depth and Order Book: Examine the extent of market that you are going to trade and the flow of orders at various price ranges. This will be good in making inference regarding areas of high liquidity and areas which may hold key resistance or support.
Risk Management: Managing risks in a proper way: stop loss orders should be used in the case of fakeout to prevent high amount of losses if they appear.
Divergence Indicators: Pay attention to cases where price is in a contrasting direction to the indicators on the chart like the RSI or MACD. This can signify a fakeout, where the person switches from the offenders’ side to the reforming position and vice versa.
News and Event Awareness: Remember when there are news releases or any other occurrence that triggers short term rapid fluctuations that might lead to fakeouts.
Backtesting and Historical Data Analysis: Examine historical market price charts in order to identify trends of real liquidity and fakeouts. This could be important in the strategy formulation process in the context of defending against deceitive price changes.
Concrete Example: Preventing Fakeouts with the help of Liquidity and Volume Indicator
Step 1: Determine the points at which sufficient liquidity must be available. Overlay a liquidity indicator or examine the bid-ask spread to determine where within a stock or ETF’s allotment liquidity is abundant or scarce. Consider the trends that have been influential before, for instance, support and resistance levels observed before.
There is one way to assess the levels of liquidity of the Steem (STEEM) token using several sources and methods. Alright, let us assume the given data and the current market conditions to explain the overall liquidity position of STEEM.
Generally speaking, Market Trends prescribes the following Current Market Conditions.
Price: At the time of writing this, the stake in STEEM for a given amount of credits is about $0. 2716 USDT.
24-hour Price Change: The token has declined by 1 percent and is currently trading at $0.33. 42% within the last 24 hours, they found that stiff competition is leading to increased pricing pressures among the competitors
Circulating Supply: Total tokens distributed to date are 460 million.
Liquidity Levels Analysis
There are three ways of determining the levels of liquidity in the market which include: order book and the size of the trade at different price levels. This information is not given, however, it can be deduced from the materials used both in books and articles. For example, a sharp downward movement of volumes at particular prices may signal low liquidity to investors while the opposite, constant volumes will point to high liquidity levels.
Let’s assume the following hypothetical liquidity levels based on historical and current market data:Let’s assume the following hypothetical liquidity levels based on historical and current market data:
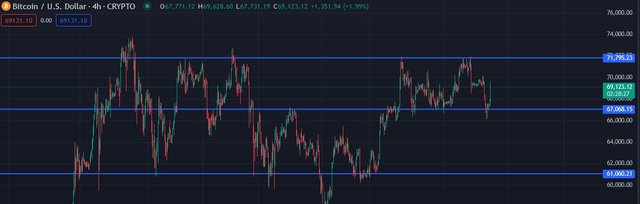
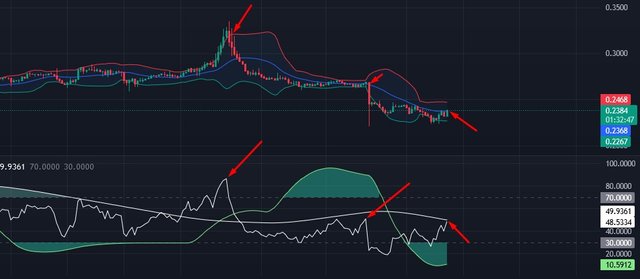
High Liquidity Level: $0. 2802 – recently this price has been giving strong volumes, indicating that there has been an increase of late.
Low Liquidity Level: $0. 2451 - by this stage, the market price has declined to this point but trading is at a lower frequency meaning lower volume.
Potential Trade: Such a long position typically reflects an expectation of increased liquidity.
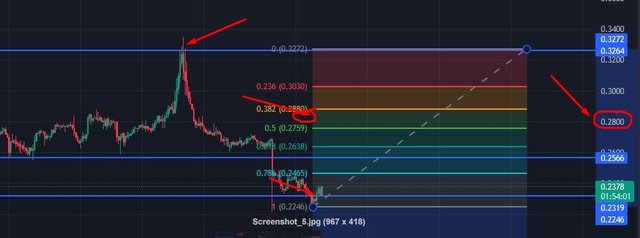
Reasoning: On the basis of the analysis, one can note that the STEEM token possesses a considerably higher liquidity of $0. 3364 and with lower liquidity at $0. 2319. The idea is to enter a position where STEEM is at a low trading volume while manually predicting that it will return to the high trading volume at which we can again sell the stock and make a profit. Entry and exit strategies refer to the actions a trader must take in order to enter the market and exit the particular position that they are interested in.
Entry Point: Await for the price to sell at low liquidity level, that is, the price $0. 2319. This is a buying opportunity since the candle has priced at a level where it has a lower tendency to trade hence might provide a good price entry point.
Order Placement: To take advantage of buying the STEEM deposit at the lowest possible price, a limit order of $ 0 is placed. 22566. This makes sure that the order is only to effect the intended price or even better than this price, thereby minimizing slippage.
Risk Management: Place a stop-loss at a few percentage points below the price at which entry was made to minimize loss in the event of price movement in the wrong direction. For example, suppose $ the exchange rate moves below $0.1800 In the event that the position required and the available applicant's number is 2400, the position would be closed automatically.
Exit Point: Ideally, one should aim at exiting the position at the high liquid level as indicated in the figure ($0.2802). This is the target profit level that is common in most markets that are likely to have market consumers to buy at your desired price.
Market Watch: Prudence should be exercised in monitoring market states. If news or updates relative to the STEEM token bring changes, adapt the exit plan all the same. For example, the indicator can assume the form: ‘If the price increases or decreases at a high rate over $0. Therefore, due to the current 2802, it may be possible to set the additional profits into lock-ins.
Exit Execution: It is advised that one should place the limit sell order at $0. 2802 to act to ensure future profits. This makes sure that the position is closed on or before a particular price target that can as well be better.
Liquidity-driven trade is not just guessing and blaring with massive trades, it entails a good understanding of the market environment, proper market analysis and sequencing of the trades. Recognizing these key high and low liquidity areas allows the trader to possibly make correct decisions on any given entrance and exit strategy within their trading plan in order to maximize profit or, possibly minimize risk. However, it should be always kept in mind that the market is dynamic and thus solid strategies ought to be adopted with due regard to the real-time data available to risk-takers.

Thanks to everyone here is an invitation @ripon0630 , @solaymann ,@msharif
X promotion link
https://x.com/mostofajaman55/status/1800901551634161815
Upvoted. Thank You for sending some of your rewards to @null. It will make Steem stronger.
Nice entry. Market Depth and Order Book is important to refer when deciding to trade. The indicator Liquidity Zones and Voids, I guess this is a paid tool on TredingView because its locked there.
By looking at market depth we can understand what price range the big feller buyers are in. A big seller hit is likely to move the market down, just as a big buy hit is likely to move the market up. Which we can easily find out by looking at the market, it is really very simple and important for trading. Thank you so much for your nice comments and reading my post. Yes there are some tools which are paid and free we can't use more than three tools.
@mostofajaman Great explanation of liquidity levels and their importance in tradingIts clear why high liquidity helps in executing trades efficiently and reducing risk. I appreciate the practical tips on using indicators like bid ask spread and volume to identify these levels on price charts. The section on fakeouts and how to avoid them is especially useful. Overall your insights are very helpful for traders. Good luck
Thank you so much for commenting and reading my post.Good luck
I read your post you can tell about the crypto , trading view and some others you can explain very nicely and you explain fakeout example it's very informative post .I have also participated in it..
Best wishes 💞
Los falsos quiebres me llamaron la atención desde un primer momento. Leyéndote pude entender esta parte que me pareció genial. Tu explicación es muy buena.
Gracias por el aporte de tus conocimientos al contenido de tu post.
Te deseo mucha suerte y éxitos.
Greetings @mostofajaman,
You really know your stuff when it comes to trading, and your tips are like a treasure map for navigating the trading world.
Thank you very much To be honest I am trading myself and I have investments in crypto.