Mastering the Sharkfin Model for Trading
.png)
My dear friend welcome to my challenge hope everyone is fine I am fine here to participate in the four week of engagement challenge 19 this time the topic is "Shark fin" Trading Strategy. In fact, it is somewhat related to Sark Head and let's not talk about some information we know about it.
The Sharkfin Model for trading is a strategy which involves the use of options with a payoff pattern that resembles shark’s fin. It usually entails the trading of options for calls and puts at the various strike prices for the purpose of profiting from changes in the volatility of the prices of the assets in which the options are based on while at the same time minimizing risks during the trading process. It is designed to earn profits based on large changes in the price of the underlying asset making it a model with a different pay-off for traders’ risk.
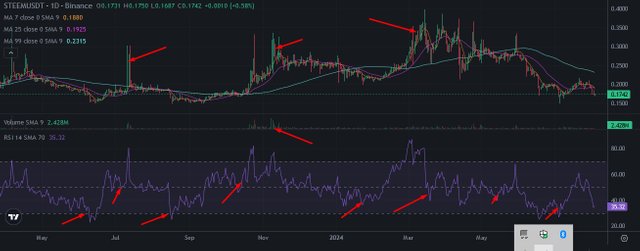
Sharkfin is a technical analysis pattern identified in trading which has the shape of a shark fin known in trading as the Sharkfin model. It often warns of a possible reversal in terms of the price action, be it up or down or a transition from the former to the latter and vice versa. Here are the details of the concept and the way of its definition in the given price chart.
Sharkfin Model
Formation: This Sharkfin pattern tends to emerge when there is a fairly large directional price movement; it could be upwards or downwards. It’s defined by the fact it has a relatively high price, and then sharply plunges or stabilizes thereby forming a fin-like spike.
Market Psychology: The pattern works out in the event where a trading pattern shows signs that traders have bullish or bearish feeling and therefore a sharp movement of price takes place. The subsequent downtrend or a flattening also means that any initial price movement was unsustainable, which can be a signal of a reversal to the contrary.
Finding the Sharkfin Pattern on a Price Chart
Visual Characteristics:
Sharp Spike: The basic pattern involves a very sharp rise in price (or a fall in it) that forms the top part of the shark’s fin.
Decline: Following the top, the price falls to the ground creating the flat fin at the bottom of the letter V.
Volume: Finally, often enough the volume increases at the formation of the pattern that shows a strong buying or selling pressure.
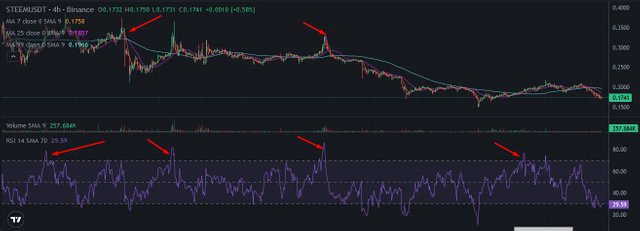
Time Frame: The Sharkfin pattern can be seen on intraday charts or longer hourly/daily/weekly charts, although it is more effective when traded on longer charts.
Context: But always it is necessary to look at the bigger picture. The Sharkfin pattern is more meaningful when the identified pattern occurs at supports or resistance or when there was a long-term trend.
Example of Identification
Bullish Sharkfin: It consists of a low which is when the price is falling over a period of time, and then goes up quickly to a high and then drops. This could suggest that the price could be at a point of turning around and moving in the opposite direction up.
Bearish Sharkfin: The price rises up and is sharply pulled down to make a peak to down slop as quickly as it went up. That may signal the resumption of the bearish trend to the downside.
The Relative Strength Index or the RSI is an indicator derived from the momentum indicator class known to measure the speed of and changes in prices. It is a number ranging from 0 to 100 and is used popularly to determine overbought and oversold position in the market. However, when the Sharkfin patterns are combined with the usage of RSI, the trader can get some additional confirmation signals in terms of certain reversals.
American bullfrog, the maneuver involves employing Relative Strength Index indicators or popularly the RSI to identify Shark fins patterns. Understanding Overbought and Oversold Levels: Understanding Overbought and Oversold Levels.
Typically, when RSI value is greater than 70 the stock is deemed to be overbought and when it is below 30, the stock is considered oversold. These levels suggest that the wont of the asset is to correct or reverse in the indicated direction.
Identifying Sharkfin Patterns:
A Sharkfin pattern is usually characterized by an upward trend in the price of a security and then an immediate drop. This pattern can be observed on a price graph or chart of the financial instrument in question. Traders will be able to use the RSI to check the following the formation of a Sharkfin pattern whether the pattern is consistent with a potential reversal.
Confirmation with RSI:
When the Sharkfin pattern occurs and the RSI shows a value higher than 70, this offers the rationale that the value of the asset will go down thus, concluding that is overbought. On the other hand, when a Sharkfin pattern is developed, and the RSI is beneath 30, it is a sign that the asset is oversold and is likely to bounce back to the reverse direction.
Real-World Example
Suppose we are looking at a particular stock say XYZ Corp and you observed that it has been on the rise. In this case, a pattern referred to as Sharkfin is developed, which involves a high at which the price increases before falling again.
RSI Metrics:
- They maximize the what of the Sharkfin and they get to the value of 75, hence it implies that the stock is over bought.
- After reaching a high, the moving average, used to measure the relative strength, slowly starts to fall down, indicating bear sentiment.

When applying the Sharkfin model to the Steem token (or any cryptocurrency), the ‘buy entry’ aspect focuses on specific patterns of the token for technical indicators’ confirmation. Here’s a detailed breakdown of the criteria you should consider before entering a position, Here’s a detailed breakdown of the criteria you should consider before entering a position:
- Realization of the Sharkfin Pattern
Sharkfin Pattern Characteristics:
The Sharkfin pattern is usually characterized by a short and steep rise in the price, which drops as quickly as it emerges, forming the look of a shark’s fin. They should identify a relatively high price that is followed by a high that retraces very sharply.
Example Setup:
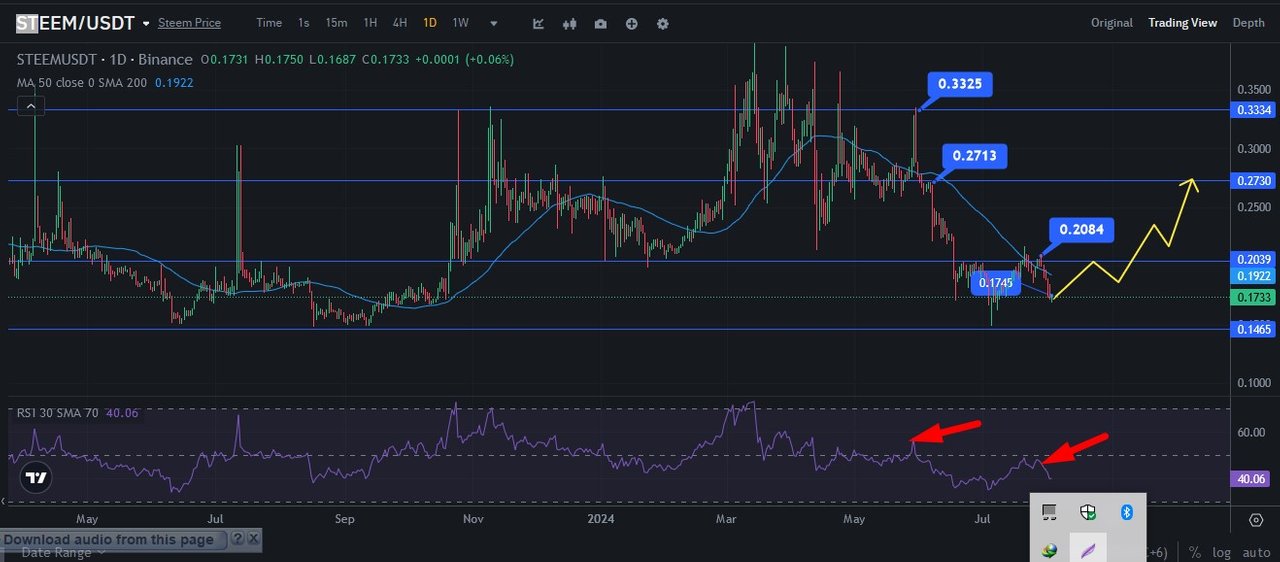
Let us assume that the Steem token has been hovering around $0. 17 and it just rapidly jumps to $0. 32, which forms the Sharkfin orally. After reaching $0. 17 it begins to sharply decrease which suggests there is a possibility of a turnaround.
- Based on the above evidence, confirmation with the RSI is advised.
RSI Signals:
Thus, the RSI can be used to affirm that the asset is in an overbought position. A value above 70 is considered an overbought level for the asset. Wait for the price bars to diverge from the RSI line. For instance, the $0 price may form a new high when resists the previous level of resistance such as; Nevertheless, at 70 it does not spike past the high of the RS-line, this could indicate a reversal.
Example Setup:
As the price becomes $0.35, check the RSI. If it reads 40 but previously touched 45 when the price was high last time, then it adds to the probability of a reversal.
- Volume Analysis , Volume Confirmation:
Discuss trading volume while building up the pattern of the Shark fin. When price goes up, volume should also go up, but it should also follow that when price comes down, volume will also go down, to confirm the pattern. There should be a sharp decline in volume when price reaches its highest point, which means there is no demand for the asset.
Example Setup:
If the volume rises to 1 million Steem tokens transacted as the price goes to $0. 70 and starting declining to 200,000 tokens once the prices start depreciating, this backs up the Sharkfin pattern.
- Additional Technical Indicators
Moving Averages:
By looking at moving averages for instance 50-day, and 200- day you get the general direction. If the price is below these moving averages after the Sharkfin pattern forms, the bearish signal could be given.
Bollinger Bands:
Here you need to determine if during the spike the price has almost reached, touched or crossed the upper Bollinger Band. If the price returns inside the Bollinger bands then it is a valid indication of reversal.
- Entry Point
Entry Criteria:
Enter a short position when: Enter a short position when, The price has created a Sharkfin pattern. The RSI is greater than 70, which means the commodities are overbought in the market. It can be seen that 20 moving average is below 50 moving average and 200 moving average is below the price which indicates that the trend is bearish.
If the price has broken the upper Bollinger Band and has now come back inside the band, a reversal is quite possible.
- Stop Loss and Take Profit refer to the specific levels, which must be reached for a trader to close unprofitable transactions and to exit profitable ones.
Stop Loss:
If the price starts moving in the opposite direction, place the stop loss above the highest point of the Sharkfin pattern. This could be a few pips above the peak to factor in fluctuations in the market as it reaches it peak.
Take Profit:
Set a take profit level with the Support levels or with the minimum Risk Reward Ratio of 1:2. This simply implies that if you want your stop loss at a 50 pips, then you must target at least a take profit of 100 pips.
- Monitoring the Trade
Trade Management:
Trade this range closely especially when the price is near the support zones. One can also change the stop loss to break even once a trade is in profit to avoid recovering the stop out in case the price turns around.
- Exit Strategy
Exit Criteria: Exit the trade if .
- This market currency reaches the take profit level in relation to its price.
- The price falls and touches the stop loss level.
- The RSI trend goes below the 50-OBB line, implying that the commodity’s momentum is slowing down.
- A bullish reversal pattern is created which indicates a change in the trends.
When applying the Sharkfin pattern to the Steem token (or any asset), establishing clear trade exit criteria is crucial for managing risk and maximizing profits. Here are some signals and conditions that can indicate it’s time to exit a position:
Trade Exit Criteria for Sharkfin Pattern
Price Action Confirmation:
- Break Below Support: If the price breaks below the support level established by the Sharkfin pattern, it may signal a reversal or continuation of the downtrend, prompting an exit.
- Failure to Reach Target: If the price fails to reach the anticipated target after forming the Sharkfin, it may indicate a weakness in the trend.
Technical Indicators:
- RSI Divergence: If the Relative Strength Index (RSI) shows divergence (e.g., price makes a new high while RSI makes a lower high), it can signal a potential reversal, suggesting it’s time to exit.
- Moving Average Cross: If a shorter-term moving average crosses below a longer-term moving average (e.g., a bearish crossover), it may indicate a shift in momentum, prompting an exit.
Bollinger Bands:
Price Touching Lower Band: If the price touches or breaks below the lower Bollinger Band, it may indicate that the asset is oversold, and exiting could be prudent to avoid further losses.
Time Based Exit:
Predefined Time Frame: Set a specific time frame for holding the position. If the target is not met within this period, consider exiting to reassess the market conditions.
Market Sentiment:
Negative News or Events: If there is negative news or events affecting the Steem token or the broader market, it may be wise to exit the position to mitigate potential losses.
Stop-Loss Trigger:
Predefined Stop-Loss: Always set a stop-loss order at a predetermined level to limit losses. If the stop-loss is triggered, exit the position immediately.
Sharkfin model will be applied to the Steem token. This approach can be done by enacting real data set from a trading platform on the framework mentioned above. For Example Let’s assume there is a Shark fin trade in the Steem Token
- Market Analysis
- Market Sentiment: Overall the sentiment is bullish mainly because of the latest information of the updates on the platform and user traffic.
- Identifying the Sharkfin Pattern
Chart Observation: You see that there is a Sharkfin pattern building up on the daily chart. The price has risen followed by some consolidation and this has formed a fin where there is a slight pullback.
Pattern Confirmation: The kind of pattern is In turn, the volume confirms it by rising during the actual rise of the price and dips during consolidation.
- Entry Point
- Entry Signal: The price breaks above the peak of the Sharkfin pattern at $0. 3525 with strong volume resistance.
- Entry Price: Since $0. 3525 is resistant, you must exit below the lowest support and low rate 0.1745.
- Setting Exit Points
- Target Levels: According to the Fibonacci retracement levels you establish the potential resistances at $0.3588.
- Partial Exit Strategy: It will be advisable to take partial profits at these levels:
- First Exit: You will have 50% of your position at $0. 2084
- Second Exit: It means that in each Party, the amount of contribution by the Stayed Party shall be reduced by 50% and will be equivalent to $0.2713
- Trade Execution
Buy Order: You make a bid of buying 1000 Steem tokens at $0. 36.
Total Investment: $360.
- Monitoring the Trade
Price Movement: Gradually in the subsequent days, the price increases to the newarken of $0. 45 within a week.
First Exit Execution: translated to massless particles at $0. 45, then you sell 500 Steem tokens enabling you to gain $45 (500 tokens x ($0. 45 – $0. 36)).
- Adjusting Stop-Loss
Stop-Loss Adjustment: When exiting for the first time, you then relocate your stop-loss to the breakeven point at $0. 0.1620 to protected your remaining position.
Major components of the Sharkfin Model for trading are risk management and profit tracking and hence this model focuses on getting the most out of the available risks. Explaining to traders where to buy and where to sell to help solve the problem of violent price fluctuations is possible when using a specific approach to points of entry and exits. To enter this model, stop-loss orders and the processes of changing them while making trades are included and underlined specifically, aiming to lock profits and reduce losses. All in all, the "Sharkfin Model" presents an efficient trading plan with strict rules and guidelines that any trader can use to improve his performance and get consistent profits in the financial markets.

Thanks to everyone here is an invitation @edgargonzalez @mesola @rmm31 @mini80 @shahariar1

Bullish Sharkfin: This is price skimming where it in a product’s life cycle a firm sets high price initially, then lowers the price slightly and immediately raises it back to a rather higher point before again lowering it. It implies that the situation might turn to the benefit of the upside.
Bearish Sharkfin: On its way up, price moves up steeply, turns sharply downwards to form a crest of the graph followed by a trough. It may be signaling for the continuation of the bear phase.
Therefore, I would like to remind you that the Sharkfin pattern, if used in conjunction with other indicators, and signals are confirmed, it is more effective.
Your description was great. All the best in the competition.
Hello friend you have mentioned the details in the comment anyway thank you very much for commenting my post and good luck for reading.
Upvoted. Thank You for sending some of your rewards to @null. It will make Steem stronger.
You made an informative and clear post on Sharkfin trading model. Your explanations and given examples can help readers' to improve knowledge on this strategy. I guess RSI is one of the good indicator that can combine with other chart pattern which provide good success ratio on buy side and sell side.
Sure RSI is one of the good indicator. Thank you very much for commenting my post and good luck for reading.
Hello sir. Greetings to you. Thank you for sharing this wonderful piece of work with us. I'm really trill reading from your entry.
You got the explaining of what a sharkfin model is. Illustrating how to sport them in a trend. Volumes, Sharp increase or decline etc, all describe the characteristics of sharkfin fin model
.
Using chart properly, u are able to locate these patterns on different time frame.
U equally elaborate on your knowledge of using RSI together with sharkfin model to figure out market test and reversals.
You have list the various criteria using your model to execute a real life trade using the sharkfin model.
Overall your work is quality. And well explain.
Great job and good luck
Thank you very much for commenting my post and good luck for reading.
You have written well on the Sharkfin model, and your understanding of using the technical indicators such as the RSI, moving average, and Bollinger bands for analysis of the market is also good.
You have also written well on the entry and exit points in your analysis. Trading an asset is much more profitable when we know when to enter and exit the market. I wish you success, my friend.
Hello, Details in the comment anyway thank you very much for commenting my post and good luck for reading.
Greetings my friend @mostofajaman,
Your post is incredibly insightful! Its highlight is the detailed explanation of how to identify and trade using the Sharkfin pattern. Your use of real-world examples makes it easy to understand and apply. Awesome job! 😊
thank you very much my dear friend.