Steemit cryptoacademy homework task for @kouba01 //Ichimoku Kinko Hyo indicator by Monz122
Hello everyone this is Monz from India so here I am with my homework task of Ichimoku Kinko Hyo indicator given by professor @kouba01
Now Let's Understand this topic in detail .....
Q1 What is Ichimoku Kinko Hyo indicator ?
Ichimoku Kinko Hyo indicatorcan be defined as a method of technical analysis on candlestick charts , traders use it for accuracy and price analysis purpose...
Some lights onthe history of Ichimoku Kinko Hyo indicator:
It was developed by Goichi Hosoda a Japanese journalist in 1930....
It took 30 years perfecting the techniques and then released it to the general public in the late 1960's...
"Ichimoku" means one look in Japanese.
Expert traders taking a looks comes to know the information of the price chart and can easily make the desired outcome.. ( But then the trader must be an expert and must know the proper user of this indicator).....
Coming on to its features :
Ichimoku Kinko Hyo indicator is very helpful in getting the desired information...
Features of Ichimoku Kinko Hyo indicator:
• Provides clear picture of potential price action
• We can know the direction of the trend through candlestick chart ..
•Contains more data point compared to standard candlestick charts..
The fact that caught my attention was its its as mentioned by the Japanese that through one look one can figure out the trend ...
So from this we get to know that its very useful for getting knowledge of trends....

What are the different lines that make it up?
Different lines that make up "Ichimoku Kinko Hyo" indicator...
Ichimoku Kinko Hyo indicator contains 5 lines which are mentioned below:
1) Kijun-sen : This line helps in finding the future price movement and is also known as "baseline"...
Kijun-sen Calculation:
( highest high + lowest low)/2 for the past 26 periods.
If the price is higher than the blue line, it may cclimb higher. If the price is below the blue line, it may keep dropping.
2) Tenkan-sen: It is also known as turning line and is used as a singnal line and a minor support
Tenkan-sen Calculation:
(highest high + lowest low)/2 for the last 9 periods.
It is an indicator of market trends and the movement of the red line (upward and downward movement) indicates that the market is trending ...
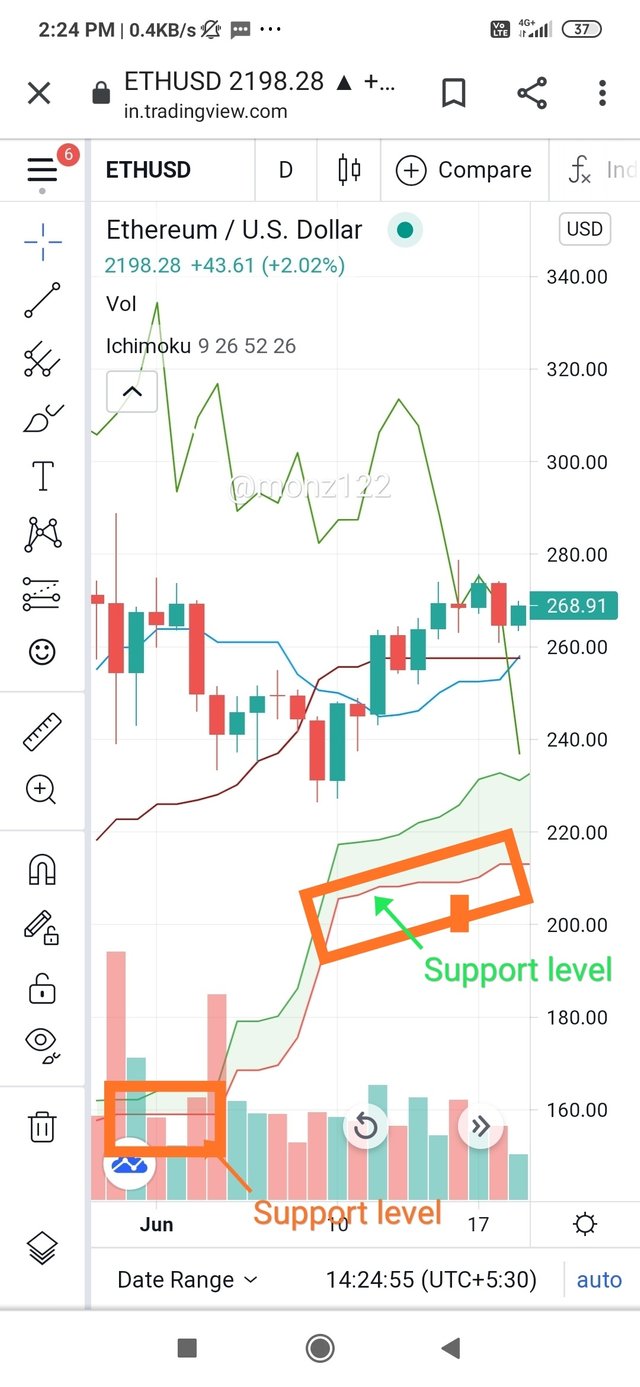
These two lines are also used to tracking support levels ..
3) Senkou Span A : This line is also known leading span 1, this line forms one edge of the cloud...
It is the result of an average of the Kijun line and Tenkan line .....
span A calculation:
(Tenkan-sen + kijun-sen)/2 plotted 26 periods ahead.
4)Senkou Span B:Also known leading span 2, this line forms the other edge of the Kumo.
They are plotted 26 periods ahead.
Senkou span B calculation:
(highest high + lowest low)/2 calculated over the past 52 time periods and plotted 26 periods ahead.
5) Chikou Span: Chikou Span is also known as the lagging span and is used as a support aid..
This line lags in the Ichimoku indicator by 26 periods
We can get the buy signal by seeing the green line which crosses the price in the bottom-up direction and sell signal when green line crosses the price from the top-down....
Adding Ichimoku indicator to the chart
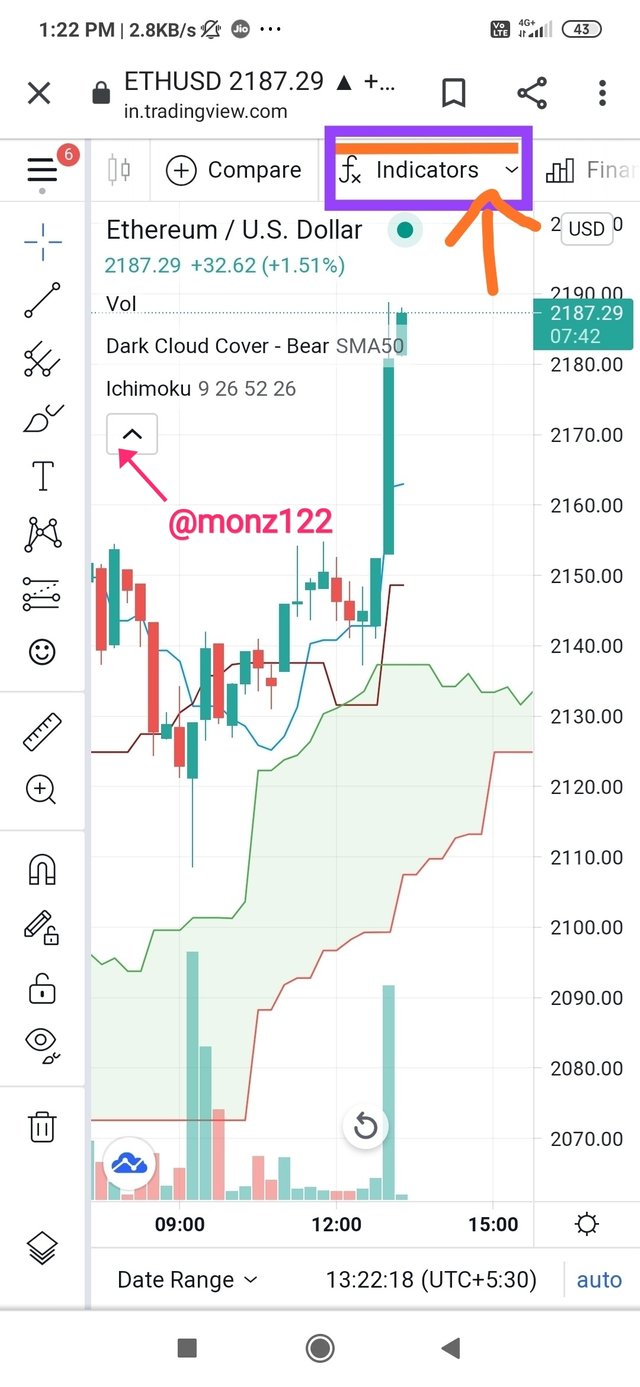
- Open the chart and apply Ichimoku indicator and click on fx for applying the indicator as shown in the picture below:
 src
src
Step (1) Clicking on fx for applying indicators..
Step 2 (2) Clicking of the type Ichimoku cloud on the search bar .....
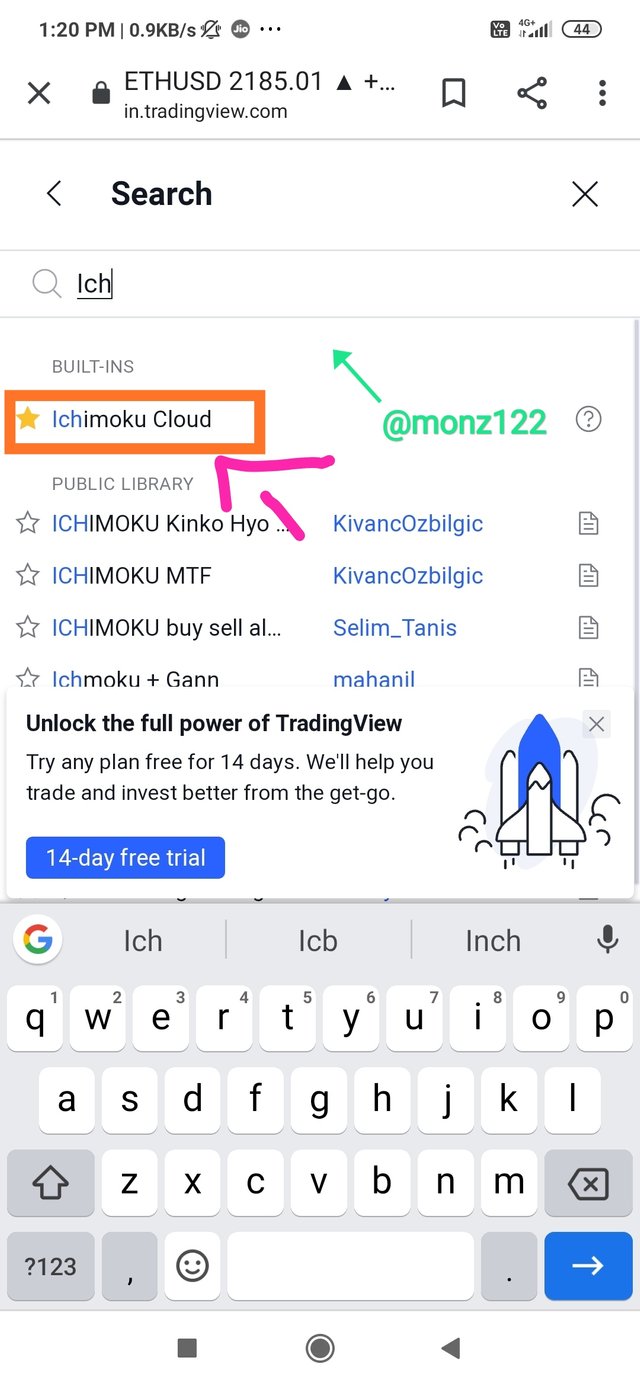
(2) Search Ichimoku cloud...
3) Ichimoku indicator applied on the chart.
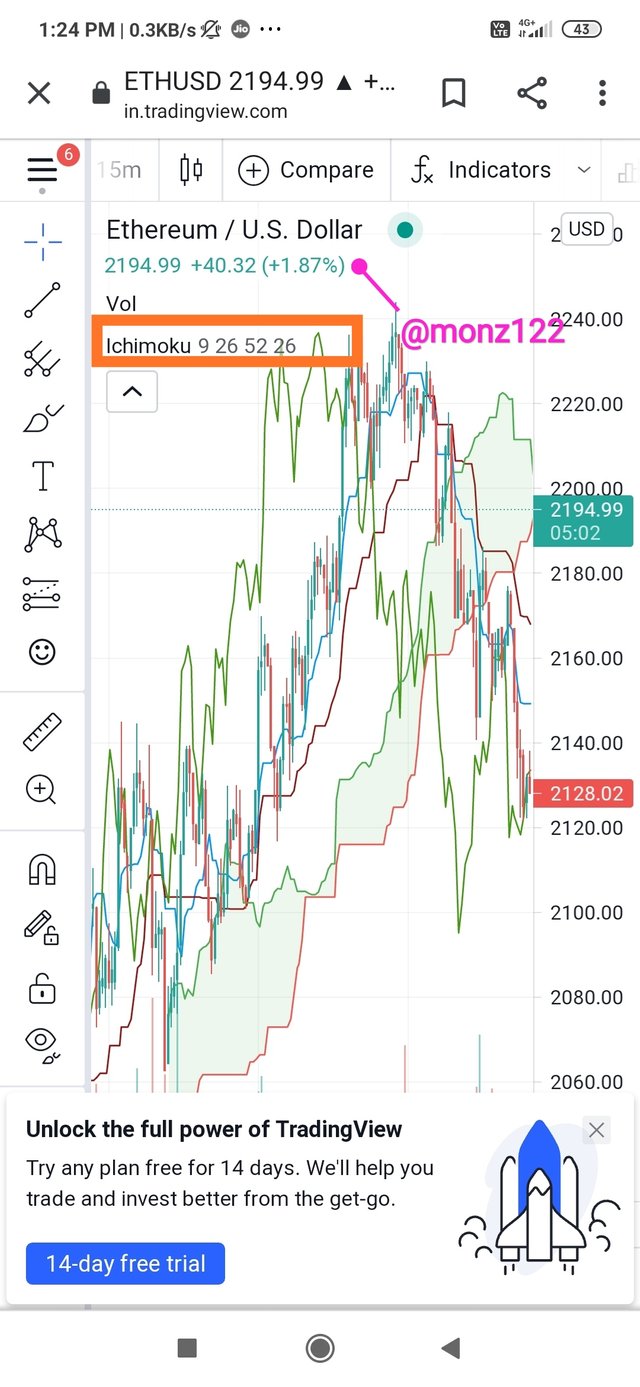
(3) Ichimoku indicator applied on the chart....
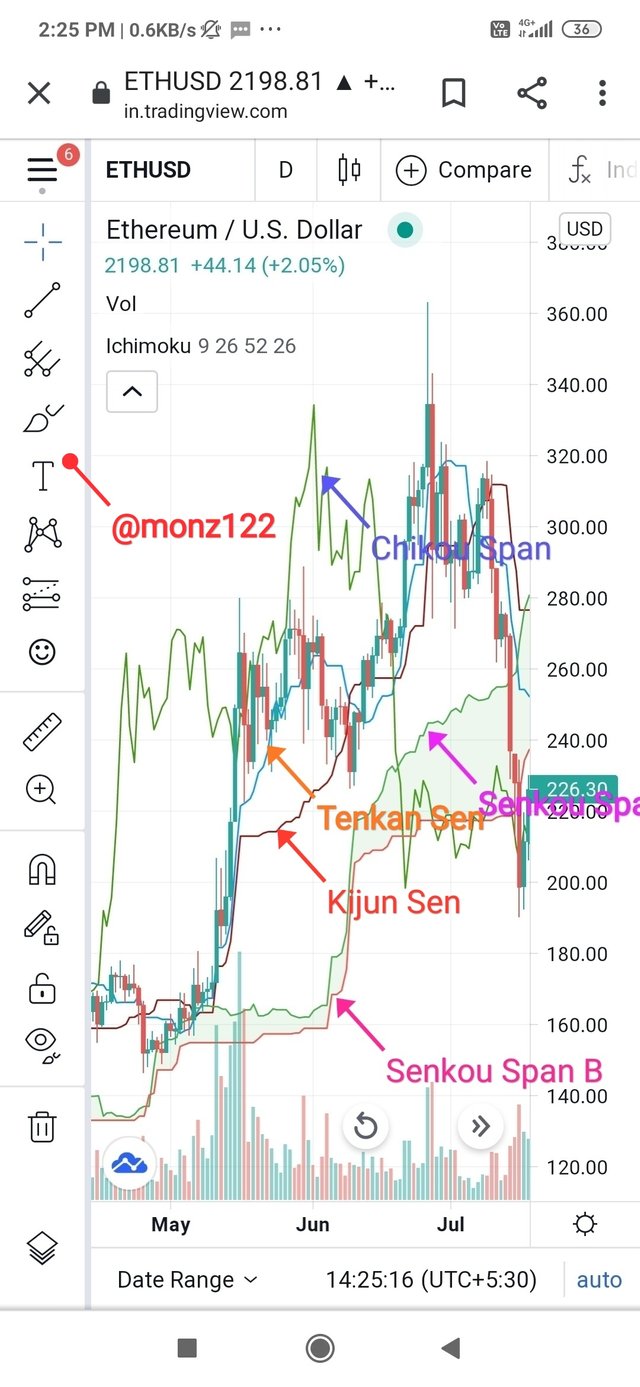
(3a) Ichimoku indicator with its components...
Default Settings of Ichimoku Kinko Hyo indicator....
Ichimoku Indicator in default setting contains an input option in which there are period of the conversion lines which are baseline , turning line , leading span 1, leading span 2 and lagging span line.
Length of Baseline: the length of Baseline is 26 days as Sundays are not counted and calculating a month's Sunday will be 4 sundays so( 30-4 = 26 days)
Therefore 26 days period is taken...
Length of turning line: the length of turning line is 9 days reason for this is close on Sundays , therefore one and a half week is equal to 9 days leaving Sundays...
Length of Leading Span 2 : the length of Leading span 2 is 52 which is 2 months excluding Sundays so excluding 8 sundays period of two months will be equal to 52 days....
Length of Lagging Span :the length of Lagging Span is 26 period plotted behind the price line in the chart....
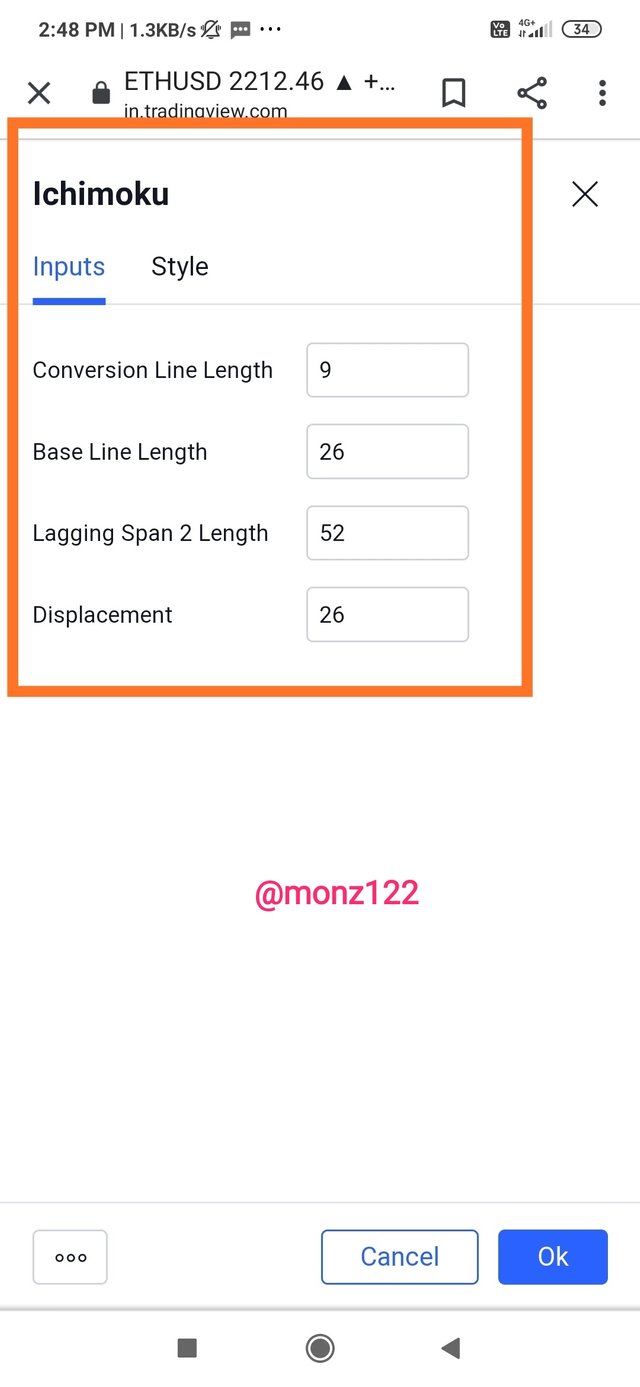
(1) Input settings of Ichimoku Kinko Hyo indicator..
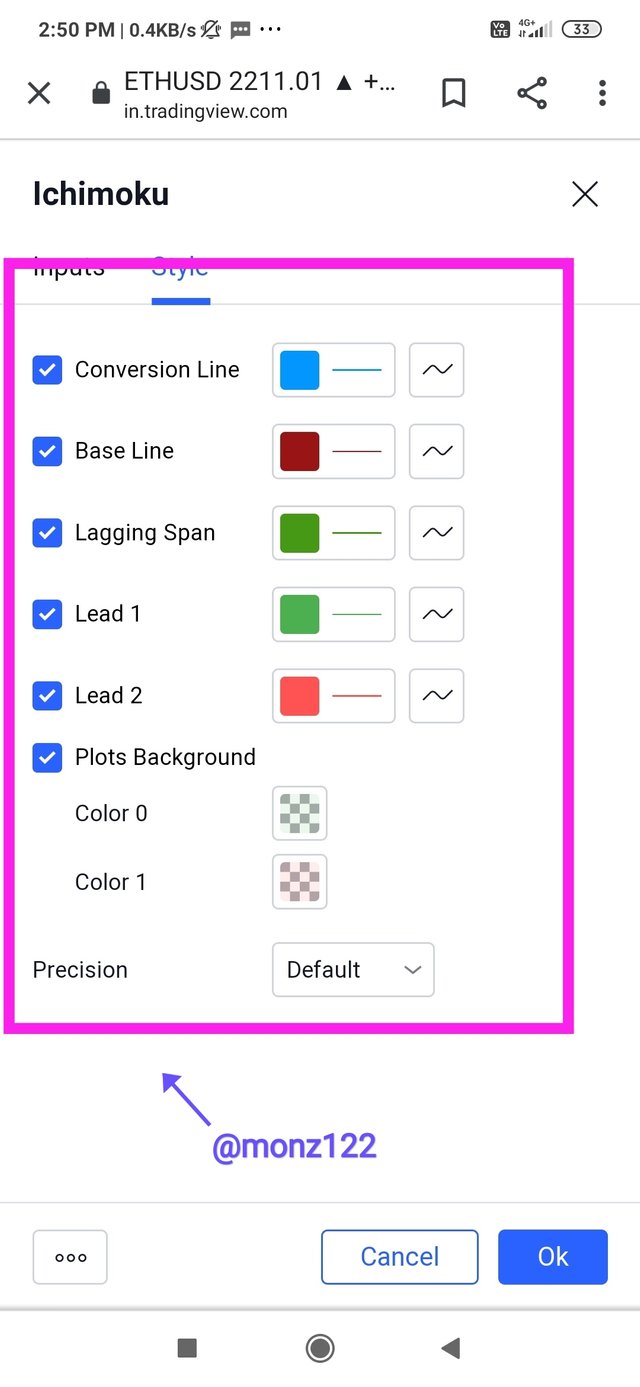
Another option is style in settings , in style option Colours of the lines can be changed as per your choice in Ichimoku Kinko Hyo indicator..
(2c) Should default settings of the Ichimoku Kinko Hyo indicator be changed?
The default settings of 9-26-52 can be adjusted to suit a 5-day workweek at 8-22-44 but then taking the fact of cryptocurrency markets which is open 24*7 so the fact is still a debate...
So Goichi Hosoda came up with the below settings..
•Conversion line -9
•Baseline -26
•SSB -52
The periods were set according to the Japanese market opening on Saturdays also , so he made the above settings...
But according to my knowledge this indicator gives us optimum results but then in many Other parts of the world saturdays are off So according to those people ( 7,22,44) must be the optimum settings...
Similarly for Cryptocurrency Markets we can conclude that (20,60,120) might be the optimal settings...
So one can choose their default setting based on the geographical location and trading pattern.
How to Use Tenkan Sen Line?
Tenkan Sen is the fastest line on the Ichimoku Kinko Hyo indicator..
It helps in indicating the price direction in short term .....
Tenkan-sen line can be calculated from the formula below:
Conversion line =( 9 PH + 9PL/2)
Ph = period high and Pl = period low
For this we have to find the the highest price in the previous nine periods
then we have to find the lowest price in the previous 9 periods and by adding and then dividing the values.....
The Uses of Tekan-Sen Lines:
•Tenkan-Sen line is used for spotting the support level by traders as Tekan-Sen line provides better prediction of price of the asset and also reflects strong support, compared with other moving averages which give a smooth curve.
• Tenkan -Sen also plays a vital role in generating Senkou - Span A as the edges of the clouds shows support and resistance points , whereas the thickness of cloud indicates price...
•Tekan- Sen is the Strength of of trends as it reflects the trends through angles and movements , moreover the flat lines reflect no trend or or very weak trend...
Uses of Kijun Line
Kijun line is used for positioning the stop loss as by keeping the track on Kijun line traders positions its stop loss, move over no matter whether the price goes upward or downward the price comes to an equilibrium point ..
Kijun line is used for accuracy by the traders as it uses the trend of 26 periods so comparatively its more accurate and reliable....
Using Kijun line and Tenkan lines simultaneously
In 2 cases both the lines can be used simultaneously :
• Tenkan line going above the Kijun line and during their crossover a change is reflected in which is moving up Tenkan line after a crossover an uptrend is reflected..
• When Kijun Line moves above the Tenkan after the crossover a change in trend is depicted which is a downward trend or you can call it a sell signal...
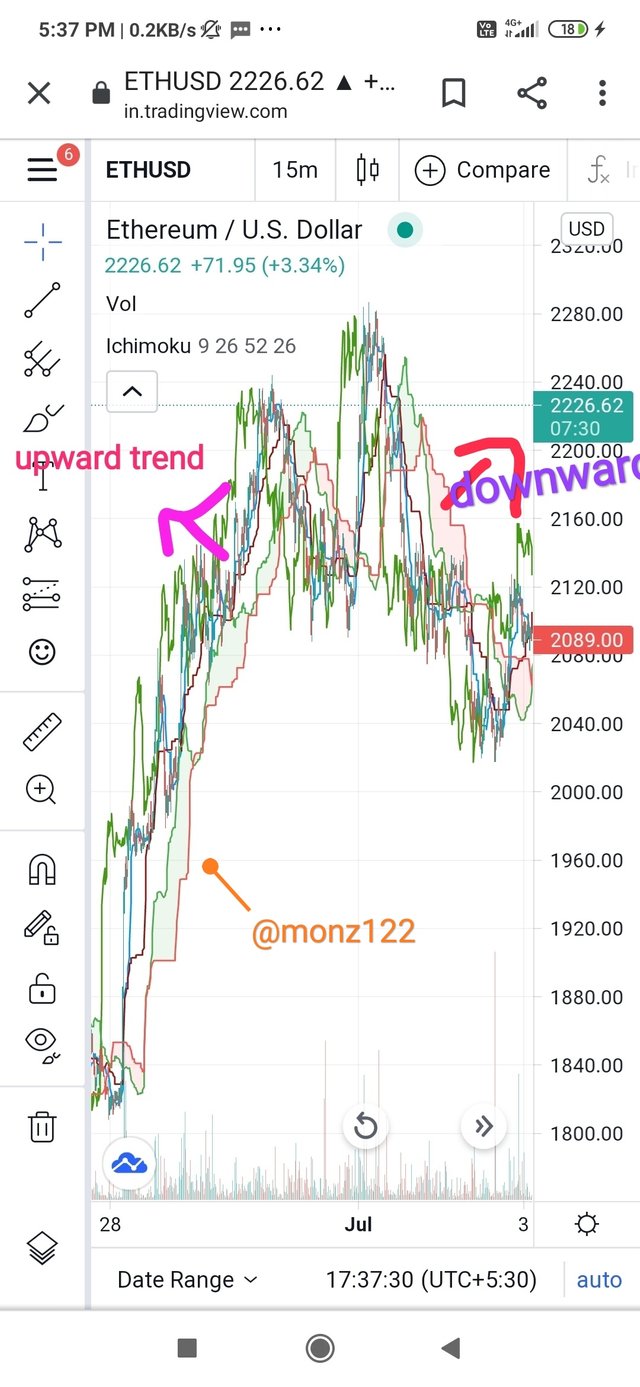
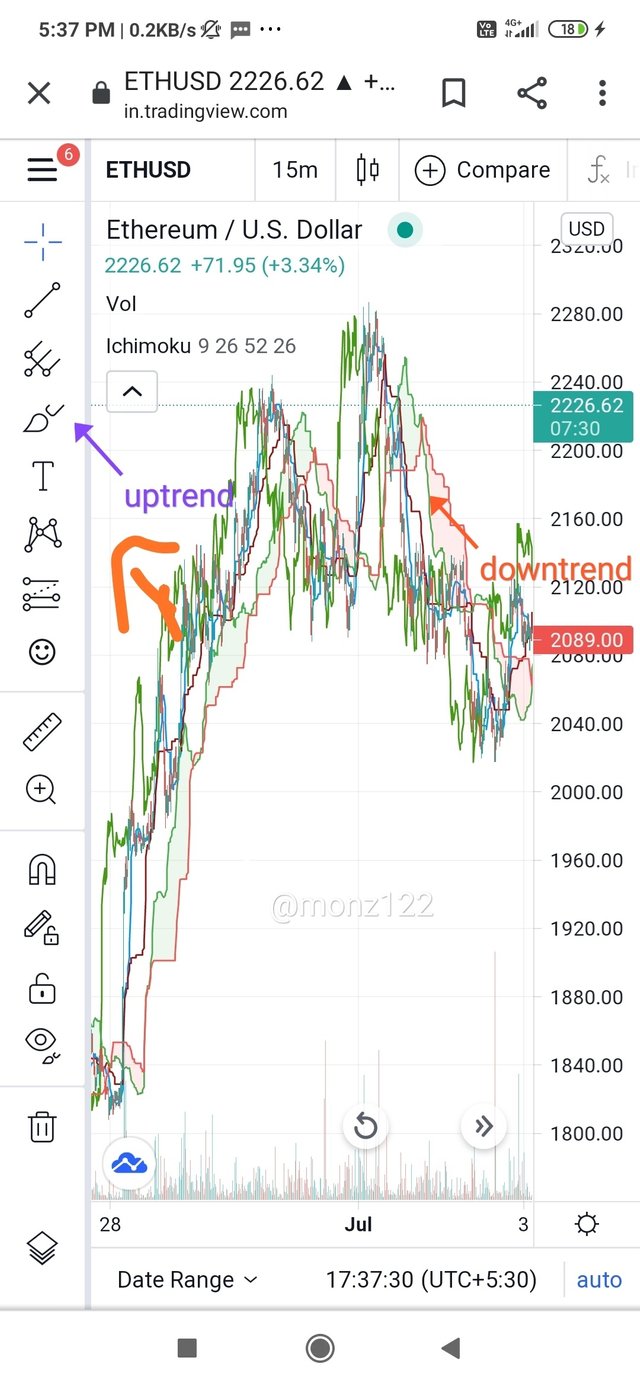
Upward and downward trends in the chart
4 (a ) Chikou span line:
It can be defined as a lagging indicator component and is not based on the highest or lowest price of a certain period ...
It also helps the traders with visualisation of the relationship between current and prior trends ..
It also helps in determination of the trend and providing support ..
How to use Chikou span line
Chikou Span line can be helps in determining the trends in 2 ways:
When its below the price is below the price line a bearish trend is depicted ...
And when it is above the price line the opposite situation which is bullish trends takes place...
Strength of trend can be by looking at the lines of Chikou Span line ...
Why Chikou Span line is always neglected ?
As sometimes false signal is leaded by this line which sometimes create troubles for the traders leading them to the wrong path ....
Another big reason for neglecting this line is :
Sometimes the prices are already changed or starts moving in the direction of trends , Chikou Span line is neglected...

(5a) Best time frame to use Ichimoku indicator
The best time to use Ichimoku indicator for different traders vary like
•For intraday traders it is from 1 min to 6 hours
• Whereas Long-term traders can use it for a day to a week...
So accordingly we can also change the default setting and use it according to our needs and preferences...
(5b) Best indicator that can be used with Ichimoku indicator
According to me best Indicator which works perfectly with Ichimoku indicator is RSI fullform of which is Relative Strength Index..
As RSI shows both bullish and bearish and also the oversolds..
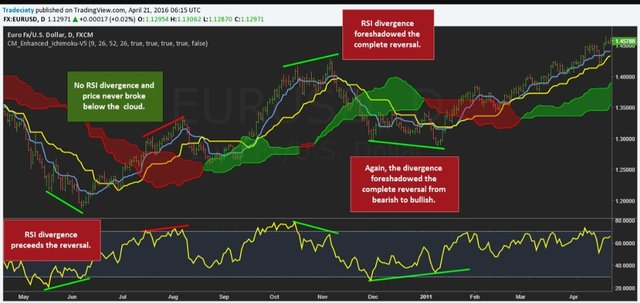
With the help of RSI it is possible to identify high probability reversals....
Conclusion
So coming to the conclusion about this indicator at times this can be the best indicator due to its accuracy and and the trader knowing the proper use of it will always rely ..
And from this task given by the professor I came to know more about this Indicator...
Leaving the matter of default setting else it is the best indicator I came to know...
Thankyou so much everyone for investing the time and reading it....
Note : The images above had been taken from #Tradingview.com
You have been upvoted by @sapwood, a Country Representative from INDIA. We are voting with the Steemit Community Curator @steemcurator07 account to support the newcomers coming into Steemit.
Engagement is essential to foster a sense of community. Therefore we would request our members to visit each other's post and make insightful comments.
Thank you