Introduction to the Principles of Crypto Analysis - Crypto Academy S4W7 - Homework Post for @imagen

Q1
What are the differences between Fundamental Analysis and Technical Analysis? Which one is used most often?
Fundamental Analysis
In cryptocurrency, we use fundamental analysis to analyze the relevant information surrounding a crypto project to determine it's intrinsic value. The goal is to determine if the crypto asset is overvalued or undervalued. After an assessment of a crypto asset a trader can determine if it ripe to invest due to the fact that the assets fair value may be undervalued.
In fundamental analysis for cryptocurrencies, there are various factors to consider, such includes:
1• On-Chain Metrics.
A trader evaluates the internal data provided by the Blockchain itself. Like the transaction count, fees paid, hash rate, transaction value, active addresses and more. These can be obtained using API service providers like the coin market cap.
2• Project Metrics.
With project metrics a trader considers how strong the project is, the need it fills in the world, the team behind the project, the competitors. Much of these can be obtained through the projects white paper.
3• Financial Metrics
This takes into account relevant market information of the asset, like it's market cap, volume, liquidity and more.
- In general fundamental analysis focuses on ascertaining the intrinsic value of an asset. It aides a trader take a decision on a long time investment.
TECHNICAL ANALYSIS
In Technical analysis we utilized technical indicators to asses price movement of a cryptocurrency. The concept of technical analysis stems from the believe that past recorded data of an asset can be used to determine it's future.
These possibility is made more sure due to market psychology which results to different market circles. Technical indicators are there to spot out this movements and help a trader reach entry and exit decsions.
- Because market movements and circles often repeat due to emotions prevalent in the market, technical analysis are done to determine possible movement using past historical data. Such analysis enables a trader take decision on entry and exit.
DIFFERENCES
1• While fundamental analysis focuses on on relevant information surrounding a project to ascertain it's potential, technical analysis uses former price movement and action to determine it's possible future movement.
2• fundamental analysis is broader, it encompasses using on-chain metrics, project metrics, and financial metrics whereas technical analysis is more succinct utilizing technical analysis indicators to determine spot trend, entry and exit positions.
3• The goal of fundamental analysis is obtain a fair value of the crypto project which guides a traders and lead him to a decisive conclusion on investing for a long time,(hodl) while technical analysis is best for shot time investment.
THE ONE USED MORE OFTEN
Technical analysis is used more often than fundamental analysis. The reason is because technical analysis is an easier approach analysis, giving a trader an opportunity to enter a trade and when to exit a trade. It is the approach used by day traders which makes it an analysis for regular use.
2.
Choose one of the following crypto assets and perform a Fundamental Analysis indicating the objective of the Project, Financial Metrics and On-Chain Metrics.
POLKADOT
Polkadot is a multi-chain network built for interoperability of Blockchains. With it's parachains and relay chains with network bridges, polkadot can solve the problem of interoperability and scalability.
Team behind polkadot
polkadot is an innovative blockchain project founded in 2016 by Dr. Gavin Wood a co-founder of the Ethereum blockchain. Dr. Wood is equally the inventor of the Solidity smart contract language. Other co-founders include Peter Czaban and Robert Harbermeier. Peter Czaban has quality experience in financial data, data analysis and machine learning being a graduate of Oxford University. Robert Harbermeir expertise is on decentralized network and cryptography. He happens to be among the members of "Rust programming community."
PROJECT OBJECTIVE AND USE CASE
Blockcahains sit in isolation, each one with it's own world of Blockchain without communication with other blockcahains. A vivid example can be observed among various networks, Tron txc for instance, is not compatible with Ethereum Blockchain and vice versa. Polkadot chose not to cue with the many competing for space but rather to bring the differing networks into one chain polkadot while at same time providing possibility for smart contracts and dapps to be launched on the chain.
The projects objectives are to make Blockchains interact with one another while providing a stable and secure environment for programmers to build and launch Dapps and smart contracts that is scalable.
The use case of polkadot has been in the above mentioned relevant usage namely, interoperability and scalability. The network is designed to be a place for smart contracts, DEFi projects, gaming projects and more just like Ethereum.
Polkadot vs Ethereum
One of the major rival of polkadot is Ethereum Blockchain. The very advantage of polkadot above Ethereum is scalability. Although Ethereum is transitioning to proof of stake consensus algorithm which will mean faster transaction time, polkadot might still be more scalable being a web 3.0 project.
Another advantage of polkadot over Etheruem is low transaction cost. Ethereum gas fees has been a problem for the Ethereum network. Polkadot low transaction cost is an added advantage.
POLKADOT DOT TOKEN.
dot is the native token of polkadot. It is a token for all the internal operation of the polkadot ecosystem. Activities like, staking, yield farming, transaction cost, community governance and more.
Financial Metrics of dot Token.
Dot token has risen from $40 - $45 as at yesterday.
Today's polkadot price is $44.00 USD .
The 24-hour trading volume of polkadot is $1,605,410,341 USD, this shows high liquidity . It is ranked #8 in coin market cap. This ranking places polkadot among the first 10 trending coin including Bitcoin and Ethereum. Polkadot has a market cap of $43,454,973,656 USD.
Circulating supply of dot coin is 987,579,315.

Exchanges to being traded
Binance, Huobi Global, OKEx, FTX, and Mandala Exchange and more.
Price movement in exchanges.

On chain metrics of polkadot.
Using polkadot block explorer, we can see the internal activities of Polkadot which shows it's internal health.
Number of holders = 959,409
Staked value = 709.567m
Transfers = 4,177, 112
Number of validators are 297 and the 297 are active.
Finalized blocks 7,386,476
See below image.

3.
Make a purchase from your verified account of at least 10 USD of the currency selected in the previous point. Describe the process. (Show Screenshots).
In this task I chose binance chain, to buy polkadot is simple.
I already have USDT. In this exercise I will buy dot token using USDT.
step 1• From binance app, I went to trades

step 2•
1: I Located "spot" trade
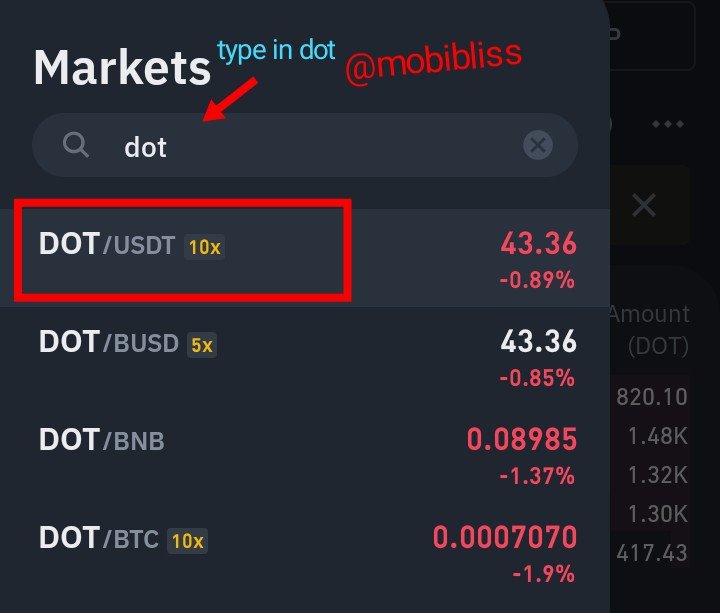
2: I selected the pair ( dotusdt)
See image below

Type in the coin name in the box.
Select dotusdt
3: choose "buy" option
4: choose "market" option for the transaction to complete immediately.
5: select the amount in percentage. I used 100%
because I want to spend the total 25 USDT.
6: click buy
See photo below

binance app image.
Thats all. See result below.

binance app image.
4.
Apply Fibonacci retracements to the previously selected asset with a 4 hour time frame on the platform of your choice. Observe the evolution of the price at 24 and 48 hours, did it go up or down in value? Look to identify resistance and support levels. (Show Screenshots at 0, 24 and 48 hours of purchase where the date and time are observed).
Dot bought on 22-10- 2021
Below is the screenshot

binance app image
Applied fabbonacci retracement

In the above image, the price of dot went down after the date of purchase.
The established support is at the pivot point and resistance is strong at the first line above the pivot. Price retraced after a breakout in the resistance line and now moving towards to retest support. There could be a strong bullish movement after the price text support line.
5
What are Bollinger Bands? How do they apply to Crypto Technical Analysis? With which other tool or indicator do you combine Bollinger Bands to analyze a Crypto? Justify your answer.
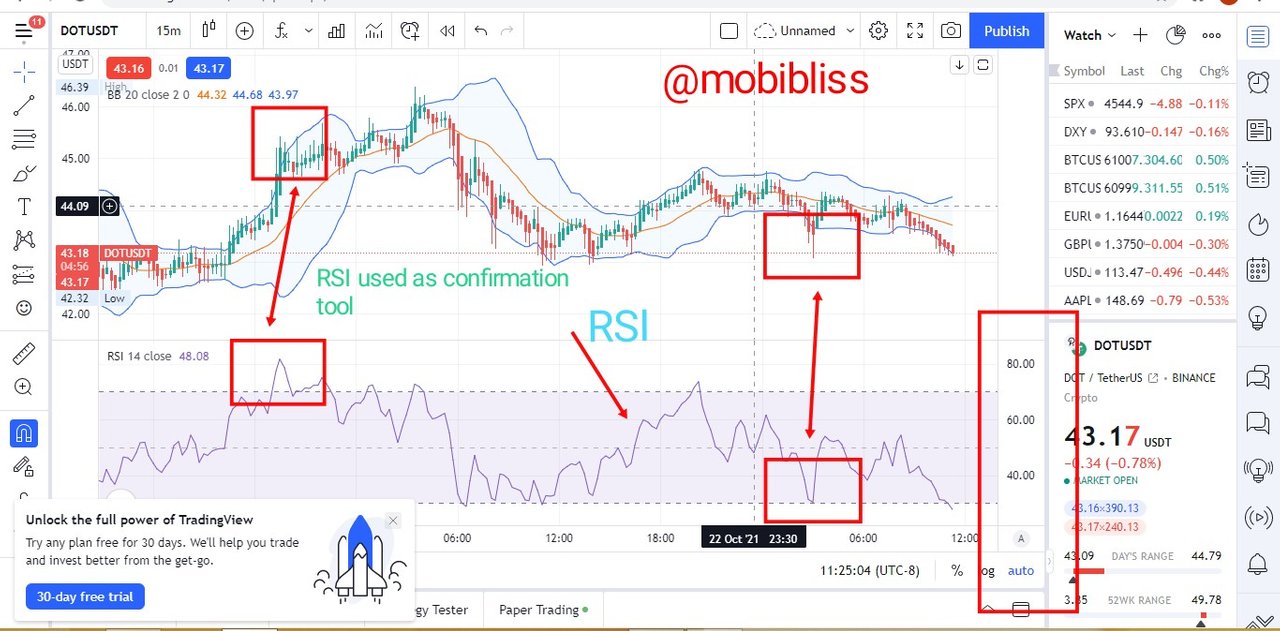
Bollinger bands are trend following indicators with three bands and shades. It is an indicator to spot out reversals and show an assets trend .
Components.
There are three bands of the Bollinger, upper band, middle band and lower bands.
There is equally a shade.

How It Works.
Using Bollinger Bands to determine trend.
When the lines of the Bollinger bands points upwards, it means an uptrend. When the bands of the Bollinger points downward, it means a downtrend.
When applied to a chart, the lines of the Bollinger expands on trending markets and on flat markets it contracts. Thus Bollinger bands can be used to spot out trend strength.
Using Bollinger Bands to spot out reversals.
When the price chart touch or broke out on the upper Bollinger bands it points out a possible reversal to the bearish.
When the price chart touch or broke the lower Bollinger, it points out to a bullish reversal.
Using Bollinger bands as support and resistance.
Upper band of the Bollinger can serve as resistance lines
The lower band of the Bollinger can serve as support.
The middle band can serve as either support or resistance depending on price movement.
When the price touches middle band more then two times and turn downward, the middle band serves as resistance. It is the support when the opposite is the case.
See below image.

Another Indicator to add to Bollinger Band.
A momentum indicator like the RSI can be a good option. Similar to bollinger, RSI can help spot out reversals by determining an asset's overbought or oversold positions.
It has a bounded percentage reading of 1-100.
Above 70% line of the RSI shows the asset is overbought and may reverse to the bearish.
Below 30% of the reading shows shows oversold position and a possible bullish turn.
Combining RSI with Bollinger can serve as complementary tools. RSI can confirm bollinger band signals.
See image below.
Conclusions.
Fundamental Analysis and technical analysis has there place in cryptocurrency trading. While fundamental analysis focuses on the the vital information surrounding crypto asset to determine it's fair value, technical analysis considers past price data in other to anticipate or predict it's future movement.
Fundamental Analysis are mostly considered for long term investment especially for traders that wish to HODl while technical analysis works for short term investment and is the most used.
Technical Indicator tools can be combined for better results.
Please @imagen, grade my post
Hello @imagen, this post is about to expire and has not been graded. Please do justice to this post, it is five days already
@pelon53
@sapwood