How to Trade Cryptocurrencies Profitably Using TD Sequential -Steemit Crypto Academy | S4W8 | Homework Post for @reddileep
1- Define TD Sequential Indicator in your own words.

TD is an indicator developed by Tom Demark. It is designed to spot out the exact time of trend exhaustion and also dictate trend reversal. The indicator is best suited for 4 hour timeframe or above, however, it can be adjusted to suit lower timeframes. The TD works better on trending markets but performs poorly on flat markets. The indicator is designed to work on candlestick patterns or bars chart patterns.
The indicator plots numeric figures on top or below a candlestick. On an uptrend, the TD figures are plotted above the candlestick chart and on a downtrend the figures are plotted below. Those numeric figures usually from 1 -9 or up to 13 figures identify a build up to a possible reversal. A trader can see as a signal when the indicator plots up to number
8 or 9 figure on top or below of a candle stick and at other times up to thirteen (13) which is a more stronger signal.
Another feature is the support and resistance lines known as the tdst.
HOW TD INDICATOR WORKS.
There are three components of the TD indicator.
1• The setup phase
2• The countdown phase and
3• The TDST
The Setup Phase.
Once there occurs a price flip on an established trend of an asset's price chart, the TD indicator plots numbers in ascending order, beginning with 1 and hoping to get to 9. The numbers are plotted when the candle manages to close higher or lower 4 candles prior to the present candle. Once the numbers gets to 9 consecutively without interruption, it signals a reversal. However, once an interruption occurs, the setup is aborted and will start all over again.
The Countdown Phase.
The countdown phase begins after the setup phase has been established and the 9 count is
completed. The countdown is additional figures after the nine count and it aims to reach number 13. One notable difference is that the countdown phase is plotted when the current candle close above or below two candles prior to it as against 4 in the setup phase. Another difference is that the countdown phase is not aborted when the sequence is interrupted, it continues the count when the sequence is restored. When the number 13 appears, it is considered a more stronger signal than the setup phase.
TDST
The tdst is a simple support and resistance lines of the indicator.
2- Explain the Psychology behind TD Sequential. (Screenshots required)
Just as I have pointed above, the TD indicator hopes to spot out trend exhaustion and possible reversal.
When the TD sequence is completed, a strong reversal is possible. When the TD sequence is interrupted, the reversal may be shallow.
When the TD reversal is happening within the support or resistance areas, it gives more confidence.
The psychology of the setup phase, as I mentioned above is that when the movement of the sequence of increase or decrease of an asset price is reduce, it indicates a trend exhaustion and points to a possible reversal. If the setup phase sequence completed the required number (9) consecutively without interruption before the asset price flip, it indicates a strong reversal signal.
Such can be said of the countdown phase which calculates possible reversal when price close above or below 2 candles prior to the present.
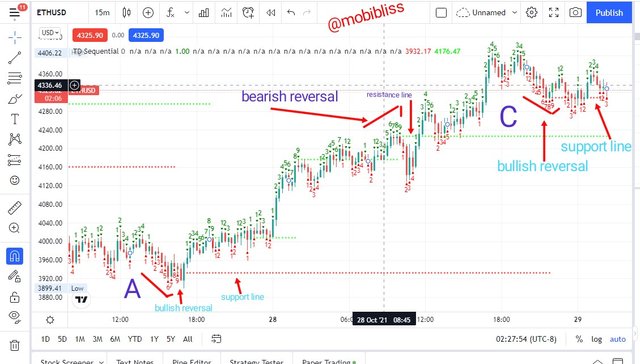
See fig. 1 below.
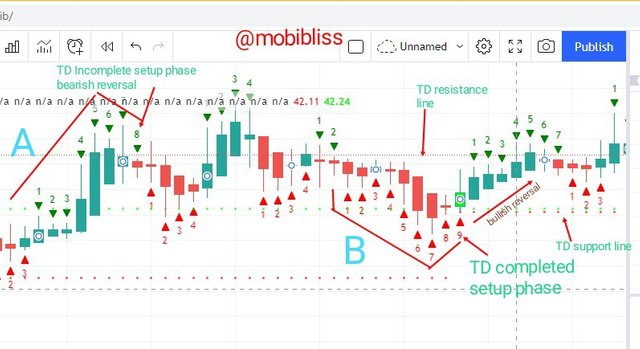
fig 1. TD setup phase. tradingview
••
In the fig. above, the area marked A points to an incompleted TD setup phase. The accompanying reversal was shallow.
The area marked B shows a completed setup phase and a good reversal happened afterward.
Notice too that the reversal at point B occured within the support and resistance lines.
Notice again that in each case, an interruption or completion of the TD sequence points to trend exhaustion. In each case, reversal happened. The difference in the two ( sequence completion or interruption) is the strength of the accompanying reversal. Notice that a longer reversal was the case in area marked B and was not the case in A.
3- Explain the TD Setup during a bullish and a bearish market. (Screenshots required)
BULLISH TD SETUP.
A bullish TD setup is initiated when the TD numeric figure is plotted above a candlestick chart. The number 1 is plotted when the the candlestick closes above 4 previous candles. The number 2 is plotted when the candle closes above 4 previous candles and so is the third and so on.
From a user's point of view as indicated in the figure below, numeric figures beginning from (1) is seen above green candles. The setup is considered completed when the numeric sequence completes up to number 9.
See fig 2
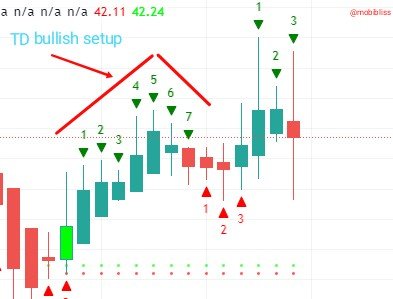
fig 2. bullish TD setup. tradingview
A completed setup points to trend reversal.
BEARISH TD SETUP.
Bearish setup is similar to the bullish formation but happening in the opposite direction. TD indicator setup plots numbers below the candlestick beginning from number 1 aiming to complete number 9. A number is noticed below a candlestick if the candle close below previous four candles. The figure 2 is plotted same way, and 3 and so forth aiming to get to figure 9.
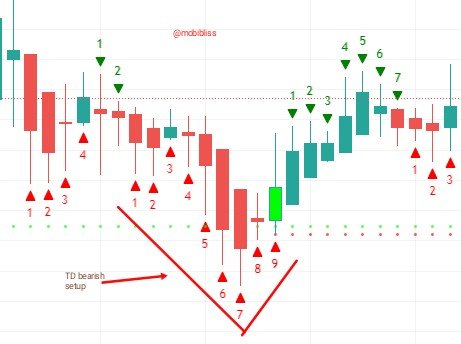
fig. 3. bearish setup.tradingview
From an observer's point of view , numeric figures are seen in sequence, in ascending order, beginning with 1 and aiming at 9.
4- Graphically explain how to identify a trend reversal using TD Sequential Indicator in a chart. (Screenshots required)
Using TD sequence indicator, a trader hope to see reversal at the completion of the count 9 of the setup phase of the indicator.
See below image.
Another reversal can be seen when TD sequence indicator countdown phase gets to 13. Although this seldom comes, it is seen as a stronger signal.
TD setup sequence count when completed around TDST - support or resistance lines, is considered a better reversal.
See image below.
As observed in the image above, marked area reversals happened at the completion of the TD setup and within support and resistance lines (TDST lines).
Criteria for Trading on bullish reversal.
- TD setup phase should complete the count 8 or 9.
- The reversal should be within the TDST lines ( support and resistance lines)
- Wait for the next green candle and enter trade after it's close on the bullish move.
- Place stop loss below the support line and take profit before resistance lines.
or use 1:1 profit-reward ratio.
Criteria for Trading on TD Bearish reversal.
- TD setup phase should complete up to 8 or 9 count.
- The reversal should be within the TD resistance lines.
- Enter trade after the first red candle.
- Place stop loss above the resistance line and take profit before support levels.
Use 1:1 profit reward ratio on TD sequence.
5- Using the knowledge gained from previous lessons, do a better Technical Analysis combining TD Sequential Indicator and make a real purchase of a coin at a point in which TD 9 or 8 count occurs. Then sell it before the next resistance line. (You should demonstrate all the relevant details including entry point, exit point, resistance lines, support lines or any other trading pattern such as Double bottom, Falling wedge and Inverse Head and Shoulders patterns.)
On this topic our focus is on trading reversals using TD indicator. With good study, TD indicator may seem a complete indicator if we pay attention to the TDSt- support and resistance lines. Therefore TD alone is like trading with two indicators at a time.
In the previous subtopic, I have explained criteria to buy or sell using TD sequence indicator. Here I will demonstrate a trade meeting up with those criteria.
ANALYSIS.
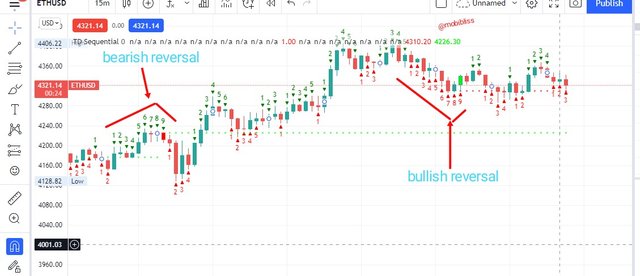
In the ETHUSDT chart below, certain factors where considered in the analysis.
1: sharkfin pattern.
Sharkfin pattern is a chart pattern formation resembling a sharkfin above water level. It comes in a format of an inverted V in a bearish reversal and a V formation in a bullish reversal.
Criteria for Trading sharkfin.
As a summary, these conditions need to be met for for trading sharkfin.
1: There should be an established trend. ( down or up)
2: price should sharply reverse - an ongoing trend and a sharp reversal forming a v or inverted V shape.
3: trade need to be entered when the V or inverted V is fully formed.
In the chart below, these criteria are met at point B. There was an established downtrend. We saw as price fall below the tdst support line and fall back up above support forming a v shape. point C shows TDST support line.
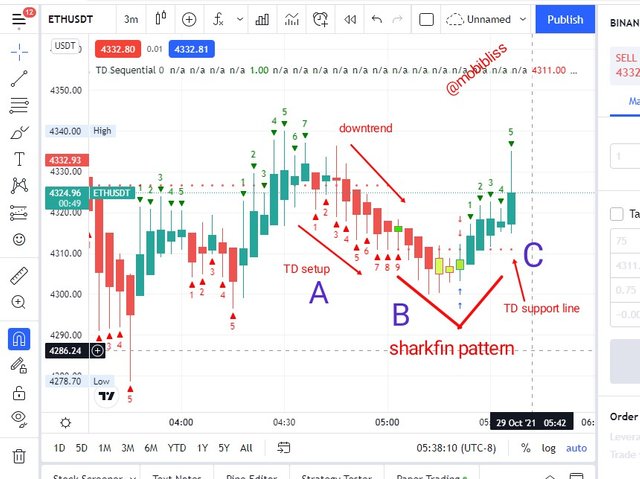
2: TDST LINE.
This is another thing considered in the analysis. Ordinarily, we enter trade at support and sell at resistance. TD indicator saves us the stress of drawing support and resistance lines- it is drawn by the indicator.
As I mentioned in previous subtopic, when TD reversal occurred within these support and resistance lines, a trader will be more confident to enter the trade.
3: TD setup.
As indicated above, the TD setup count is completed.
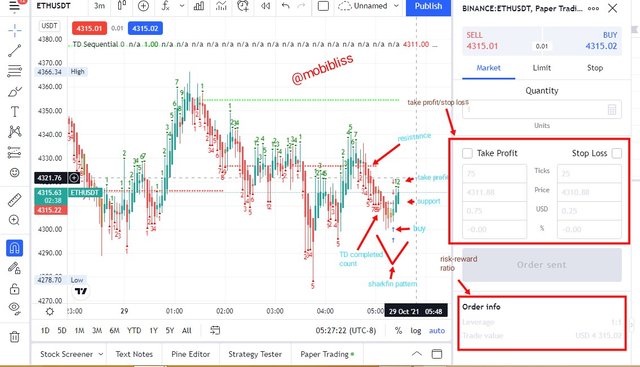
Trading Using above analysis.
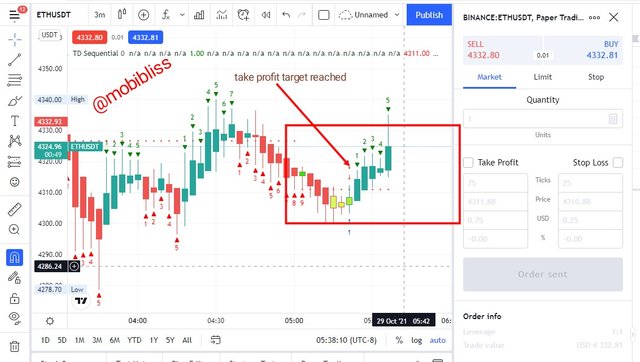
In the image below, I have indicated my entry and exit. I used a based setup of tradingview stoploss and take profit.
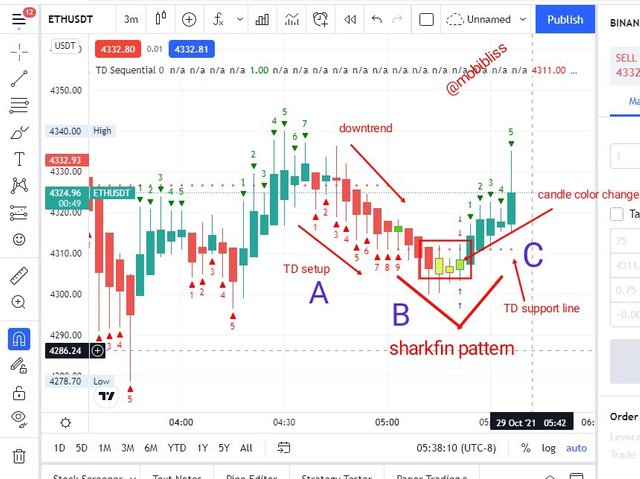
Why I entered the trade before allowing the sharkfin to fully form.
1: TD count has completed and three more candles has emerged afterwards.
2: The price has broken resistance and trading below gives me a better position.
3: there is option to re- enter trade when the price falls back within the support line.
4:Based on the configuration I use, when the heikin ashi candles changes to light green color different from the usual blue and red colors after TD completing count, it shows a strong reversal indication.
Please see image below.
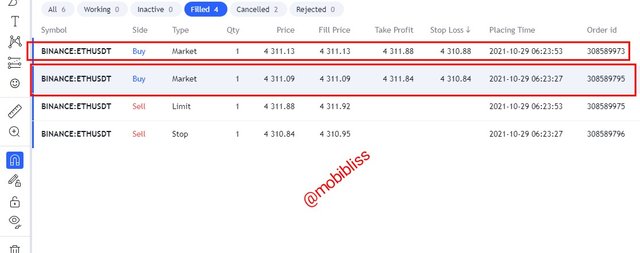
After the trade, we made profit.
See below.
CONCLUSION.
TD sequence is a good indicator for identifying reversals. It works well on trending markets.
It can be applied to any timeframe.
Just like other indicators, it performs better when combined with other indicators.
Image sources:
tradingview
#club5050 😀