CRYPTOACADEMY SEASON 3/ WEEK 4/#ASAJ-S3WEEK4/TRADING WITH CCI
It has indeed been a wonderful training and lecture by professor @AsaJ. Once again you have demonstrated a good example in teaching. I now have a better understanding of the indicator CCI . The lessons are well understood and they are straight to the point. Thank you very much.

TRADING WITH CCI INDICATOR.
WHAT IS CCI INDiCATOR
CCI is the acronym of the word "commodity channel index." It was introduced in 1980 by Donald Lambert and has been used by traders to trade stocks, equities, currency pairs and also our loved crptocurrency.
CCI falls within the category of momentum oscillator indicators. The main purpose is to generate signals for buy or sell. The indicator is developed for longer timeframe but traders has adapted it to shorter time frames. The indicator oscillates above and below a central point 0. When the indictor reads +100,it is an indication that the asset is overbought and hence a "sell" signal. Conversely, when the oscillator reads -100, it means the asset is oversold and therefore a "buy" signal.
With CCI traders can identify reversals in trending markets. It is equally used to determine trend strength and it's extremes.
CCI just like every other momentum indicators is best used when combined with other indicators.
In this homework task. I will demonstrate how to trade using CCI. I will use CCI to find the entry and exit positions. I will show another indicator that could be used with the CCI. Let us begin by choosing our currency pairs, adding it to our demo account.
- Demo account(broker). paper trading.
EXPECTATIONS OF THE HOMEWORK TASK:
- 1: To open a demo account on any trading broker and select five cryptocurrency pairs
- 2: To create a market entry and exit strategy
- 3: To use the signals of the Commodity Channel Index (CCI) to buy and sell the coins you have selected
- 4: To declare your profit or loss
- 5: To explain your trade management technique
OPENING A PAPER TRADING ACCOUNT.
Paper trading In tradingview.com is just another word for saying a demo trading in tradingview.com. In paper trading a trader has to practice trading with virtual currency and not real money. It has similar function as as the real market, the difference is that no risk is involved, since it is not actual money. Demo account allows one to have a text of the markets without spending money. It allows the trader to practice and master the markets before jumping into the real business.
Here in this exercise, I will indicate how to open a tradingview.com account and how to add paper trading to it. Thereafter,. I will select five cryptocurrency asset pairs to trade with.
OPENING ACCOUNT WITH TRADINGVIEW.COM
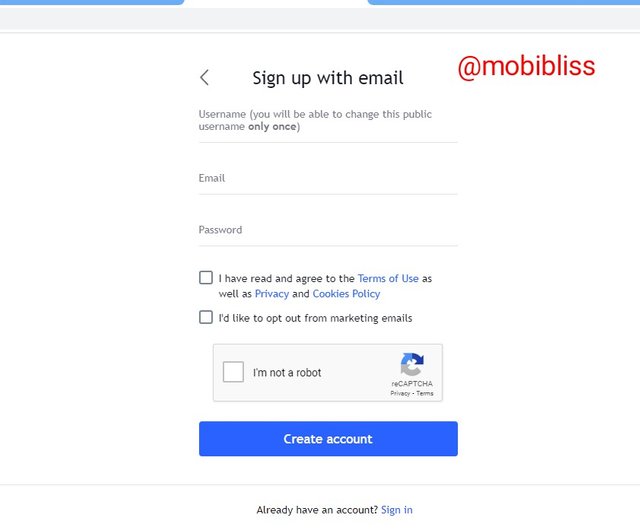
Go to tradingview.com and signups. You will be asked to input your details.
Fig 1:
 .
.
You will b asked to confirm your email and choose a username. Once done you can login using your mail and password.
ADDING PAPER TRDING IN FEW STEPS
Once signed in to tradingview.com, simply choose a currency pairs. Right click in the center of the chart and select trade.
Fig 1:2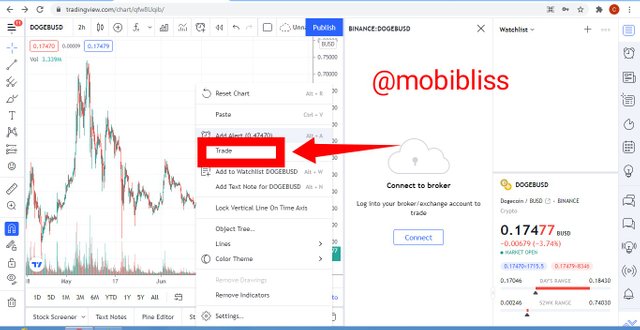
You will be asked to connect to a broker.
Fig 1:3
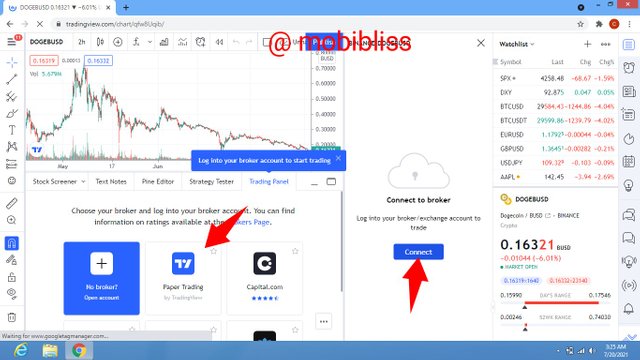
Choose paper trading as indicated in the fig 1:3.
The "buy" and "sell" button will appear indicting that you have properly added paper trading.
Now let's select our five crypto pairs:
Fig 2:1
2:2
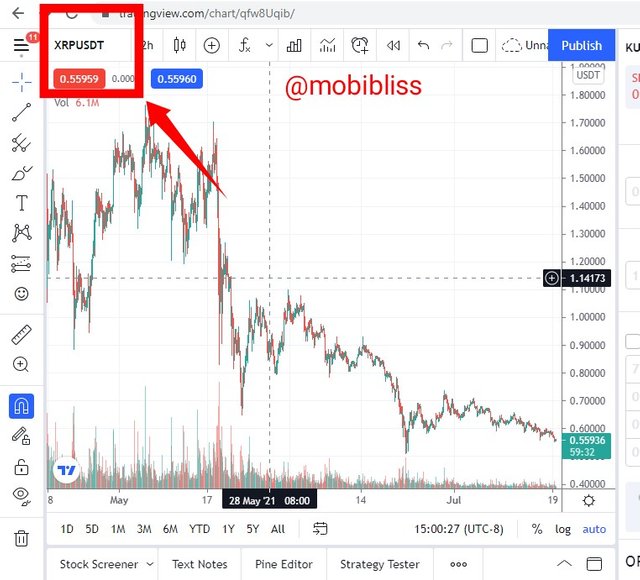
Fig 2:3
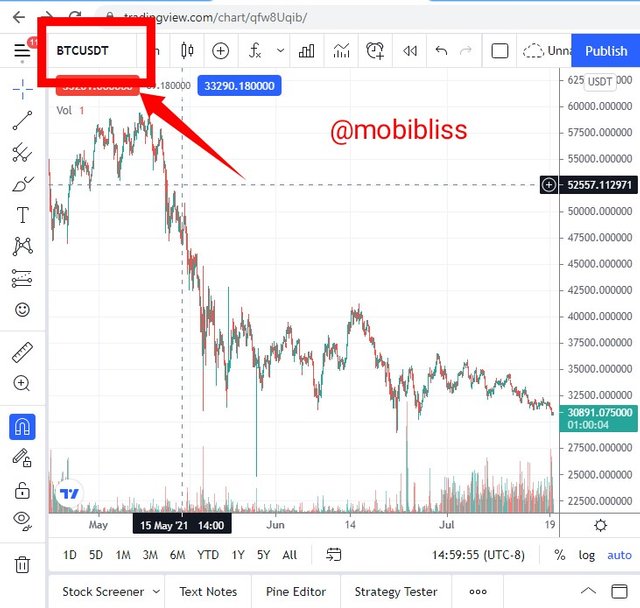
Fig 2:4
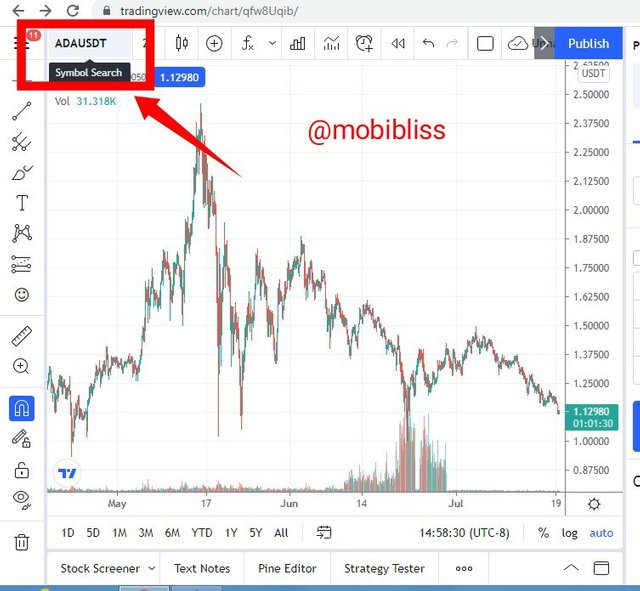
Fig 2:5
ENTRY AND EXIT STRATEGY.
Before entering the markets, one need to have a defined mapped out plan of entry and exit. Sticking to this plan will help for profitability.
To have a good entry and exit plan,one need to ensure that the signal gotten from the indicator is reliable. In this case, we are using CCI. Moreover no indicator is perfect, that is why combining two or more indicators are often advised. This will ensure that we enter the market at the best possible opportunity and exit where necessary.
Setting up this strategy.
I will be adding two indicators, namely: 150 period SMA ( simple moving average)and Bollinger bands to CCI to form this strategy. The moving average will help us to confirm the trend. The Bollinger bands will help as an easy tool to identify our support and resistance, establishing where there could be possible reversals. The CCI will further confirm our overbought and oversold positions. It will help confirm strong reversals in Bollinger bands signal. This procedure is simply and easy to use. It can be applied in long timeframe. However, it works well for short time frames too. I use it in option crypto trade and it is effective. However this is not a strategy advice. It needs to be mastered for greater profitability.
I am going to apply this strategy to a chart and show how it could be used. In the next chapter, I will demonstrate trading using this method.
Fig 3.
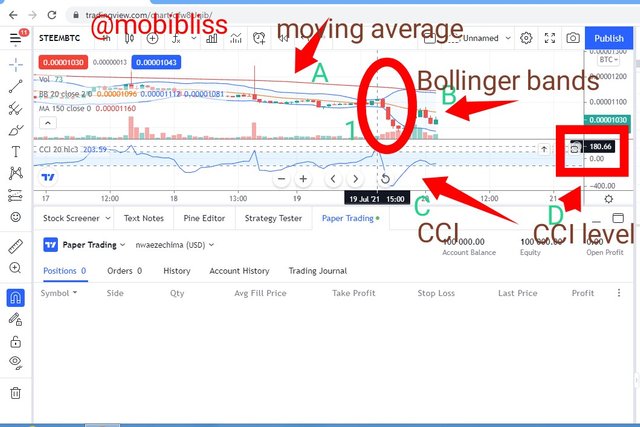
Point A shows our moving average.
Piont B shows our Bollinger bands.
Piont C shows our CCI.
Piont D shows CCI level
APPLICATION
Point A The moving average is above the candlestick chart. When the moving average is above the candlestick chart, it indicates a downtrend; when the moving average is below the candle stick chart, it indicates an uptrend.
Point B, we saw a long down movement of the candlestick from the upper band to the lower band in the circled area. The red candles crossed the lower band of the bollinger. When such happen, it is good sign of reversal. In this
case, we see possibility that the chart will turn up. When the candle stick touches or crosses the lower Bollinger, it is an indication of oversold position and a buy signal; when the candlestick touches or crosses the upper Bollinger, it indicates oversold position and a sell signal.
Point D the CCI shows -171, confirming the Bollinger bands oversold position signal.
Combining all the signals gives us a strong "buy" signal.
Conversely, "sell" signal is sent when all these criteria is satisfied in the opposite direction.
Determining areas of support and resistance
This is very important using this strategy. Bollinger bands saves us the pain of doing the work. We do not need to draw resistance and support lines. The upper, middle and lower lines of the Bollinger serves as such and market charts respects that. So we simply need to see where the reversals mostly occur, is it the upper or middle in "buy" signals or the lower or middle in "sell" signals?
Adding stop loss and take profit
In this instance, Adding take profit should be before resistance. As I mentioned earlier, our upper bands or middle bands can serve as resistance levels. Stop loss should be placed below support which our lower bands of the Bollinger can serve as.
Summary
I enter the market when all criteria above has been satisfied. I exit the market little before the resistance. The reason is because market may take an opposite turn without reaching intending resistance and support areas, therefore I choose not to be greedy.
APPLYING CCI TO TRADING.
The goal is to know if the above formula actually works. How good is the CCI indicator signal?
Let us use the crypto pairs selected above.
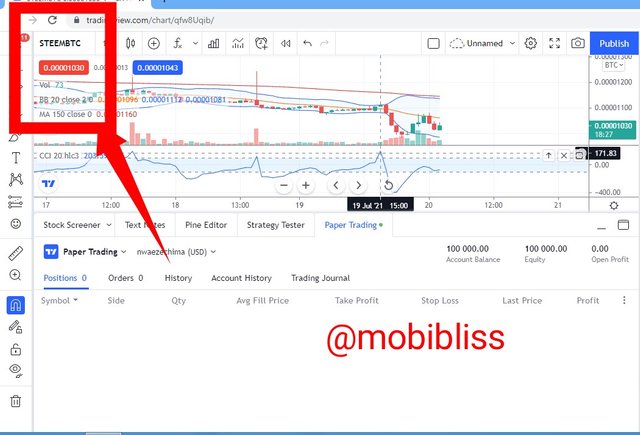
Fig 4:1
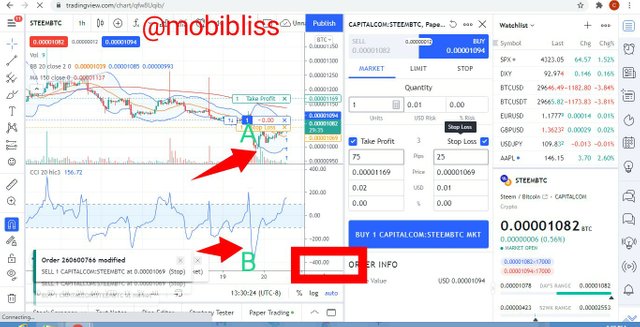
Image 4:1 is a trade taken on STEEMBTC pair. At point A, we saw a clear "buy" signal on the Bollinger lower band which had a breakout from support.
At point B our CCI is about - 400, a strong overbought area, confirming the signal on the Bollinger bands that we have a strong "buy" signal.
Fig 4:2
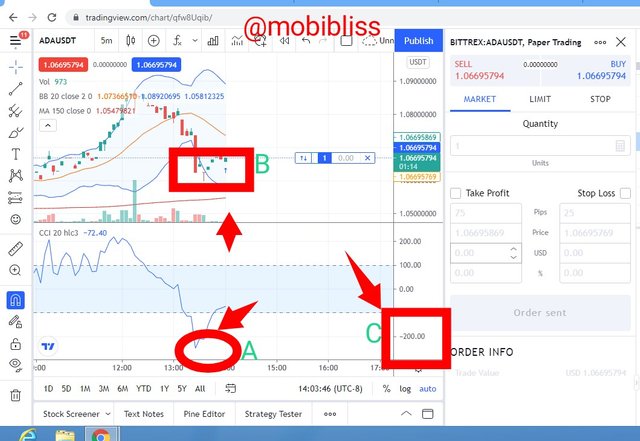
Fig 4:2 is ADAUSDT pair, at point A, we see our CCI indicator giving us a "buy" signal. It is -200 and at point B we see a breakout occurring at the lower Bollinger. The harmer candle serves as another indicator to show reversal. We took "buy".
Fig 4:3
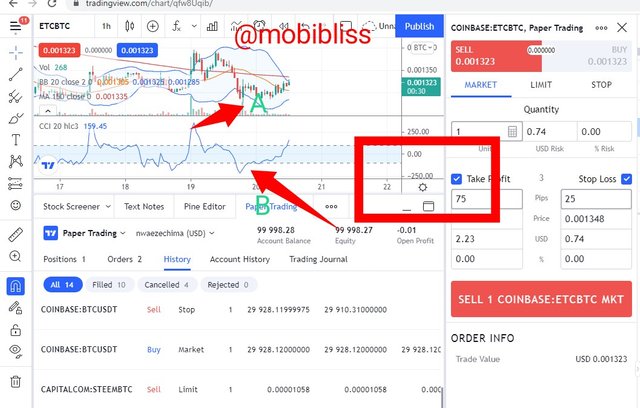
Etcbtc pair, CCI at -250 sends a "buy" signal at point B, it is confirmed by the Bollinger bands at point A.
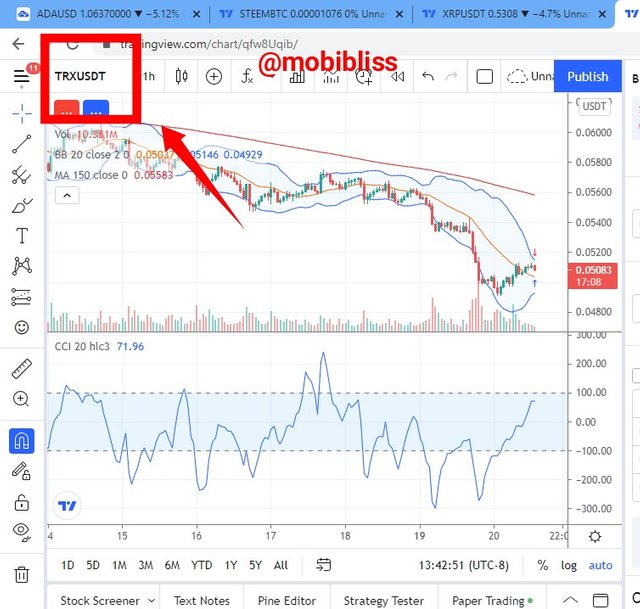
Fig 4:4
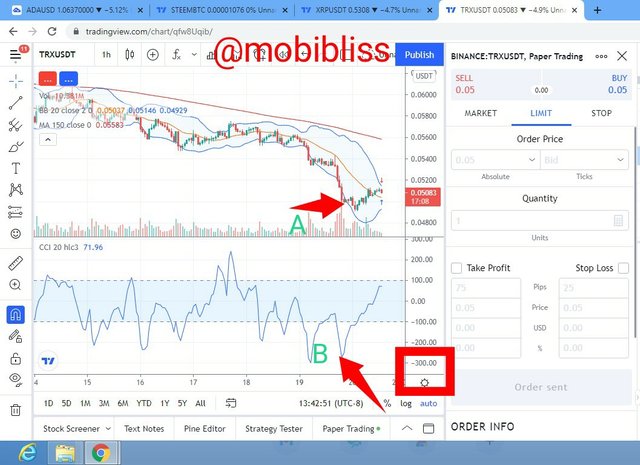
At TRXUSDT pair, we have a buy signal at CCI -300 point B futher confirm by Bollinger bands at point A
Fig 4:5
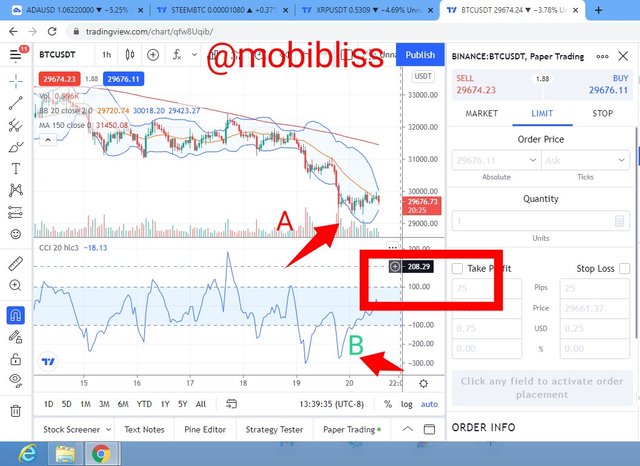
At BTCUSDT pair, we have a buy signal at CCI -208 at point B and confirmed by the Bollinger bands at point B.
DECLARING PROFIT OR LOSS
Although some trades were taken late, yet all the trades are on profit. That is a good sign. It confirms the potential of the CCI.
TRADE MANAGEMENT TECHNIQUE
Trade management has to do with how to manage risk in a trade. As there are high potential of profits in crypto markets so also there are high potential of losses. A good risk management technique is important for one to always be on a consistent profit.
As I pointed out above, the first thing I do is to manage my emotions. Greed is a strong emotional bias. I try to avoid greed,so I prefer small profits than huge profit margins, so that when market goes against my prediction, it will not affect my account adversely.
Secondly I use stop loss. As shown on the trades above, the ratio is 1:3. The stop loss is set at 25 pips, the take profit is set at 75 pip.
Another thing I endeavour to add is trailing loss stop. This is so that the profits made will not be lost when the market turns the opposite direction without reaching the intended take profit mark.
Lastly, as a beginner I do not over trade. I take only 5 trades in a day and despite how promising the market on that trading day appears to be, I stick to this set goal.
CONCLUSION.
CCI is a good indicator; when combined with other indicators like the Bollinger bands it is made more powerful. Yet, no indicator or set of indicators are 100% accurate.
It is best to practice with demo accounts before entering the real markets. Paper trading on tradingview.com is one such account. It is easy to create and it imitates the real markets.
Risk management can not be overlooked. How profitable we tend to be in a trade is largely determined by our trading psychology.
Nice Explanation from you. you give well detailed post for entry and Exit positions ising CCI4.
Thanks for sharing is.
Thank you very much for reading through
Good job @mobibliss!
Thanks for performing the above task in the fourth week of Steemit Crypto Academy Season 3. The time and effort put into this work is appreciated. Hence, you have scored 8 out of 10. Here are the details:
Remarks:
This is another good work from you Chimaobi. You have displayed a clear understanding of the topic. This would have been a perfect work if you had declared the profit or loss you made from the five coins you selected.
Anyway, your mode of delivery has compensated. Thanks for sharing your trade management technique with us.