CRYPTOACADEMY BEGINNER TASK/ SEASON 3 WEEK 7/ STOCHASTIC OSCILLATOR AND PARABOLIC SAR/lenonmc21

INTRODUCTION
I am glad to participate in week 7 of season 3 of steemit cryptoacademy. In this post I will be discussing two technical indicators; the #sochastic oscillator and the #parabolic sar.
Technical indicators are tools used in performing technical analysis of a tradable asset. These indicators when applied to an asset chart are used to determine possible movement of the said asset. The indicators make use of past history of the price variance of the said asset and link it to the present state and with the result determines possible movement in price and trend of the asset.
This may seem weird, however it happens. Traders expresses certain sentiments and emotions at the point of trade. The state of mind of an individual trader while trading forms his trading psychology; the combination of all different traders psychology results to market psychology, which forms different market circles. These circles tends to repeat itself. Yes, it does, because traders has proven to express fear and greed and other biases, market circle forms at different phases over a time period. Indicators helps us to determine the sentiments expressed in the markets. For example, Are there buy or sell pressure? Which party seems to be winning, the buyers or sellers? From the past records which people will likely win in this phase of the market? From the past records when should trade be entered and when is it right to exit?. Good indicators will help us get these answers. However no indicator is a prophet, no indicators is 100% accurate. Therefore traders combine two or more indicators for better results.
You may have heard of various indicators. Some serve well in identifying trends; others are good in finding entry and exit positions. Now let's discuss the two indicators mentioned above. We are going to look into it's components, then we will find out how they work and how to apply them to a chart. Then lastly we will see the benefit of combining the both indicators and how to trade with it.
Question 1

SOCHASTIC OSCILLATOR.

WHAT IS SOCHASTIC OSCILLATOR?
Sochastic oscillator is a momentum indicator that takes the closing price of an asset and compares it with the ranges of the price of that asset over a chosen period of time. Sochastic oscillator consists of lines of %k and %d that swings between two horizontal drawn lines indicating overbought and oversold positions.
Being a momentum indicator, sochastic oscillator measures the rate of speed to which price of an asset moves over a given period. The concept is drawn from the believe that the momentum of an asset price must change before the actual price changes. Hence the oscillator can be used to identify possible reversals.
This indicator was developed in the 1950s by a notable trader George Lane with the intent of finding a turning point in the prices of stocks. However, his work has been applied to many securities over the years including cryptocurrencies. It has a reading ranging from 0 - 100. The price is considered in overbought area when it has moved above 80% reading of the sochastic oscillator. Conversely, the price is considered in the oversold area when it has gone below 20% reading of the oversold drawn line.
The standard timeframe setting suggested by the inventor George Lane is 14 days period. This setting is adjustable according to the need of a trader. Scalping traders works with shorter timeframe, hence adjusting the period to suit one's style may be required.
Question 2

COMPONENTS OF SOCHASTIC OSCILLATOR.
Well, let's say that there are four components of the sochastic oscillator.
- The fast oscillating line %k
- The slow oscillator line %d
- The upper horizontal drawn line overbought area
- The lower horizontal drawn line oversold area
%K
This is the fast line of the oscillator. In most charts, it is often set to green colour. However a user can set to a preferred colour.
%k line is gotten by getting the recent closing price of the asset, then subtracting the lowest price within the chosen time period from it; dividing it with the lowest price within the time period subtracted from the highest price and multiple by 100.
First and foremost, we need to get the time period. Let's say we are using the standard time period, the period of 14. %k will equal.
%k = recent closing price - lowest price within 14 days/ highest price within 14 days - lowest price within 14 days × 100.
Take for example, as a case study, let's say that the current closing price of cardano coin ADA is $6, all time high within 14 days is $7, all time low is $5, therefore %k will mean
%k = $6 - $5 / $7-$5 × 100
%k = C - L14 / H14 -L14 × 100 ( formula)
C = closing price
H14 = highest price within the assets 14 days period
L14 = lowest price with the 14 days period.
%D
When applied to a chart,%d is often red in colour. It is the slower swinging line of the sochastic oscillator.
%d is gotten by getting the 3 period simple average of %k.
%D = 3 period ( SMA) of %k.
Overbought area
The upper horizontal drawn line shows overbought area. When the oscillator reaches and crosses this point it means that there is probability of the market turning to the opposite direction. This line is the 80% line, and when the price is above 80%, it is considered overbought.
Oversold area
When the oscillator passed the lower horizontal drawn line, it is considered oversold and a possible bullish movement. At this line the price is considered lower than 20%.
Question 3
WAYS TO USE SOCHASTIC OSCILLATOR
We have already pointed out above that when the oscillators reach and cross 80% overbought area, we will be expecting to "sell" since there is high expectancy of price fall and vice versa. However a "buy" or "sell" signal is not sent at the moment when the oscillators reach the overbought or oversold areas.
Buy signal
A buy signal is sent when the blue (%k) and red line (%d) of the sochastic oscillator intercept within the oversold area. The cross of the %k line and the %d line triggers a buy signal.
Sell signal
A sell signal is sent when the %k line intercept with the %d line within the overbought area.
Bullish divergence/ sell signal
A divergence occurs when the sochastic oscillator signal is not in agreement with the price chart. For example, a bullish divergence occurs when the price chart is showing a higher high while the sochastic is showing a lower high. It means that the selling pressure is higher than the buying pressure and therefore a downward movement is about.
Bearish divergence/ buy signal
Bearish divergence is the same as the bullish but happening in the opposite direction. The chart shows a higher low while the indicator shows a lower low. Hence a buy signal.
PARABOLIC SAR
WHAT IS PARABOLIC SAR?
When added to a chart, parabolic sar appears as a doted line that follows the movement of the price chart of a security. The sar is an acronym of the words "stop and reverse". Which means that the indicator aims to identify trend and price reversal in a moving trend.
Parabolic sar was developed by J. Welles Wilder Jr., the developer of RSI indicator. The main aim of the indicator is to determine the trend and show possible reversal points in a trending market. It is equally a good tool to establish entry and exit point.
The indicator works as a trailing stop. It follows the momentum of the asset price then stops and flip to the opposite direction when the asset price changes. A trader can therefore make an entry following the flip and exit at the next flip. A trader can adjust his stop loss points as the indicator moves. These descriptions matches scalp trading, therefore the indicator best works for scalping and trending markets.
Question 5
WHAT THE PRICE MUST DO FOR THE PARABOLIC SAR TO CHANGE FROM BULLISH TO BEARISH AND VICE VERSA.
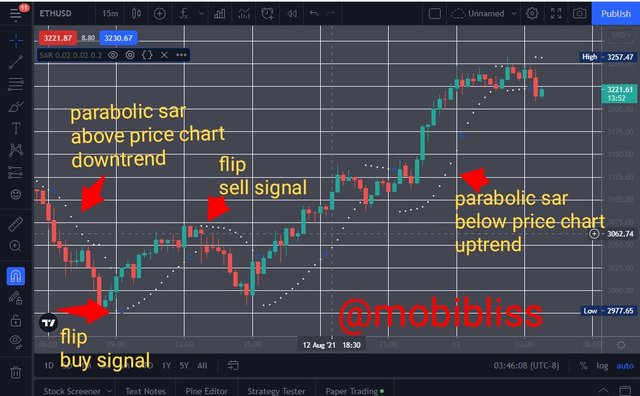
AS mentioned above, the parabolic sar when applied to a chart appears like a doted line following the movement of an asset price. These lines could be seen above a chart in the case of a downtrend and below the chart in the case of an uptrend. When the price changes direction,the parabolic sar flip to the other side and vice versa.
bullish trend
In bullish trend the dot of the parabolic sar is seen below the price chart. It continues with the trend provided the trend continues.
Conditions for bullish trend
- There is an established downward movement.
- The parabolic sar was above the price chart.
- The parabolic sar flip from above the chart to below the chart.
Bearish trend
In bearish trend, the parabolic sar is seen above the price chart.
Conditions for bearish trend
- An established upward movement.
- The parabolic sar was below the price chart
- The parabolic sar change from below the chart to above the chart.
What the price must do for the change to occur
The parabolic sar follows the speed at which the price of an asset moves. When the speed reduces the parabolic stops. If the movement of the price changes, the parabolic flip to the opposite side. It is similar to the idea of the sochastic oscillator, that the speed at which a price moves must reduce before the actual price changes. Hence the indicator dictates possible point of reversal.
Question 6
WAYS TO USE PARABOLIC SAR
IN A TRADE.
To trade with the parabolic sar, we need to use it to identify 1. buy signal 2. Sell signal.
Buy signal
When the parabolic sar is above the price chart and then flip below the the price chart, it is a buy signal.
Sell signal
When the parabolic sar is below the price chart and change to above the price chart, it is a sell signal.
Now let's see how to add our indicators.
PART TWO. PRACTICE SECTION
In this exercise, we will be making use of tradingview. We will show how to add the two indicators discussed above to a chart; we will thereafter show how to combine both of them to trade. Let's begin with the sochastic oscillator.
Question 1
HOW TO ADD SOCHASTIC OSCILLATOR TO A CHART.
To add a chart. Go to tradingview.com website. Click on chart. See fig 1.
Fig 1.
 image source
Goto the indicator button, it is identified as "fx" and at the top of the page. .see fig 2. Click on it. A box will appear. Type sochastic oscillator in the box, or you can goto built-in and then select the indicator.
Fig 2.
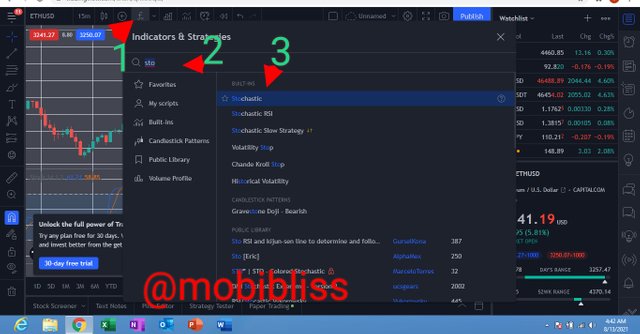
Fig 3. Shows our added indicator. Let's see how to set it up. Go to the settings side of the indicator. See fig 3. On the "input" button change to your preferred setting. Here I am using the default settings, period of 14. From the "style" you can change to choice colour of the indicator -The %k, %d. Set appearance to default.
Fig 3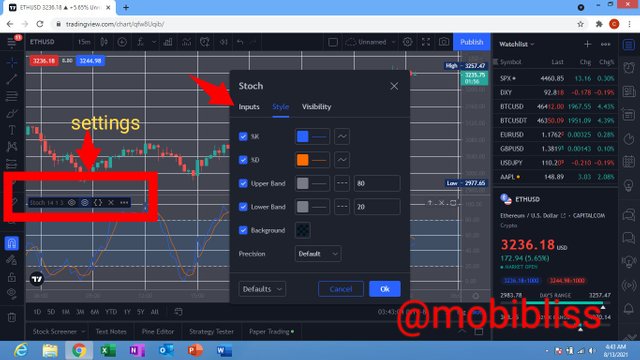
Please see the labelling of the indicator in fig 4.
Fig 4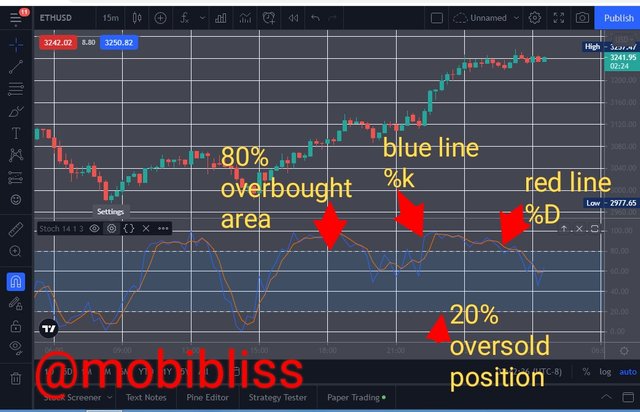
The blue line is our %k, the red line is our %d.
From the bottom, the first horizontal line is our 20% oversold area. And the top horizontal line of the indicator is our 80% overbought area.
Question 2
ADDING PARABOLIC SAR TO A CHART.
We will follow same procedure as with the stochastic .
From the indicator button, go to "built-in", scroll down to select parabolic sar. Or, type parabolic sar in the indicator box. See fig 5.
Fig 5.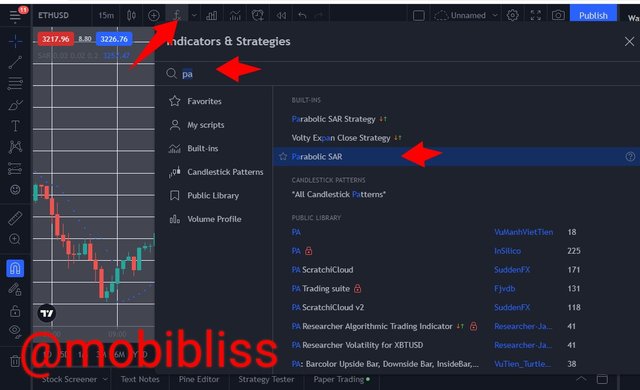
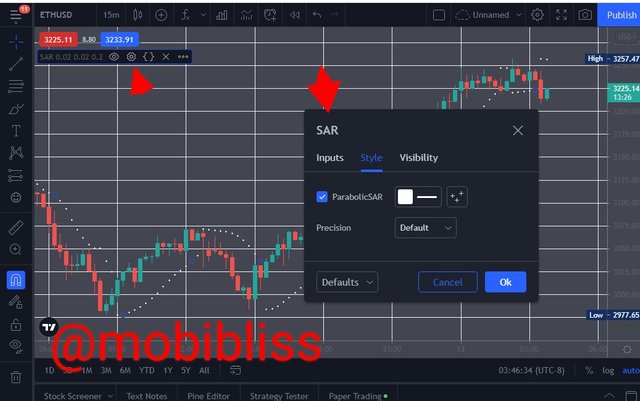
Now it is time to set it up. I use default settings.
Follow same procedure for Indicator setup. Set up the indicator as desired See fig 6.
Fig 6.
Now let's see the explanation of the parabolic in a chart. see fig 7.
Fig 7.
Question 3
HOW TO TRADE USING THE TWO INDICATORS.
Let's examine fig 8. The idea is that one indicator confirms the other.
Fig 8.
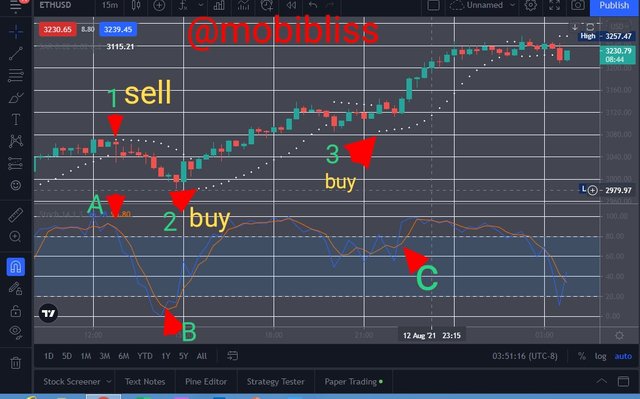
At point "1", a "sell" signal is sent by the parabolic sar. The parabolic has moved from below the chart to above the chart. it is confirmed by the stochastic oscillator at point A. The stochastic is at it's overbought position, and the crossing of the %k and %d confirms the action.
Point 2 and point 3 are buy signals sent be the parabolic sar, they are confirmed by the stochastic at point B and C. The parabolic sar moved from above the chart to below the chart
at both points 2 and 3. The sochastic oscillator is at it's overbought position and the crossing of the %k and %d confirmed the signal.
CONCLUSION
As discussed at the onset, technical indicators serve vital roles in predicting price movement.
There are no indicator that works 100%, therefore combining two or more indicators works well.
The stochastic oscillator and the parabolic sar are good combination. The both combined can give more reliable prediction.
NOTE: images are from my personal tradingview web template. image source
Please prof. @Lenonmc21, rate my post