Crypto Academy Season 3 (Week 2) - Homework Post for @reminiscence01 (Introduction to Charts)
On this occasion I will try to answer questions from the homework given by professor @reminiscence01, as for this week's class related to Introduction to Charts, well I will try to answer some of the questions given in this week's homework.
1. Explain the Japanese Candlestick Chart? (Chart screenshot required)
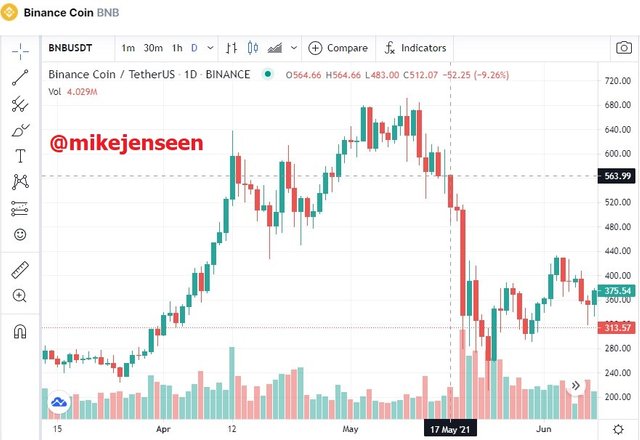
Japanese candlestick charts are very popular charts and are very often used by traders in technical analysis. on this graph there is a very complete description that can later be used to predict the price of a cryptocurrency in the future. or it can be said when traders have to enter and exit the trade, of course with the information provided by this chart is very helpful for traders.
as for there are several advantages of this Japanese candlestick chart we can find in the anatomy of this chart, in the anatomy of this chart there are some information on the candlestick, namely:
open: usually this section is located at the top or bottom of the candlestick body depending on the bullish candle or bearish candle. open is the initial price movement on a chart within a certain time.
close: usually this section is located at the top or bottom of the candlestick body depending on the bullish candle or bearish candle. close is always inversely proportional to open. is the last price movement on a chart in a certain time.
High: usually this section is above the body of the candlestick in the form of a vertical line, this is the highest price on a chart in a certain time
Low: usually this section is below the body of the candlestick in the form of a vertical line, this is the lowest price on a chart in a certain time
Parts of the anatomy of Japanese candlesticks are very useful for informing the trader when he should start trading. Japanese candlesticks also have colors on their bodies usually to distinguish between bullish candles and bearish candles.
2. Describe any other two types of charts? (Screenshot required)
Line Chart
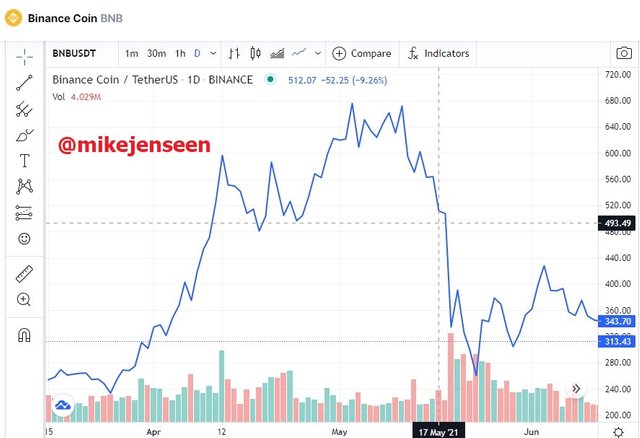
Line chart is a very standard chart and can be said to be a chartthat provides very little information than other chart. as for the line chart is just a line that forms a pattern that follows the increase or decrease of a cryptocurrency on the market. Line charts can be said to be very suitable for long-term investment and less suitable for trading. If long-term investments are used, users can study price movements from previous years to see the potential for a cryptocurrency to increase.
Bar Chart
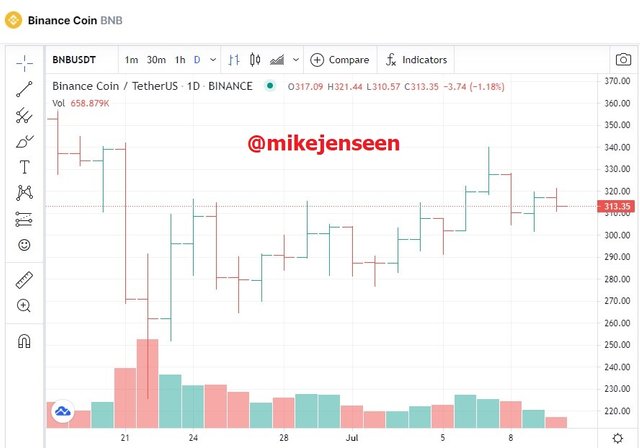
Bar Chart is a chart that has sections like candlesticks on a bar chart there are also open, close, high, and low sections but what distinguishes it is the shape of this chart, we can see the screenshot from coinmarketcap above that the chart chart is only horizontal and vertical lines , and has a different color between a bullish bar and a bearish bar.
3. In your own words, explain why the Japanese Candlestick chart is mostly used by traders.
There are several reasons why Japanese candlestick charts are widely used by traders, here I will try to mention some of the advantages of candlestick charts:
Candlestick charts have several components to provide information about the price movements of cryptocurrencies on the market.
Candlestick charts have an easy-to-understand interface for traders.
With candlestick charts traders can easily distinguish a bullish trend and a bearish trend.
With candlestick charts, it provides a more complete component compared to other charts in conducting technical analysis.
From some of the points above and the advantages of candlestick charts, traders prefer to use candlestick charts in conducting technical analysis.
4. Describe a bullish candle and a bearish candle identifying its anatomy? (Screenshot is required)
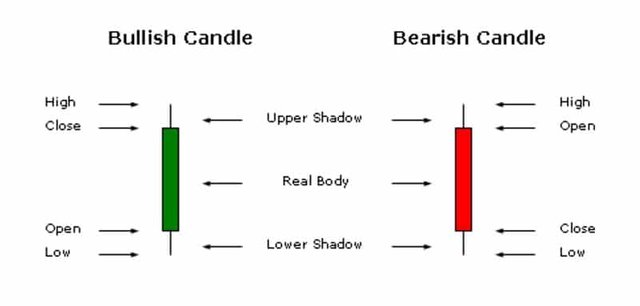
From the anatomy of the image above, we can see that the difference between a bullish candle and a bearish candle is found at the open and close, in a bullish candle the opening price is below the closing price, while in a bearish candle the opening price is above the closing price.
Bullish Candle
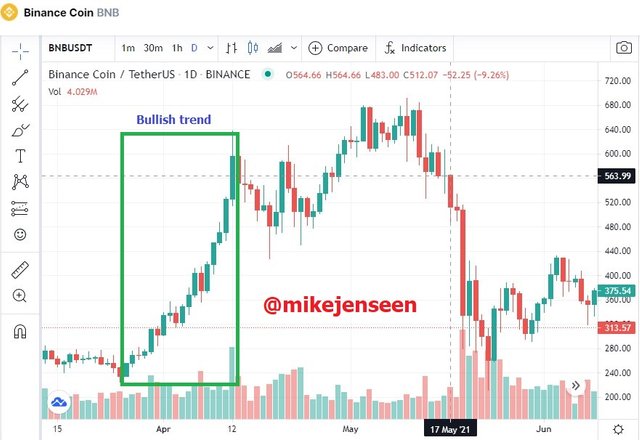
We can see from the graph above that the bullish candle is a candle that is moving up, or the chart is in an uptrend, usually when a bullish candle appears, an asset is experiencing an increase in price.
Bearish Candle
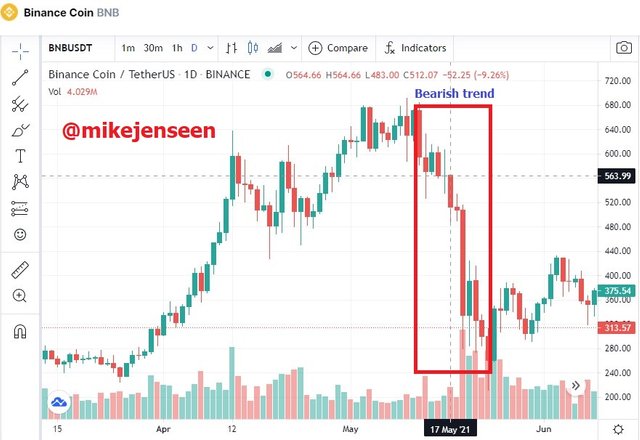
We can see from the chart above that the bearish candle is a candle that is moving downwards, or the chart is in a downtrend, usually when a bearish candle appears, an asset is experiencing a decline in price.
Conclusion
Japanese candlestick is a very popular chart and is often used by traders, this chart is very helpful for traders in conducting technical analysis so that traders can make decisions when to start trading. because if you want to trade, the right time to enter the market is very decisive to benefit from trading.
thanks to professor @reminiscence01 for giving a very good lecture this week. Hopefully my understanding and other readers about crypto will increase even more. That is all from me.
Hello @mikejenseen , I’m glad you participated in the 2nd week of the Beginner’s class at the Steemit Crypto Academy. Your grades in this task are as follows:
Recommendation / Feedback:
Thank you for submitting your homework task.