Basic EMA Strategy + Trendline Break- Crypto Academy S4W6| Homework Post for @lenonmc21
Designed in canva
Greetings Steemians, hope you all have been ok. Welcome to week 6 of the Crypto Academy Season 4. After reading through this impactful lecture by @lenonmc21, I will be completing my homework post based on the following questions.
Introduction
As an investor in the crypto world one has to apply various strategies in other to maximize profit. The EMA Strategy +Trendline Break is a price action strategy, an essential one in the crypto market. This strategy is employed by investors to analyze and know when a particular asset is on the buy or sell trend

1 Define and Explain in Detail in your Own Words what is EMA Strategy + Breakout of the Trend Line?

To clearly define this, I have to explain first what a Trend Line is.
a Trendline is a line drawn on a chart to indicate the direction of price by connecting series of prices together.
The E.M.A on the other hand, is an acronym for Exponential Moving Average.
It is a type of technical analysis indicator Unlike most indicators, it tracks the price of an asset over certain period and narrows it down to more relevant data (-price of recent days) to enable a trader have an idea of the market trends.
Breakout of Trendline strategy helps investors gauge entry into trending markets, a broken trendline implies that a change in trend is about to occur.
EMA Strategy is the addition of an EMA in a trade chart to notify the investor of the movement of trends either uptrend or downtrend.
However, the EMA Strategy + breakout of the trendline when combined can maximize profit seeing that the EMA strategy pinpoints predominant trends in the market and the trendline serves as a guide to detect breakouts for trade. It is called the price action strategy that determines the entry and exit points of the market to maximize profit and minimize loss. where purchases are made in the case of uptrend buy pressure and sell in the case of downtrend sell pressure.
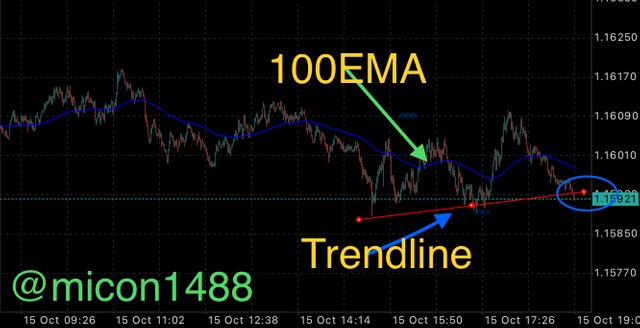
Image from my MetaTrader5 app
Identifying a buy and sell signal can be somewhat easy as the buy signal is seen when the price moves above the set EMA and breakouts on the trendline.
The sell signal on the other hand is identified when the price action goes below the set EMA and breakouts on the trendline.

2 Explain in Details the Role of the 100EMA in the EMA + Trendline breakout strategy?

From the above explanation of EMA, we see that the EMA is a moving average which calculates the average price over specific period putting more weight on relevant data. The 100EMA calculates average price over the last 100days giving the investor an idea of the price trend.
In the EMA + Trendline breakout strategy, the 100EMA serves as a long term time frame given the investor using this strategy an idea of the general market, now if the price should go above the 100EMA and break the trendline it signals a buy trend and if the price goes below is signals a sell trend.
In general the 100EMA in this strategy shows the direction the market is at and what trade to make. An investor needs just draw trend lines above or below the 100EMA and trade the breakouts , the 100 EMA gives trend direction

3 Explain in Detail the Role of the “Trendline” in the EMA + Breakout Trendline Strategy?

The Trendline is a major key player in this strategy as it is used basically to identify breakouts in an uptrend or downtrend buy or sell of the market. The trendline is drawn on major price point in either a bullish or bearish trend to detect breakouts. Also, the trendline notifies the trader of price direction.

4 Explain the Step by Step of what needs to be taken into account to execute the EMA + Trendline breakout strategy correctly?

The EMA + Trendline breakout strategy has two major flows an uptrend buy pressure and a downtrend selling pressure, so to properly execute this strategy the identification of the uptrend and downtrend has to be taken into account in addition with the market cycle.
For Uptrend buy pressure the following should be noted;
- In a particular market the price has to be going above the set EMA.
- The Trendline should be placed focusing on major swing points and adjusted constantly to fit the current price trend, when a breakout is observed a buy stop order should be placed near the trendline.
For downtrend sell pressure the following should be noted;
- For downtrend, the price has to go below the set EMA line and the trendline should be drawn focusing on major points.
- when a breakout out is observed a sell-stop order should be placed near the trendline as this allows for minimal loss.
For both uptrend and downtrend; the investor should always wait for the breakout candle to close beyond the trendline to confirm the breakout

5 What are the Trade entry and exit Criteria for the EMA + Trendline breakout strategy?

The Trade Exit Criteria ;
Not all breakouts in this strategy are suitable to enter as in the case of long candle breakouts that move far away from Trendline and creates greater stop loss distance in this scenario it is better to not buy or sell and wait for the next breakout. Also, if there is no clear upward or downward trend you should not enter the trade.
The Trade Entry Criteria ;
The upward or downward trend must be clear before addition of trendline to major points and the breakout candle must close beyond the trendline to confirm the break and signal trade.

6 Make 2 entries (one Bullish and one Bearish) in any pair of “cryptocurrencies using the EMA Strategy + Trendline Break” (use a demo account, to be able to make your entry in real time at any time frame of your choice, preferably low temporalities)

Bearish (Sell) Trade Using EMA strategy + Trendline Break -
For this instance I would be using the same crypto pair for both my bullish and bearish trade the ETHUSD, I would apply three EMA periods 20 being the blue, 50 being the pink and 200 being the yellow and I’ll be able to tell a bullish trend when the small EMA cross over the large EMA and a bearish trend when the opposite occurs. Both support and resistance are present in my entries and a time frame of 1D is used
My entries are below.
Bearish (Sell) Trade Using EMA strategy + Trendline Break- ETHUSD
I login into my Trading view account and then choose the crypto pair I’ll be using, after which I proceeded to add my EMA lines, I then observed the trend and added my trendline to confirm when I should enter the trade. I enter the trade with a;
| Price | $2.56 |
|---|---|
| Stop loss | 3850 |
| Take profit | 3318 |
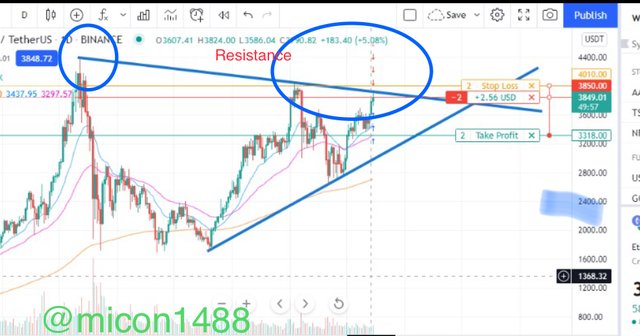
Image from Trading view
Looking at the image above, it is seen from the trendline that the trade was met at a good position for a bearish
Bullish (Buy) Trade Using EMA strategy + Trendline Break - ETHUSD
Using the same chart from the bearish I quickly placed a buy order ahead of time, just right after the bearish market to give me an entry to buy.
I enter with a;
| Buy limit | 3365 |
|---|---|
| Stop loss | 3215 |
| Take profit | 4041 |
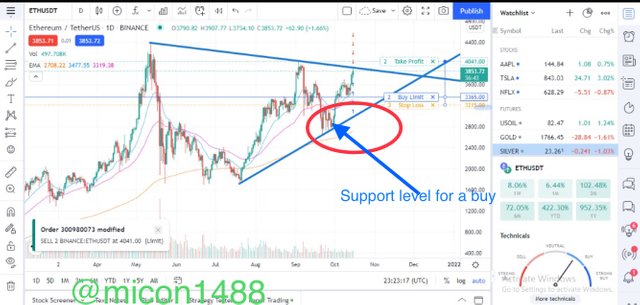
Image from Trading view
Conclusion
The EMA + Trendline breakout strategy is a really great strategy as if followed and timed properly has a higher chance of favouring the take profit level. This lecture has really enlightened me. And once again I express my gratitude to Prof. @lenonmc21 for this amazing and clear lecture.