Steemit Crypto Academy Week 8 - Homework Post for @kouba01 by @micheal432
Bollinger Band is an easy to use trading tool. It was created by John Bollinger in 1980 and has been used ever since by traders to trade stocks, forex and cryptocurrencies.
It is a type of technical analysis that moves with just the price and volatility of an asset. It gives entry and exit points to traders and also show an overbought and oversold position just like the relative strength index.
It should be noted that Bollinger shouldn't be used as an indicator for price without other technical analysis because it only uses price and volatility as criteria and ignores many other informations.
Calculations of Bollinger Band.
John Bollinger suggested the use of a 20- day simple moving average for the calculations of a Bollinger band. Bollinger bands has 2 lines the upper hand and the lower band then with an additional line which is the simple moving average which makes it 3 on the chart.
To get the value of the upper band and lower band, 2 daily standard deviation is added and subtracted from the simple moving average respectively.
Mathematical expression is stated below.
To calculate a 20-day moving average you add the closing prices of an asset for 20 days and divide it by 20
Moving average = addition of closing price for the number of periods used ÷ by the number of period
E.g if it's a 20 - day period it will be addition of closing prices for the past 20 days ÷ 20
To calculate the upper Bollinger Band you will add the standard deviation multiplied by 2 to the Moving Average.
Upper bollinger band= M.A + (2 × 20 standard deviation of the close price)
To calculate the lower Bollinger Band you will subtract the standard deviation multiplied by 2 from the Moving Average.
Lower bollinger band = M.A - ( 2 × 20 standard deviation of the close price)
NOTE: When you use a higher value for the Moving average and set the standard deviation to 3 it should be noted that the width between the upper and lower Bands will increase causing the price action not to touch the upper band or lower band. Also when the values are reduced it causes alot of false signals because the price are always touching the lower and upper bands at intervals.
SETTING UP A BOLLINGER BAND INDICATOR
The best Bollinger setup is the 20-day moving average. This is the standard that has been set by John Bollinger. This estimate the price of 20 days and gives a more clearer band. The volatility of a market can be known by the Bollinger band when there is a wide space between the upper band and lower band and when there is a smaller space it means the volatility has decreased.
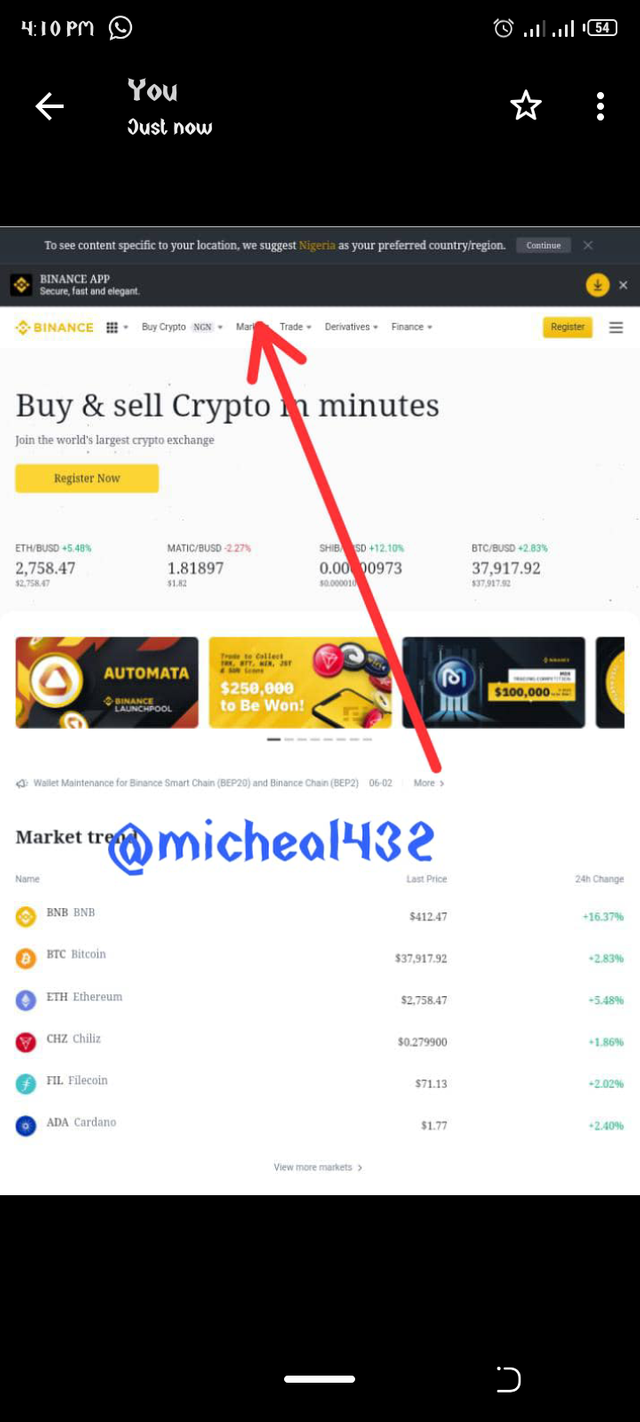
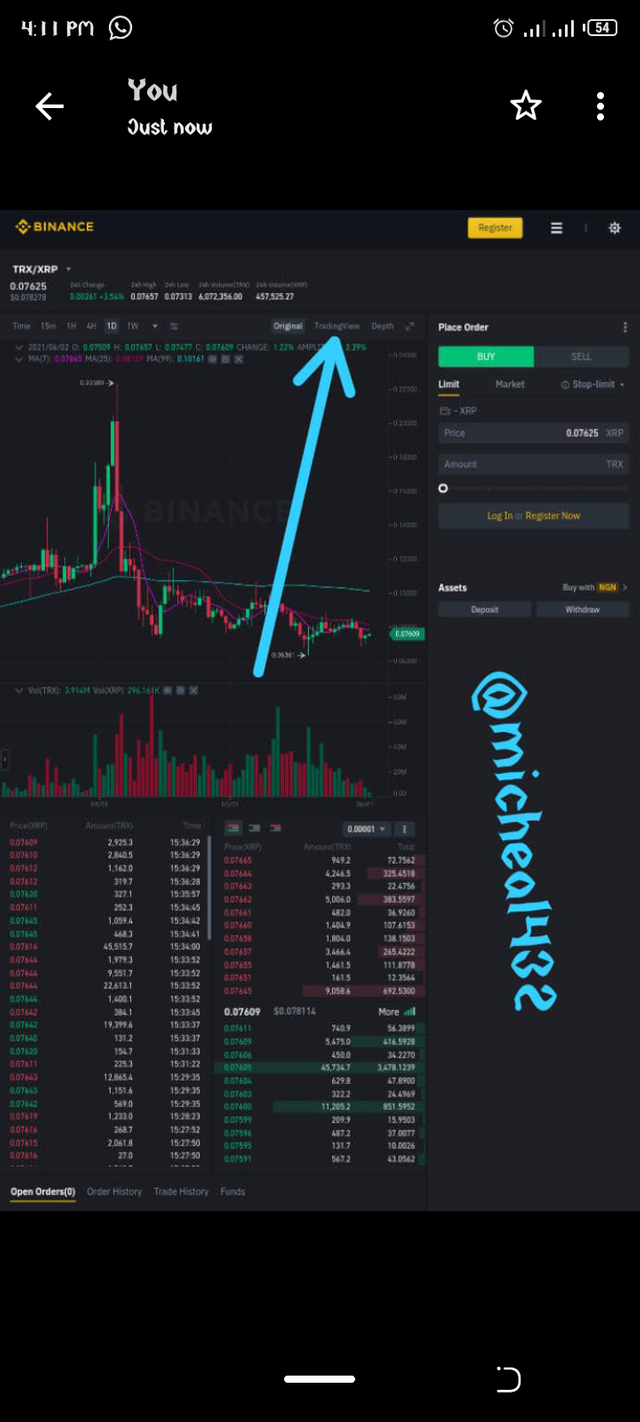
To set up a Bollinger band we need a chart reading platform. For this tutorial we will be making use of binance. Load binance on your browser when it finish loading click on market and select a pair you wish to view it's chart. When it shows the chart click on trading view, it will take you to another interface.
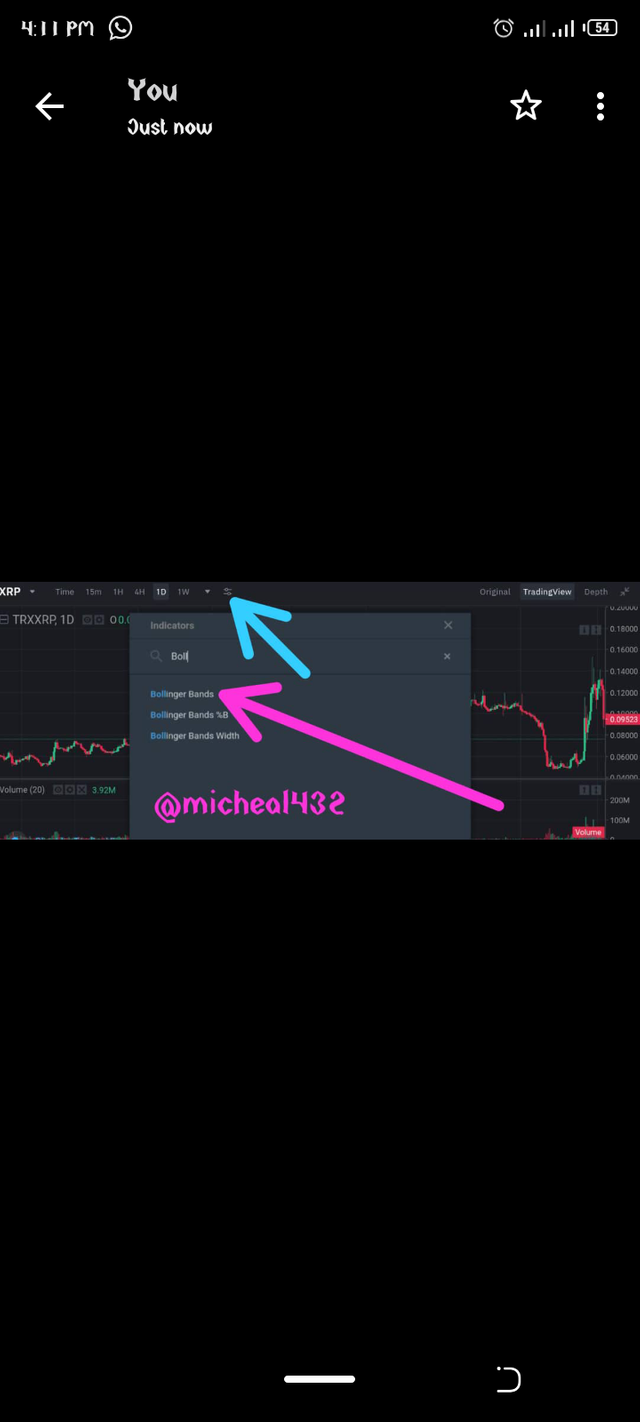
The third screenshot above to activate the Bollinger band click the blue arrow first then search for Bollinger and click on Bollinger band. Once you click it, it will automatically add on the chart.
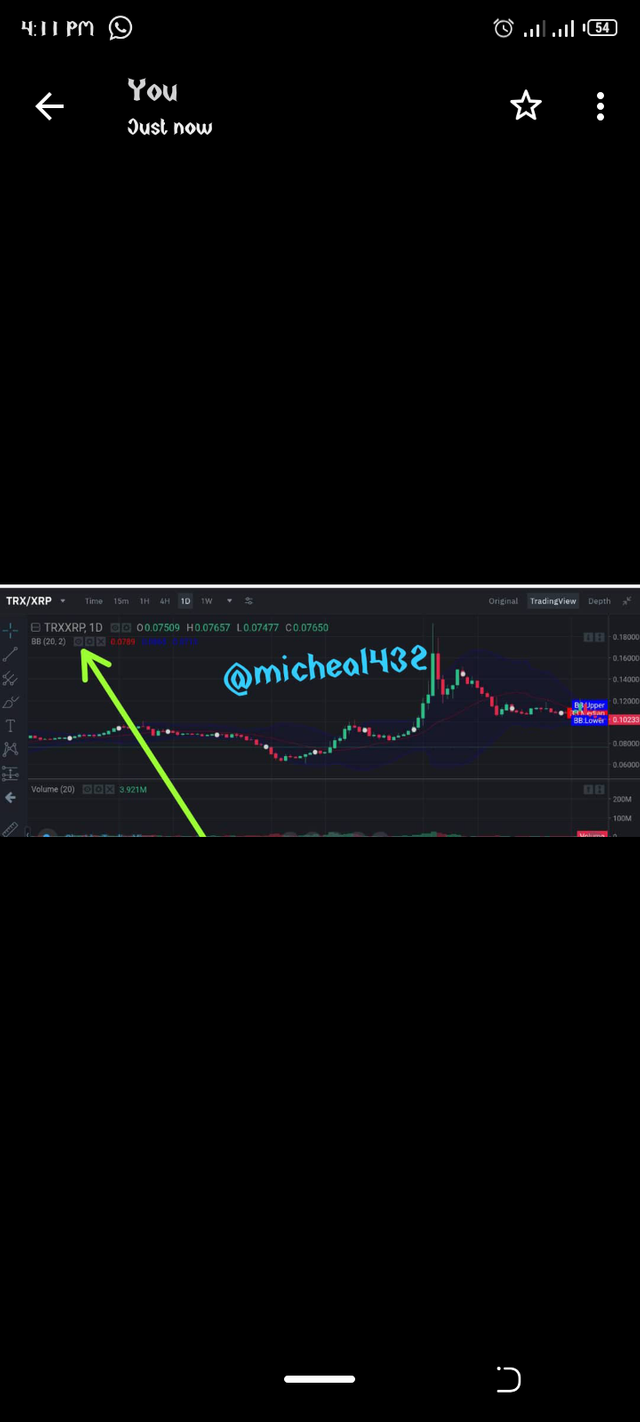
It has been added on the chart but the color is not too clear so we edit the color of the Bollinger band. By click on the settings as directed by the arrow. Then set the style which consist of the color and the thickness of the line of the bands.
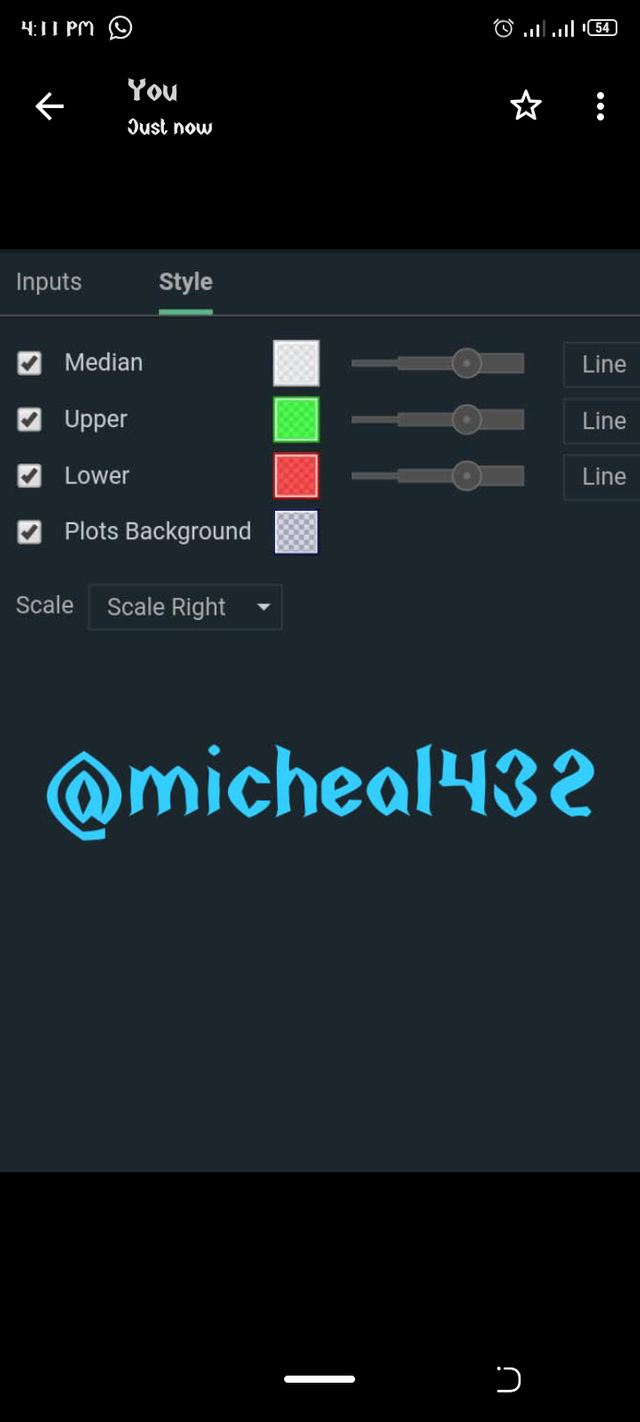
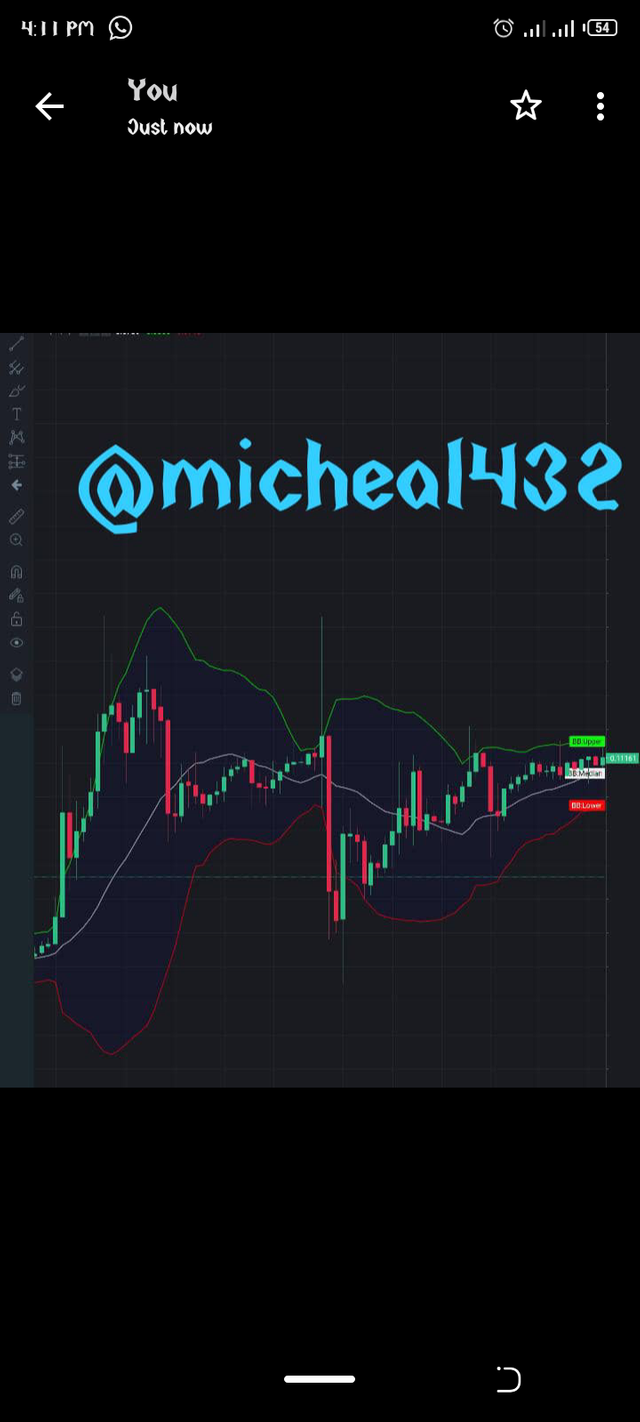
The input is already set which is the best for the Bollinger band. Then click okay. You have successfully added the Bollinger band on the chart.
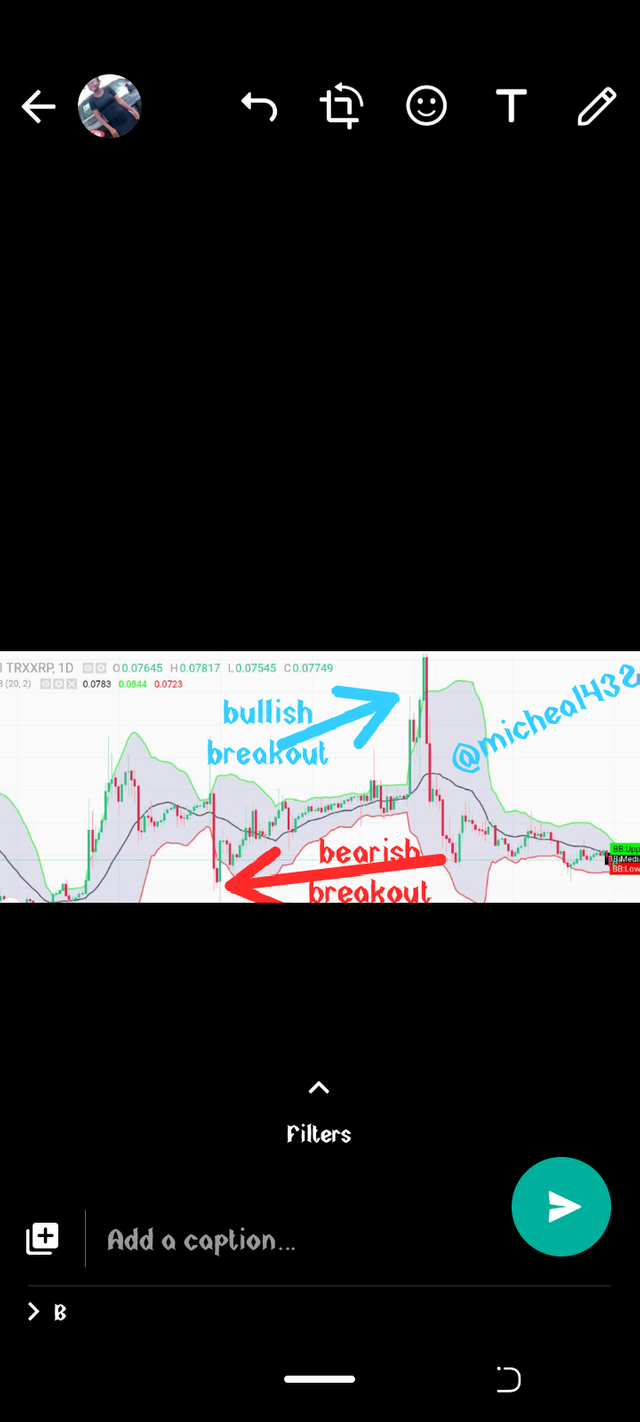
BREAKOUTS IN BOLLINGER
A breakout in Bollinger refers to when the price action is so strong that the candlestick moves pass the resistance or support level and crosses the bands be it the lower band or the upper band and also closes up outside the band. A breakout can be a signal for traders especially when the candlestick closes and returns into the band it then means a reverse will happen. After a breakout a reverse is imminent.
HOW TO TRADE WITH BOLLINGER BANDS
There are different strategies of Bollinger bands used to trade in the market. All you have to do is choose the one that works best for you and perfectly understand it. Some of the strategies are listed below.
- Constricted and wide bands: this strategy can help you determine the next cycle of a trend. When the band is moving in an uptrend direction and it gets to a point where the volatility of the assets decreases this causes a constricted band, after the constriction there is a tendency for a reversal of trend and also there will be high volatility of the asset which will follow.
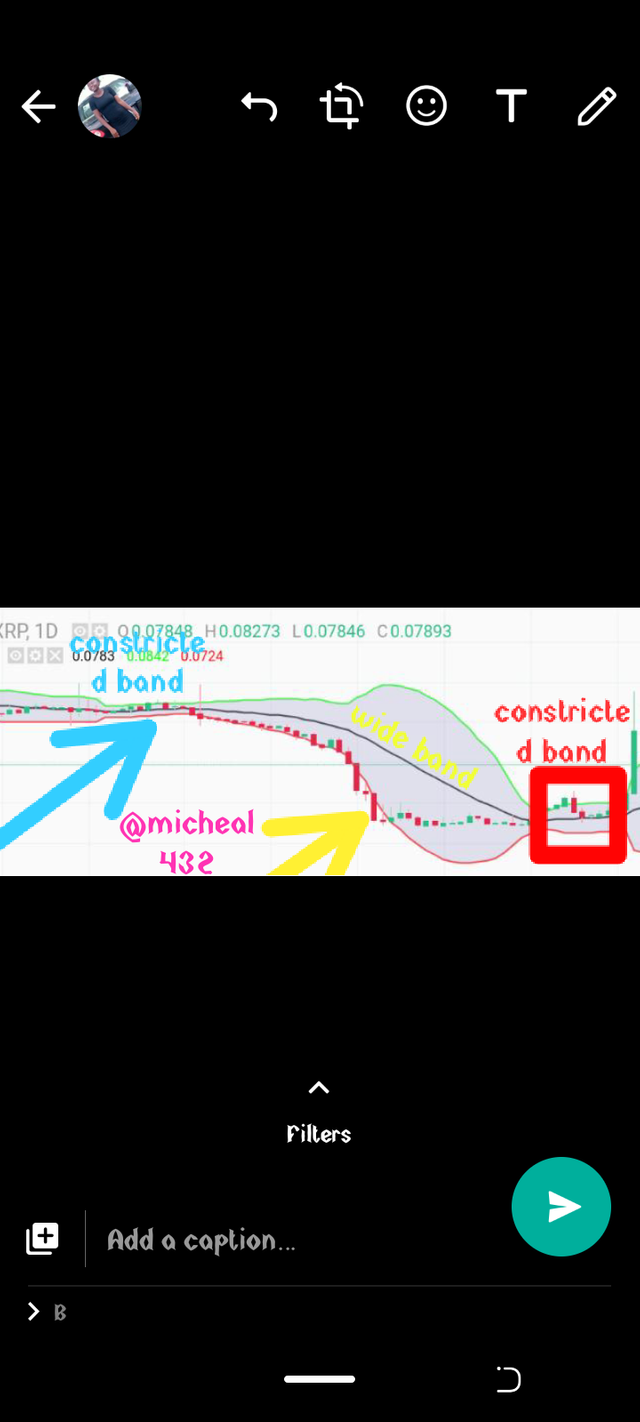
Same goes for when the asset has high volatility leading to a large width in the bands after the cycle there will be low volatility to follow. This strategy can help a trader know when to long or short a position. Most times a constricted band might take longer than expected ensure to always confirm it has ended before starting the trade.
- Oversold: this leads to a downtrend, it happens when there is more selling than buying of the asset in the market, especially when investors and traders are taking profits at the same time. After an oversold period there is always a reversal which will lead to a rise in price. The Bollinger band helps us to determine an region. Whenever the candlestick touches or comes the lower band it means there is an oversold.
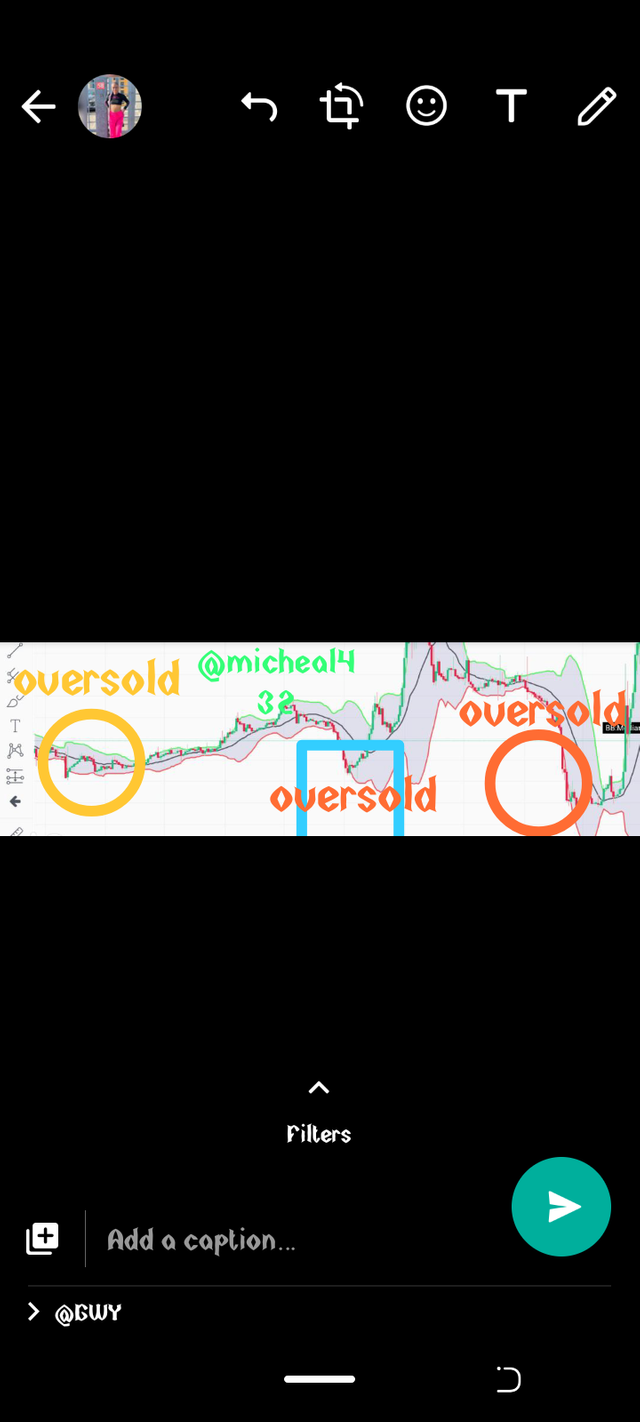
- Overbought: this is the opposite of the oversold, an overbought happens when there is a high demand of an asset it leads to rise in price and when there is still more demand the price goes higher at this point the candlestick touches the upper hand and sometimes comes out from the upper hand. After an overbought there is a tendency for a reversal.
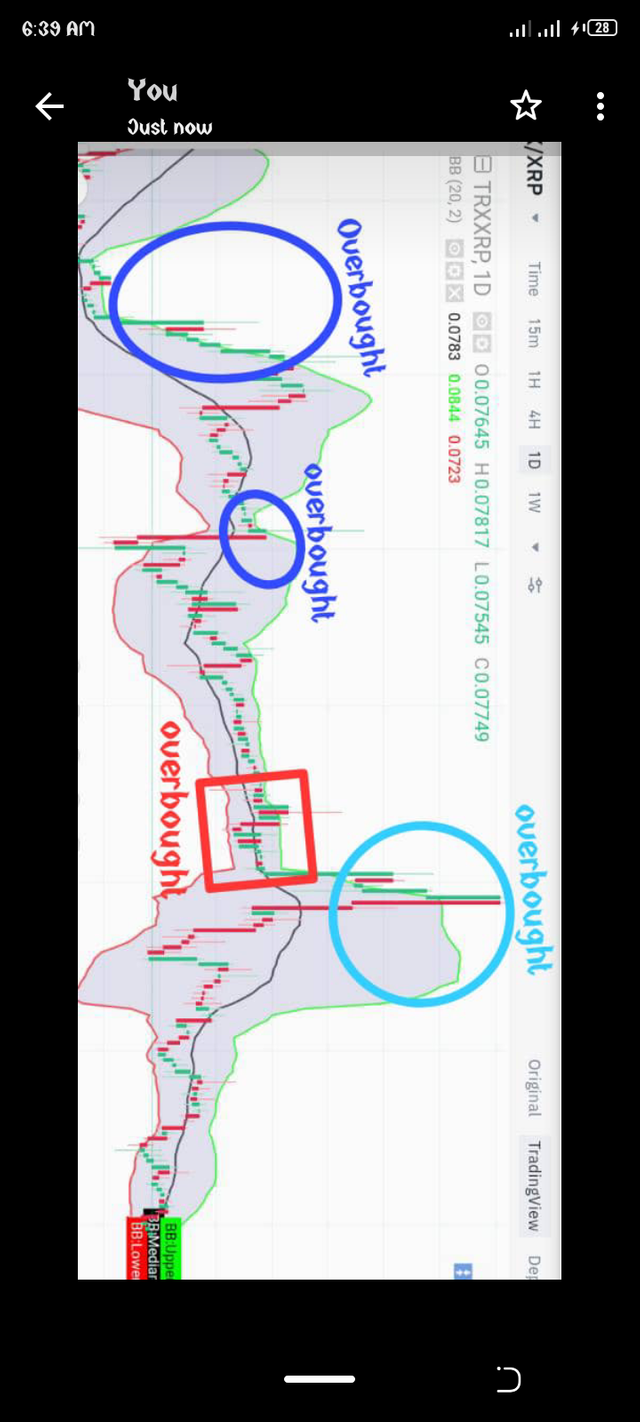
NOTE: after each overbought and oversold it is advisable to wait for it to retract back before traodng it's reversal because sometimes the overbought and oversold might stay longer than you think. So wait for a signal before entering the trade.
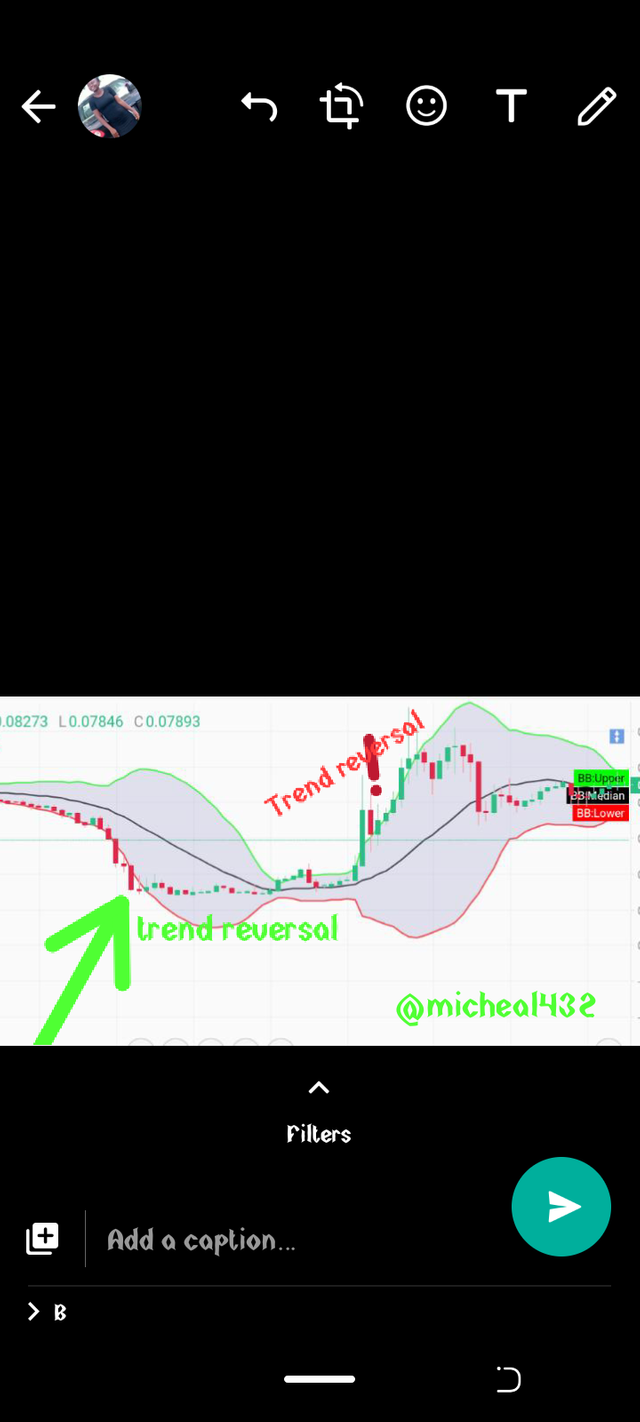
- Trend reversal: this is when the candlestick comes out from either of the bands and corrects itself back into the band it has called for a trend reversal. This is one strategy traders use to know the trend the market will be going next.
Are you thinking of other indicators to use with Bollinger bands to get a perfect combination. There is no particular indicator that is best or better than the other, they all depends on the trader. For this tutorial I will suggest a bandwidth indicator.
Bandwidth indicator measures the width of the bands together with the moving average, this helps a trader identify the constriction and wide band strategy I gave above. When the calculation is done and there is a narrow width it means a low volatility and there is going to be a high volatility soon and vice versa. So this indicator help traders know when they should sell or buy through the volatility prediction
To calculate the squeeze you will subtract the upper band from the lower band and divide it by the middle band. to identify the trend direction, if the price is currently heading down and indicators are heading up, the sign is bullish.
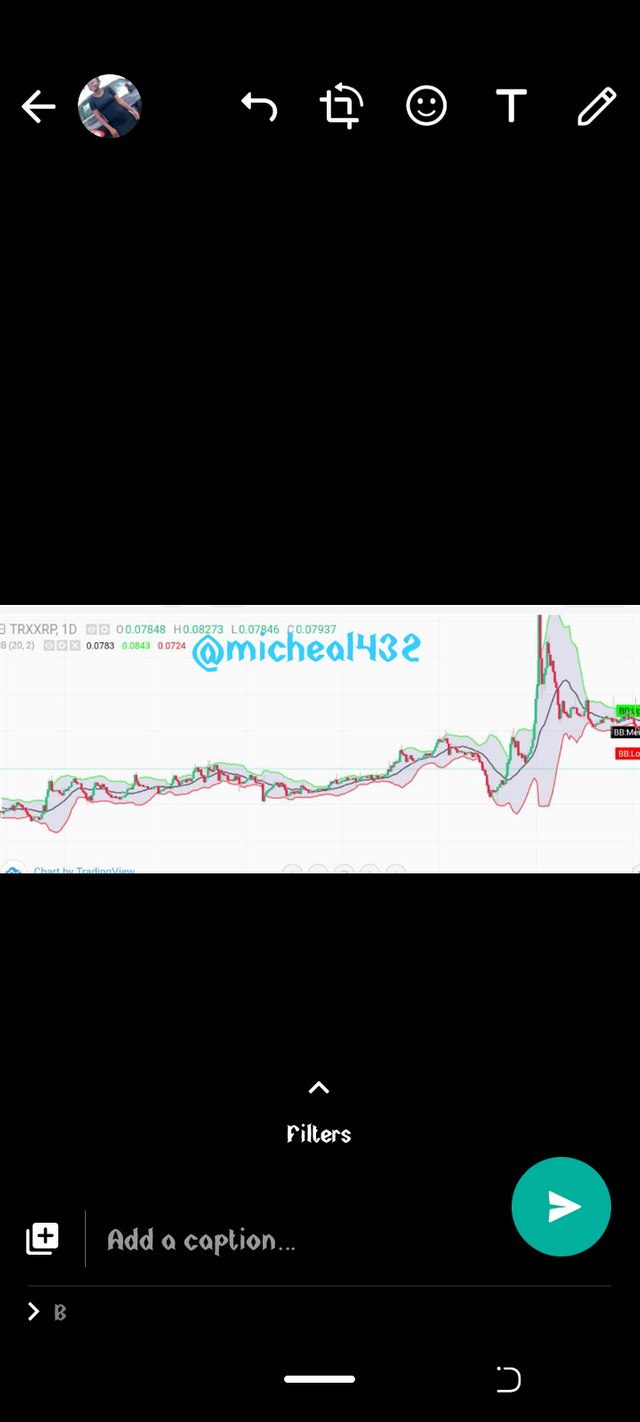
REVIEW OF TRXXRP PAIR
Currently, the price of the pair is at $0.080 dollars and has done a 24hrs high of $0.082.
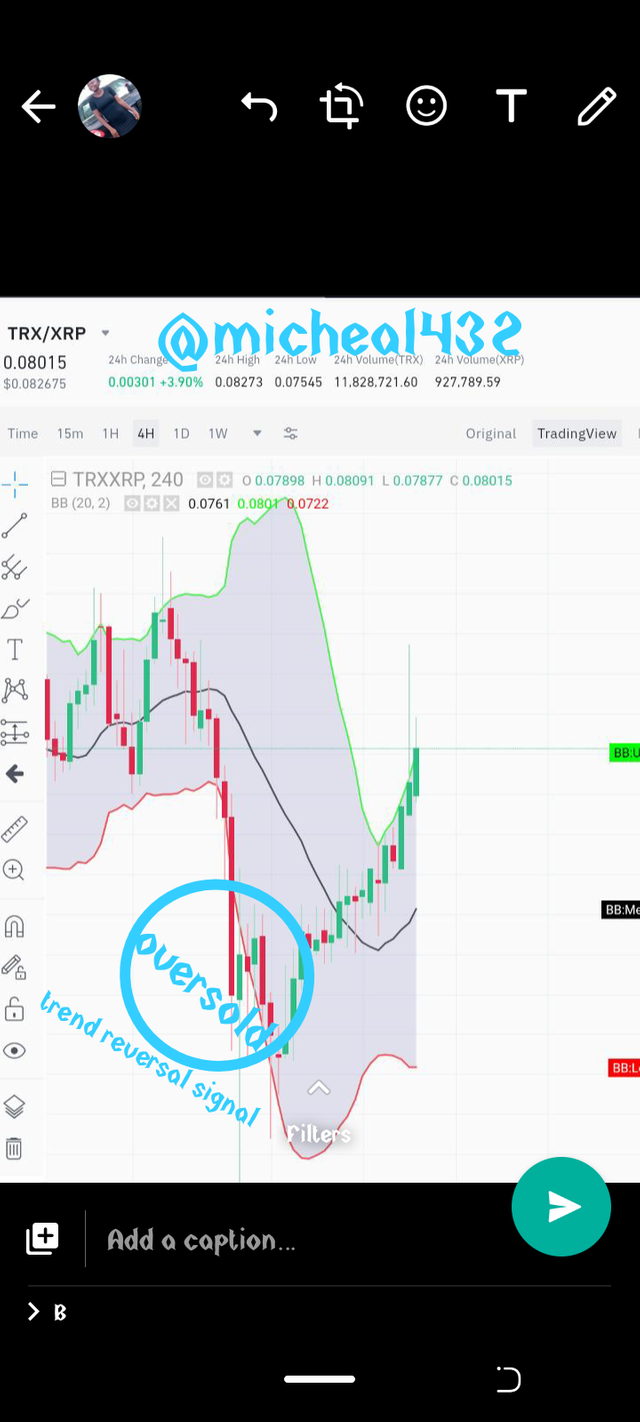
The chart above is a 4hour chart of the pair TRXXRP, this chart shows both and oversold signal and a trend reversal signal. The trend was moving in a downward direction and there is a possibility for a bullish run. The price fell to $0.073 before retracting back if we had studied the chart earlier as the price retracts we would have entered the trade and made a little profit.
With the Bollinger bands we are able to know that there will be an uptrend and the price will beat the 24hrs high in due time. I hope we have been able to see how the Bollinger bands works.
Hello @micheal432,
Thank you for participating in the 8th Week Crypto Course in its second season and for your efforts to complete the suggested tasks, you deserve a 3.5/10 rating, according to the following scale:
My review :
A sub-standard article in which you did not adhere to what is required in some of the questions, in addition to the lack of depth in analyzing others. Try reading some good articles to quote some techniques in writing and interpretation.
Thanks again for your effort, and we look forward to reading your next work.
Sincerely,@kouba01