Steemit Crypto Academy Week 8 - Homework Post for @fendit by @micheal432
Early in the 20th century the Wyckoff method was created by Wyckoff Rivhard. It consists of various strategies for traders and investors of stock markets. This method has been brought into the modern technical analysis and has not only been used for stick market but for all sort of financial markets.
This method guide traders and investors on the most efficient way to select good stocks, the best time to buy and sell and the risk management of trading.
Wyckoff has done alot of research which made him come up with techniques and laws which we will be discussing below
General laws
Fundamental laws of Wyckoff method and
Composite man
GENERAL LAWS
- The first rule states that traders and investors should be cautious because market never behaves in the same way twice, rather trends move in a similar price pattern which shows differences in size, details and length which is in a bid to confuse market participants.
- The second rule is about market relativity, Wyckoff told traders and investors that in a financial markets what matters is context in that, the only way to know today's price action is to relate what happened few weeks ago, to last month and to last year to even a day ago. Using a day chart of 4 hours chart alone will bring about false signals and predictions.
FUNDAMENTAL LAWS OF WYCKOFF METHOD
Three laws are what make up the fundamental laws of Wycoff.
- The Law of Demand and supply: this law states that whenever there is a greater supply than demand there is always a fall in price and whenever there is an increase in demand than supply this brings about a rise in price. This law is basics to all commodity even in our household markets.
Demand been greater than supply in this context means there is more buy than sell in the market. Buying has dominated the market while supply been greater means selling has dominated the market.
When the supply and demand are both equal then there won't be any significant change in the price.
To know when the demand is greater than supply, investor and traders are to correlate the price action and volume bar.
- Law of Cause & Effect: this law talks about the difference in between the supply and demand, it says for every demand or supply there is always an event which means supply and demand aren't just random.
For example when there is a buy or sell (Cause) there will be an uptrend or downtrend (effects).
- The Law of Effort and Result: this law states that asset's price changes as a result of efforts by external forces. When the price action and volume are the same the trend will always continue but when there is a difference between them there is a possibility for rehearsal.
There are certain entity or an individual who has the ability to change the market and control the price. They take the market like a ball in their court and play it whichever way they want. This entity is refferd to as COMPOSITE MAN
WHO IS A COMPOSITE MAN?
A composite man or a composite operator are imaginary entities which Wyckoff discovered in his research as the major players of the market. Wyckoff said the movement of price in yhe market should be looked at as if it's just one man that does the operation. Whereby he uses other traders or investors for his own gain and makes those who doesn't understand his motive at disadvantage. ,
The composite operator cab either be an institution or a wealthy individual. The composite man has a strategy which he uses to control the market. This strategy is known as the composite man concept and it consist of four phase which makes up a cycle.
THE COMPOSITE MAN CONCEPT..
Below are the phases of the concept;
ACCUMULATION: This is the first phase of the cycle where the composite operator acquires a lot of the assets before more investors starts buying into the assets. He does this in a gradual manner so as to make the change not too significant to other investors.
UPTREND: This is the next phase when the composite man has acquired enough part of the asset, and he is satisfied, he will then start pushing the market up by creating awareness about assets.
Whenever an asset starts trending it will attracts more investors causing an increase in demand and thsi will make the price move in an uptrend movement. There are phases where accumulation happens again during an uptrend this is called re accumulation before the uptrend gets to the highest level.
There is always excitement and anxiety when there is a rise in price action of an asset, there is always fear of missing out amongst traders which make them keep buying the assets and the assets keep moving up.
- Distribution: This is the stage where the composite man starts selling off his holdings to take profits of what he has acquired. He sells gradually and this process allows makes the supply to start dominating the demand which will lead to the last phase called
- Downtrend: just after the distribution there is a dipping in the price. The composite man has sold large amount of his accumulation and the market price will go down. So this causes a more supply than demand in the market. Just like the uptrend there is always a redistribution phase while the price goes down. Those traders who gets in late then lose in the market. After the end of the phase then the cycle starts over again.
The screenshot above shows a diagram representation of the cycle.
ANALYZING THE MARKET WITH WYCKOFF METHOD
Now that we understand how the Wycoff method works, to use the method for the market we just first think like a composite man
To analyze the market with Wycoff method, firstly you have to determine the trend of the market and to what direction it is going. Then relate the market to the assets movement. In other words if the market is bullish relate it to the asset if it's also bullish, so as to know how to trade when there is a difference between the market movement and the asset movement.
Then you consider your options, the assets you wish to trade is there a major cause for the price movement, is there enough reason to take a position in the market. Then you consider the probability of it's movement. The last time high and low. The resistance and support level, this help know what position to take and how to set stop loss.
Then you time your entry depending on how much profit you want to take, whether short or long.
Note: Other indicators can be used to confirm the market to know when an uptrend has come to an end do as not to incur loose while thinking it's a re accumulation period. Also a trader shouldn't trade with emotions.
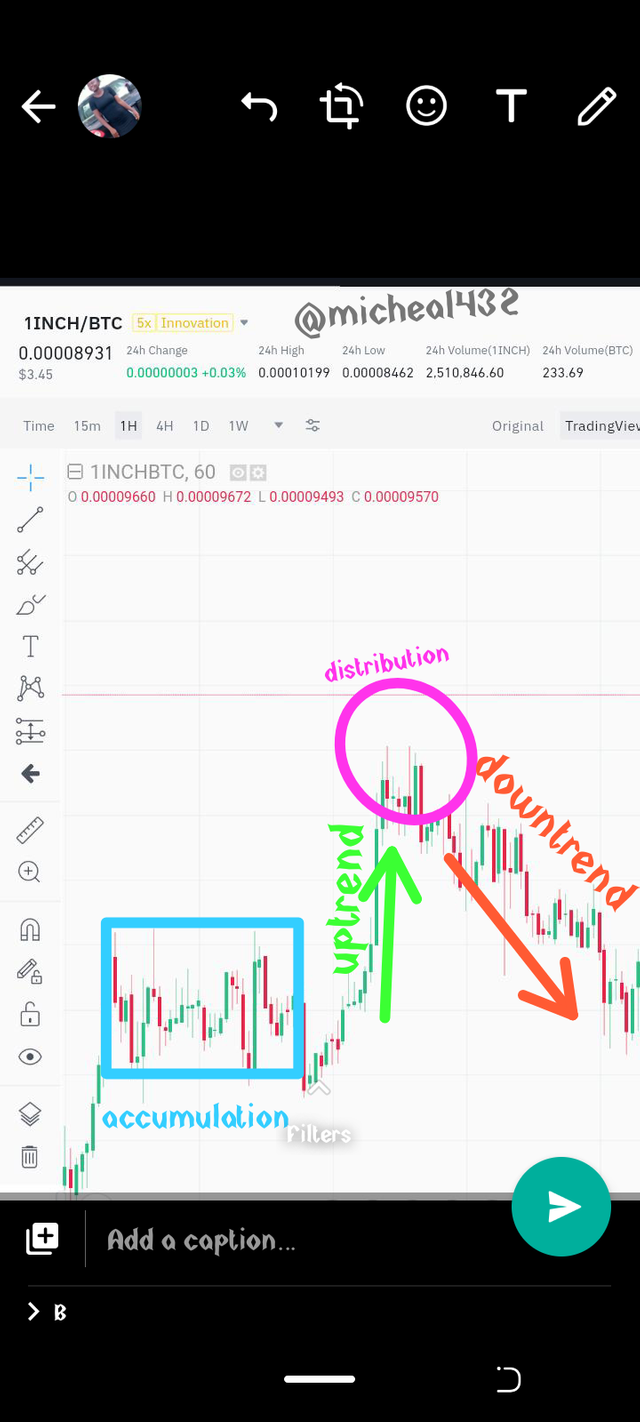
REVIEW ON INCHBTC
This is a chart review about the pair INCHBTC.
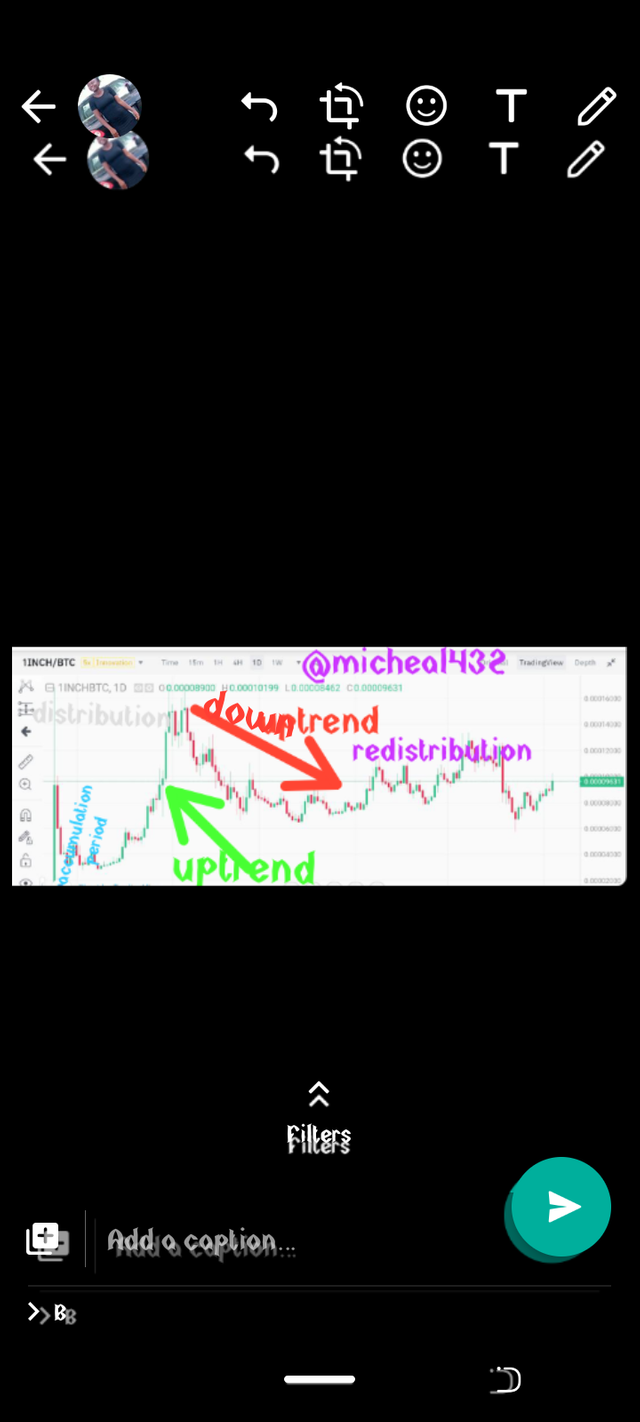
The pair has a 24 hours high of $0.0001019. the chart is a 4 hour chart and it is showing the wyckoff method. It can be observed that there was a fall in price before the start of the accumulation period. More investors joined the trend which made it rise a bit and there was a re accumulation before the price then Rose to it's peak.
During this period there was distribution where selling occurred and this caused a decrease in demdnd and increase in supply. Before another redistribution. In this chart there are lot of redistributions which doesn't make the downtrend move in a straight manner but in a zigzag way.
At the end of the downtrend we are beginning to see the begining of another cycle which is the early stages of accumulation. A trader or investor can enter the trade now and wait for the uptrend.
Thank you for being part of my lecture and completing the task!
My comments:
Explanations were ok, but some of them could have been a bit more ellaborate.
When it comes to the chart, accumulation hasn't been properly identified as it's a period in which price tends to be quite stable. Also, you should have included the volume bars as that's one of the most important parts of this method.
Overall score:
5/10