Crypto Academy / Season 3 / Week 2-Homework Post For @reminiscence01
EXPLAIN THE JAPANESE CANDLESTICK CHART?
First, what is a chart? For a chart to be used, there is always a subject of interest. A chart is a pictorial representation that is used to pass actual information about the subject of interest. In cryptocurrency trading, it is mainly used to show the movement of the price of an asset over a period of time.
The Japanese candlestick chart is the most used chart that is used to show the direction of price within a specified time.
The chart shows the interaction between buyers and sellers and candlesticks are used to illustrate this interaction indicating the various price points during the interaction. The candlesticks show that interaction by visually representing the size of price movements with different colors and this helps traders to make trading decisions.
The candlesticks can be set to any color. The different colors of the body is used to show if the candlestick is bullish or bearish, that is if it is rising or falling. So, the different colors helps one to easily tell if the candlestick is bullish or bearish.
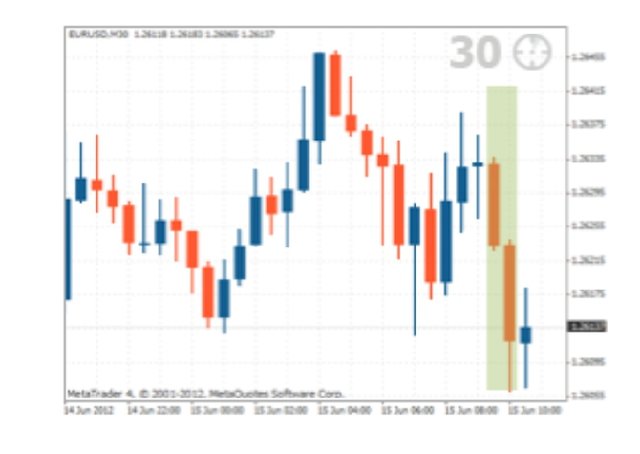
In the example above, you will notice that the orange color is used for bearish candles while the blue color is used for bullish candles.
Orange candlestick - The candle is bearish. This means you have more sellers than buyers leading to fall in price within the given period. There is downtrend movement of price. The price was lower at the close of the given period than when it opened.
Blue candlestick - The candle is bullish, which means that you have more buyers than sellers throughout the given period leading to price increase. This indicate an uptrend price movements. The price was high at the close of the specified period than when it opened.
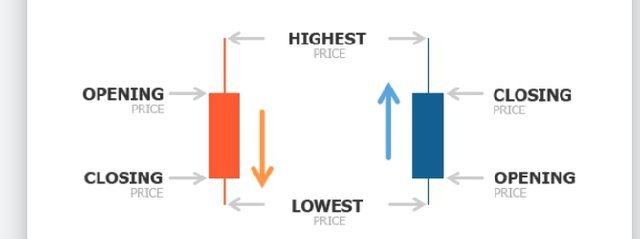
The chart shows four major parts each indicating a specified point in price movement in a given time period. They include:
- Opening price - This refers to the start of price movement of an asset at a given time.
- Closing price - This shows the last price recorded in a candle in a given time.
- Highest - This refers to the highest price of the asset at a given time.
- Lowest - This shows the lowest price recorded in a specified time.
Other parts also include,
Shadow - This shows the areas that price moved through but could not close. The movement of the price is still unsettled.
The Real body - This covers the range between the opening price and the closing price. So, it shows the distance covered by price within a specified period.
DESCRIBE ANY OTHER TWO TYPES OF CHARTS?
Two other types of charts that we have are Line charts and Bar charts.
LINE CHART
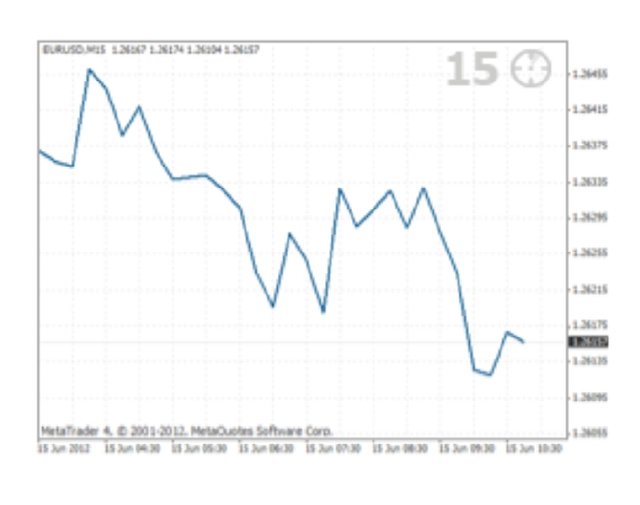
Image source
When you want a very simple or easy way of representing price movement, then the line chart is ideal for you. This is because it shows you information just with simple line using series of data points. You just see a line drawn from a specific price point to another price point. However, the line chart does not provide a person with a more detailed data
BAR CHART
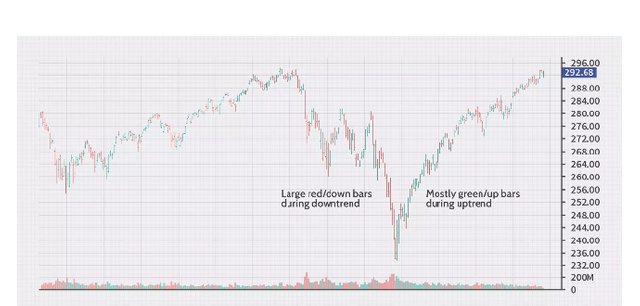
This is another type of chart that is used to represent the movement of price. The bar chart presents more information or data. For example, the open, close, high, and low prices of assets are embedded in bars. The bars are plotted as series of prices over a specified time period. Traders use bar charts to see patterns more easily. You will also observe each bar has a vertical line that indicates the highest and lowest price reached within the given time.
IN YOUR OWN WORDS, EXPLAIN WHY THE JAPANESE CANDLESTICK CHART IS MOSTLY USED BY TRADERS?
I can say that the Japanese candlestick chart is mostly used by traders because it gives more detailed information about price movements with the use of parameters like open, close, high, low that give signals at a glance. Because the two candlesticks are of different colors, one can at a glance tell if they are bullish or bearish. The chart enables the traders to analyze the market easily. Since the chart shows the interaction between the buyers and sellers, the candlesticks are used to illustrate that interaction by visually representing the size of price movements with different colors, which guides the traders to make trading decisions.
In addition, properly analyzing the price movement of the candlestick chart can help the traders to make present market prediction as well as future market predictions in order to benefit maximally from the market and avoid losses.
DESCRIBE A BULLISH CANDLE AND A BEARISH CANDLE IDENTIFYING ITS ANATOMY?
BULLISH CANDLE
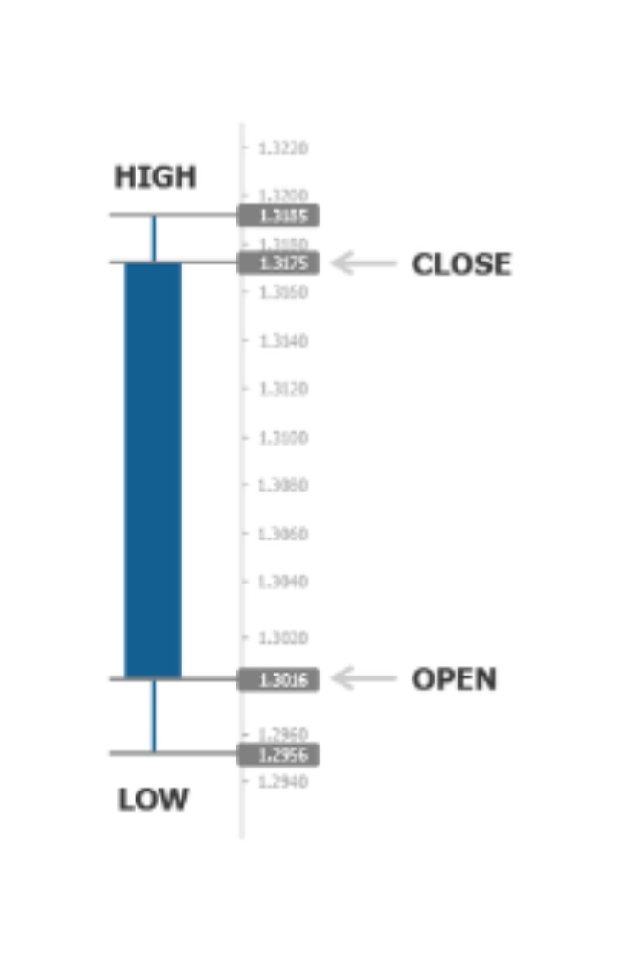
This candlestick as represented by the blue candle indicates an increase in the price of the asset. You will notice that the closing price is above the opening price indicating that the price moved upward within a specified period. Since the opening price is below the closing price, it shows increase in the price of the asset represented. The low shows the lowest price recorded within the candle while the high shows the highest price recorded within the candle.
BEARISH CANDLE
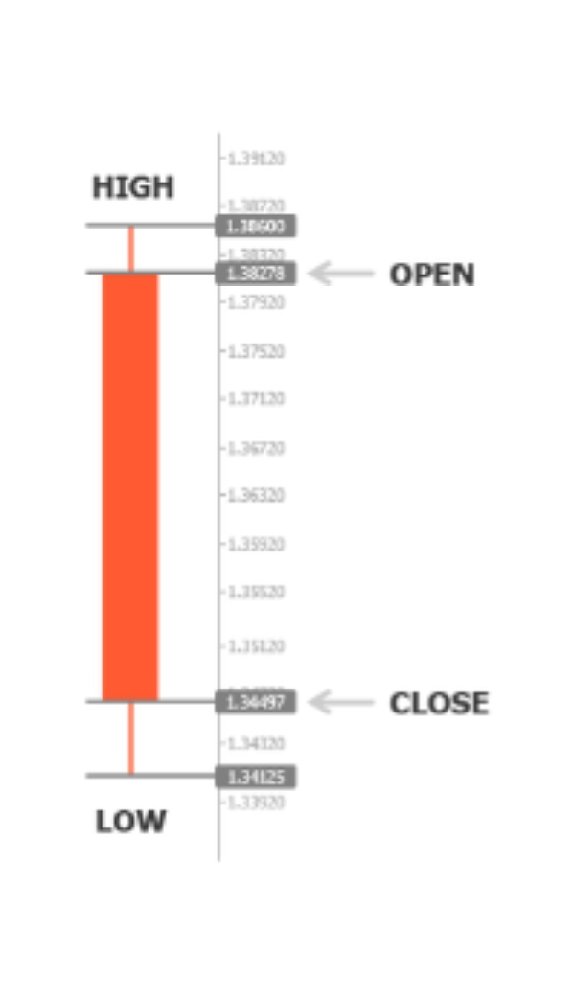
The bearish candle as represented by the orange candle shows a decrease in price of the asset. It shows that the price is moving on a downward direction. You will notice that in a bearish candle, opening price is always above the closing price to show the downward movement of the price of the asset within a period of time. The low shows the lowest price recorded within the candle while the high shows the highest price recorded within the candle.
I am grateful to Professor @reminiscence01
Hello @michaelu40 , I’m glad you participated in the 2nd week of the Beginner’s class at the Steemit Crypto Academy. Your grades in this task are as follows:
Recommendation / Feedback:
Thank you for participating in this homework task.
Hi Professor @reminiscence01, my homework has not been visited by steemcurator02. Could you please help me out. Its remaining less than one day before it would pay out. Thank you
It will be curated shortly.