Psychology of Trends Cycle - Crypto Academy / S6W4- Homework Post for @reminiscence01

Source

Explain your Understanding of the Dow Jones Theory. Do you think Dow Jones Theory is Important in technical analysis?
One of the earliest recognisable forms of technical analysis is the Dow Theory. Charles H. Dow was responsible for its promulgation based on the fact that he was able to recognise that the prices of the financial market have the ability to move either up or down in what is known as trends. Also, he realised that the assets had the ability to move together in these trends with differences in the extent to which each moves.
In 1897 the Industrial Average which was made up of 12 blue chip stocks together with another average which was made up of 20 railroad enterprises and which was named the Rail Average were developed by Charles Dow as two market averages that mirrored the broad market. These two are now generally referred to as the Dow Jones Industrial Average as well as the Dow Jones Transportation Average.
Importantly, it should be recognised that the Dow Theory now serves as a fundamental ancestor of most of the principles that have been adopted for technical analysis even in the modern era. There are some basic principles that were enunciated by this theory. These principles include:-
1. Everything is discounted by the averages
Everything that is happening in the market is discounted by the averages due to the fact that these averages are believed to mirror all the activities of millions or thousands of investors, speculators and traders acting at any particular point in time.
This means that every single thing that is known and foreseeable about an asset is usually discounted as a condition that has the ability to affect the demand and supply flow of the asset as an individual.
2. The market is made up of three different trends
At every single point in time in the market three forces are usually in action. These include:-
The major or primary trend which normally lasts for up to a year or even more years and is usually behind the up or down movement of price by at least 20%.
The secondary trend which normally comes in between the primary trend to push the market to the opposite direction. Unfortunately, the ability to identify the secondary trend when it is developing is quite a difficult task. It could last for up to one-third of the price movement of the primary trend.
The minor trend which is just the daily fluctuations in the movement of the averages and which may usually not last for more than 6 days. Not much importance is given to this in the theory.
3. The primary trends usually come in three phases
A bull market would be made up of a primary trend which advances significantly consisting of the accumulation phase that is closely followed by a steady advance phase that culminates in a phenomenal advance phase as more people join the market.
The bear market is followed by a decline in the primary trend and also comes in three different phases regarded as distribution phase, the panic phase due to increasing selling pressure and the final discouraged selling phase.
4. The broad market averages must always confirm themselves
These averages, which are the Industrial Average and the Transportation Average, are expected to always confirm each other as a way of validating any change in the market. This is to say that both must be moving towards a common direction at least approximately to prove that a trend is valid 100%.
5. Trend must always be confirmed by volume
Actually, this theorem has its primary focus on price action with volume only being used as a confirmation for uncertain conditions. Expansion of the volume should always be expected in the direction of the main trend.
6. Unless a signal for a definite reversal is given, a trend remains
In an uptrend higher highs and higher lows should be observed. Before a reversal can occur at least a lower high and a lower lower must be created. The reverse is going to be the case when the market is moving downwards. There are more chances of a new trend continuing if both the Transports and the Industrials confirm the same.
Considering the fact that the Dow theory is even the foundation of most other theories propounded in the study of the financial markets I do personally believe that it is a very good technical indicator for studying the movement of price action and for trading.
In your own words, explain the psychology behind the Accumulation and Distribution phases of the market. (Screenshots required)
The prices of assets may appear to be random in nature. However, it is important to note that indeed there are cycles that repeat in the trend of prices. These repetitions normally occur due to the predominant participation of smart money or large institutional traders.
Accumulation
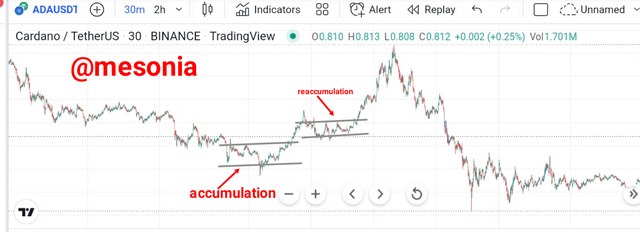
The accumulation phase usually starts as a result of institutional traders or investors like large banks, pension funds and mutual funds buying up very huge amounts of an asset. Under this condition it would be observed that the price would normally form a base. The purchasing activity of these institutional traders would often last for long periods of time so that they don't quickly drive up the price of the asset thereby giving them time to buy more over a long time horizon.
This market condition may not be the best time for retail traders to buy. This is because they could often be a further drawdown in the price of the asset. But understanding when the market is in accumulation helps the retail traders to identify potential future opportunities as a good time to go long would be signalled by the formation of bullish candles as the price recovers from the accumulation activities of institutional investors.
Source
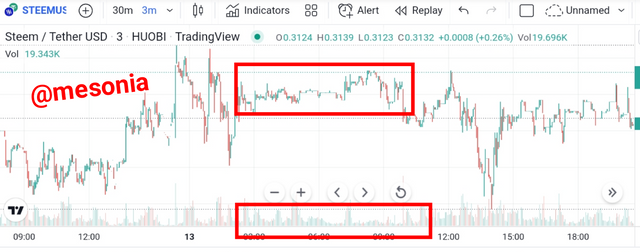
From the image above you will discover that the price has continued trending downwards as more sell positions are opened especially by retail traders who hope to jump into the downtrend before it ends. All of a sudden, the institutional traders begin to close their sell positions.
This profit-taking or buying activity of smart money which comes with large volumes eventually slows down the movement of price action. Since more retail traders are selling they are able to buy enough for their large orders due to the liquidity provided by retail traders.
The retail traders who are now feeling betrayed on their sell positions by seeing prices advance higher begin to close their positions with buy orders. These buy orders cumulatively act with the large buy orders of smart money and eventually push prices upwards.
As prices have broken to the upside, more buying activities create higher movements of price. When institutional traders who had entered early on the trend begin to take partial profits, there is a slowdown in the movement of price action. This is the re-accumulation phase. It is expected that price would resume its uptrend from here and break above the high of the accumulation range. However, the uptrend can only be invalidated in a situation whereby the swing low of the accumulation phase is broken downwards.
Distribution
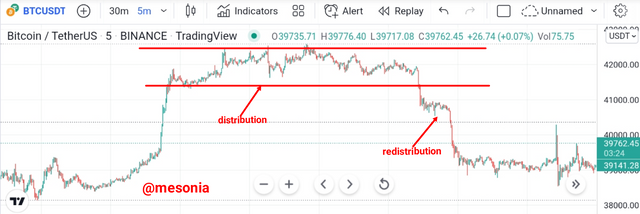
The distribution phase usually starts after the market has passed through a markup phase. This markup phase actually refers to the phase where a lot of buying activities had been sustained after the breakout of price from an accumulation range. The mark-up phase usually sees the participation of both retail and institutional traders who are now in all making profit from the bullish run.
However, the mark-up phase culminates into another period of ranging market as the asset enters into a period where it is sold for a long time. This is the very opposite of the accumulation phase. A popular pattern known as the head and shoulders pattern often appears as a very popular pattern for the distribution phase.
In this period the institutional traders that had entered at the phase of accumulation have begun to take profit on their positions. Due to the slow movement of prices as a result of large volumes of sales by smart money retail traders close their positions at some loss. As more sellers come into the market prices are pushed further downwards.
Source
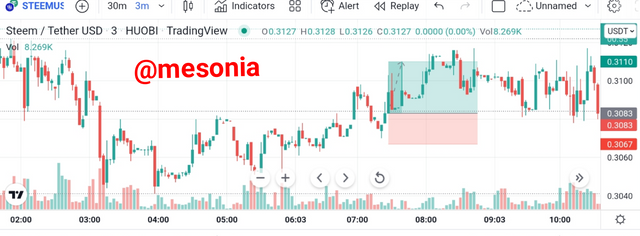
Usually, as the market continues downwards there is always - most often - a redistribution phase where the market pauses to create a new high in the form of retracement. This is always as a result of partial profit-taking by large traders and it is always a good opportunity to enter more sell positions.
Source
Ordinarily the downtrend is expected to continue from there. The downtrend can only be invalidated if the market breaks above the high of the phase of redistribution. However, the trend is expected to continue by breaking below the initial low of this phase.
Explain the 3 phases of the market and how they can be identified on the chart
Usually, the market comes in three different forms. These different forms are called market trend. It is very important to be able to understand market trends in order to correctly decipher when it has entered a state of non-trend known as sideways or ranging market. Most times it is possible to study and understand the trend by using trend lines market structure and - very minimally - indicators.
Let us take a look at these three possible different states of the market.
Uptrend
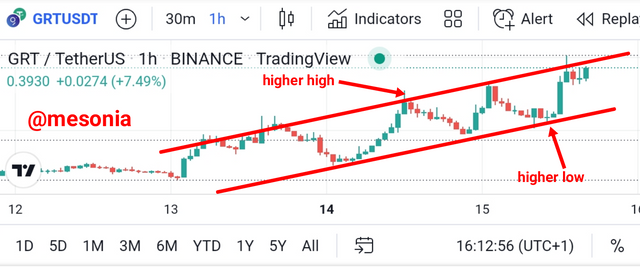
An uptrend refers to a situation where the market is observed to be moving upwards. In this case the term bullish is used to describe the state of the market due to the fact that a bull is an animal known to attack in an upwards direction. In an uptrend the market moves in an overall higher or upwards direction by creating higher tops (higher highs) and higher lows (higher bottoms).
For the uptrend to be considered to still be in place then the price must continuously keep making these higher swing lows and higher swing highs. If at any point of in time it is observed that the price begins to make lower swing highs or it starts creating lower swing lows, it calls to question whether the uptrend is still intact or it is now reversing into a downtrend.
Source
As observed in the image above the market repeatedly creates higher peaks and higher troughs which characterizes the bullish market. While the highest point is the peak the lowest point signifies the trough and each peak that follows together with its trough is always higher than the one that comes before it.
In this scenario the level of demand of the asset in the market exceeds the supply of it. So, according to the law of demand and supply the price pushes higher in order to bring an equilibrium to the system. The buyers can be said to be in control of the market. For this uptrend to be invalidated then the market has to break below a previous higher low created by the price action.
Downtrend
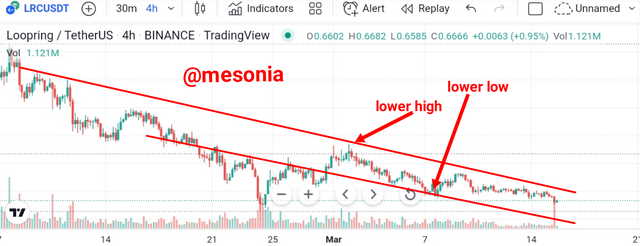
In a downtrend the market is observed to be moving downwards. In this case the term bearish is used to describe the state of the market due to the fact that a bear is an animal known to attack in a downwards direction. During a downtrend the market creates lower tops (lower highs) together with lower bottoms (lower lows) successively.
In this case a line can be used to connect two or more of the tops and this is called in downtrend line. This downtrend line can only be created by at least two tops. However, if more tops go into the drawing then the downtrend gains more confidence of traders as the directions seem to have been reinforced. The downtrend line can be recognised as the resistance line while the bottoms connected would be the support line.
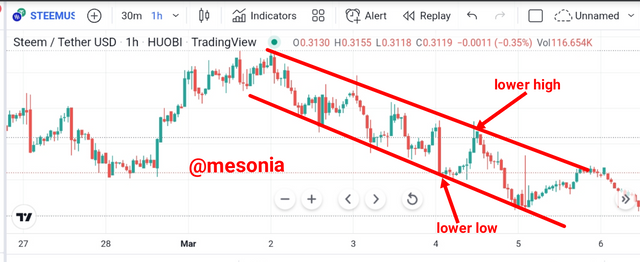
Source
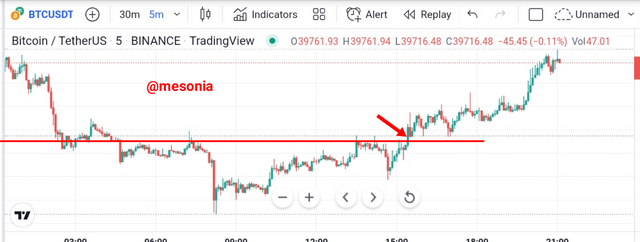
Here there seem to be a lot of supply in the market. The downtrend would be breached the moment demand comes in which outweighs the amount of supply in the market. In this case one of the tops or highs would be broken upwards and the market would often come back to retest the breakout of resistance. If it continues in the direction of the breakout then a valid upwards break is confirmed bringing an end to the downtrend in the meantime.
All the same, you should remember that trends may not always be straight perfectly. Consequently, an uptrend may be moving in a zigzag manner while a downtrend could also move in a non-linear manner. However, over time the market would be observed to be generally either going upwards or moving downwards to confirm the trend as a case maybe.
Sideways
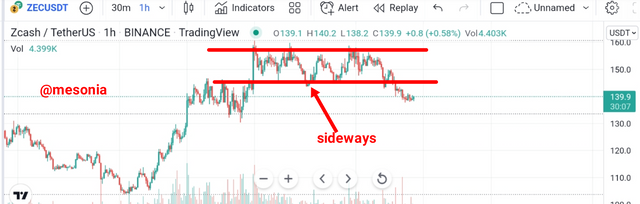
The sideways market refers to a situation whereby it is observed that the price of an asset is trading within a range that is fairly stable and is unable to form any clear trend in any particular direction over a period of time. Instead the price action is said to be oscillating within a channel or a horizontal range with neither the bulls nor the bears being able to control the movement of the price.
The price movement remains horizontal as the forces of supply and demand are at an equilibrium. Typically the market is said to be in a consolidation as it could either be a phase of accumulation or distribution in the market. This normally occurs prior to the establishment of a new trend. Hence, the price is moving in between strong support and resistance levels.
Source
This period could often last for a very long time as it is usually impossible for a trending market to occur over a prolonged period of time. As is also seen in the image above the sideways market remains non trending and choppy even though a series of upswings and downswings are created.
If the sideways or ranging condition of the market is observed to possibly last for a long time then traders can consider opening long positions at the support and going short at the resistance created in the range as price often reverts to an average mean.
Explain the importance of the volume indicator. How does volume confirm a trend? Do this for the 3 phases of the market (Screenshots required)
Actually, the trading volume refers to the total number of shares of a particular asset that was traded in the market over a particular period of time. The trading volume can be considered as a technical indicator due to the fact that it gives a picture of the overall activity that is going on with a particular asset in the market.
Hence, traders would often rely on the trading volume to determine whether there is a trend, a continuation or a reversal of the trend in the market. This has the ability of giving legitimacy to a particular market trend and giving investors the green light to either go long or short with an asset. The volume works differently in the three different market forms. This will be examined shortly.
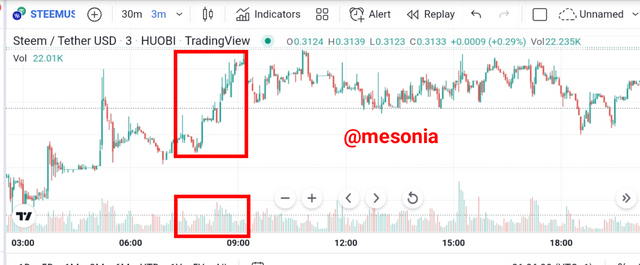
Bullish Phase
During a bullish phase or trend in the market the momentum increases and the trading volume equally increases as a confirmation that a trend is ongoing in a particular direction. Generally, price would move in a particular direction if the trading volume increases. So, when the price of an asset moves higher in an upwards market the volume increases with it.
Source
This can be observed in the image above. It is seen that the price of the asset has started moving higher upwards and the volume begins to increase as shown in the volume indicator. This confirms the fact that there is high volatility in the market currently.
When the market begins to consolidate without a commensurate reduction in volume then there is the likelihood that the uptrend will continue. However, if during the supposed accumulation phase in an uptrend it is observed that the volume becomes remarkably flat then there is the likelihood that there would be a reversal as there is no more momentum to the upside.
Bearish Phase
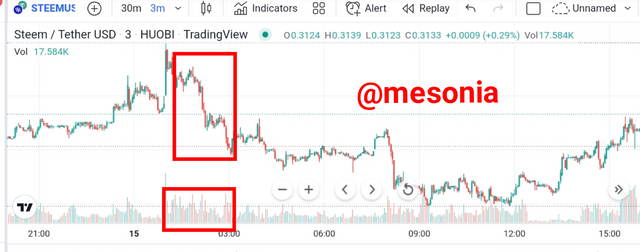
In a bearish market condition volatility increases. There is high momentum in the market to the downside. In this situation the trading volume which mirrors volatility would increase as a way of confirming the fact that indeed the market is trending in a particular direction - that is, downwards. When price moves in a particular direction trading volume always increases. Hence, as the price is moving lower the volume increases with it.
Source
In the image above it is seen that as the price starts moving lower the volume begins to increase as indicated. This is the confirmation that large momentum and high volatility has entered the market. If the market enters ranging or consolidation phase and the volume does not reduce, it is possible that the downtrend would resume shortly.
However, if the price continues hitting lower but a trader suddenly observes that there is disparity between the lower movement of price and the volume as the volume no longer increases then there is the likelihood that the downtrend is coming to an end.
Sideways
Source
During the sideways market the volume which is a very important indicator for trading mostly remains flat. This is due to the fact that the volume balances equally between the struggle of the bulls and the bears to prevail in the market. When a break out occurs then it could shoot up or shoot down in a sharp manner.
In a situation whereby a trading range that had been marked with low volumes suddenly experiences a breakout without volume increases then there is the likelihood that that could be a fake out. Assuming price breaks out of a low-volume consolidation accompanied with an increase in volume then traders should be keen on trading in the direction of the breakout.
Explain the trade criteria for the three phases of the market. (show screenshots)
Having identified the different ways by which we should be able to recognise the different phases of the market it is important to understand how we can safely trade these different market conditions. Nonetheless, it is important to remember that the best strategies for risk management and protection of capital must always be applied.
Bullish Phase
Once it is established that the market is in a bullish phase with the creation of higher highs and higher lows the following steps can be used in determining most profitable points for entry.
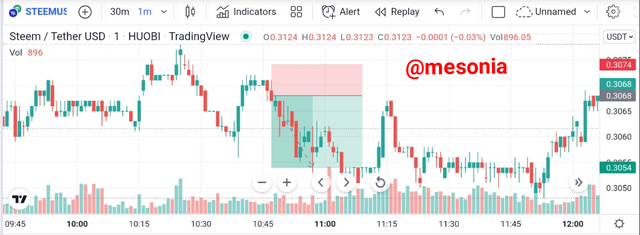
We should begin to first confirm that the market is indeed in an uptrend by observing to ensure that there is the creation of higher highs and higher lows together with an increasing volume signifying high volatility and momentum
We should patiently wait for the price to make a retracement thereby creating a low point. Once the price bounces back from the retracement and continues in the original direction, a buy trade can be entered with the formation of a bullish candle or any other bullish candlestick pattern.
To diligently manage risk, a stop loss should be placed immediately below the market swing low with a risk-reward ratio that favors the reward margin. A trade which offers more risk than potential reward should be jettisoned
This is illustrated in the figure below:-
Source
Bearish Phase
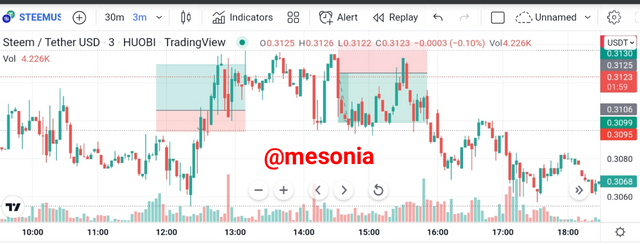
In the case of a bearish trend we should ensure that the market successively creates lower highs and lower lows with increasing volume
We should patiently wait for the price to make a retracement thereby creating a high point. Once the price bounces back from the retracement and continues in the original direction, a sell trade can be entered with the formation of a bearish candle or any other bearish candlestick pattern
To diligently manage risk, a stop loss should be placed immediately above the market swing high with a risk-reward ratio that favours the reward side.
This situation is illustrated in the image below:-
Source
Sideways Phase
Trading when the market is in a range or sideways phase may be quite risky. This is due to the fact that it is in this condition that smart money is most likely to manipulate the market.
However, should one decide to trade in this market condition, the trader should consider opening a short position at the resistance and putting a stop loss above the swing high of the resistance. On the other hand, he can open a long position at the support area with his stop loss placed below the swing low of the support level.
This is illustrated in the images below:-
Source
With the Trade criteria discussed in the previous question, open a demo trade for both Buy/ Sell positions
I am going to be carrying out this section with the tradingview.com paper trading demo.
Bullish Trade:-
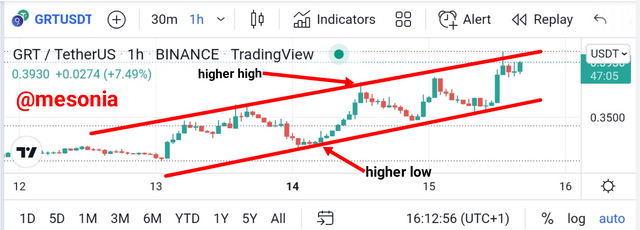
- For the bullish trade, I first observed that the market was in an uptrend by creating higher highs and higher lows with the one hour time frame
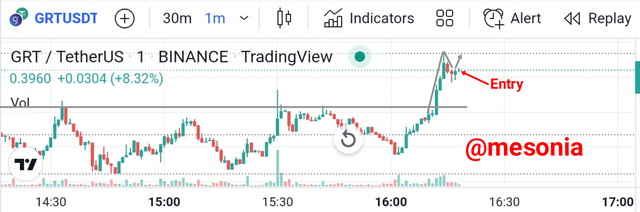
- I pulled in closer on the one minute time frame when I discovered that the market had broken a short-term resistance and had made a slight pullback for retest.
- I took an entry the moment bullish candles started forming accentuated with increasing volume
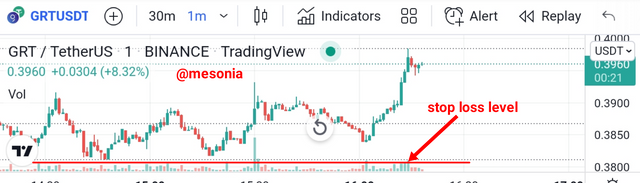
- I put my stop loss below the lowest swing low of the consolidation that had formed when the price came for a retest
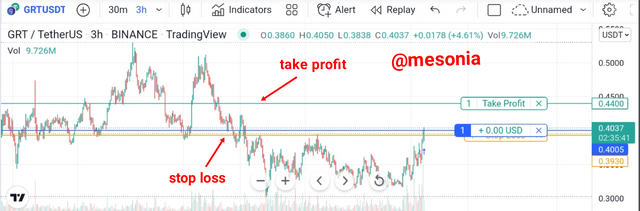
- I set my take profit with the 3-hour higher time frame where I was able to view the upcoming resistance
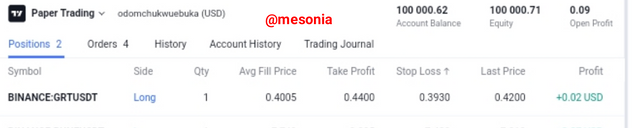
- As at the time of writing the trade was already in gain
Bearish Trade:-
- For the bearish trade I first observed that the market was creating lower highs and lower lows followed by increasing volume on the 4 hour time frame
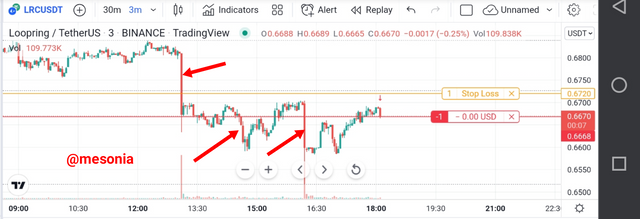
- I zoomed in on the 3 minute time frame and discover that the price had broken key resistance levels and had come up to retest that level
- I took a short entry with the formation of a strong bearish candle and set my stop loss above the swing high of the resistance being retested
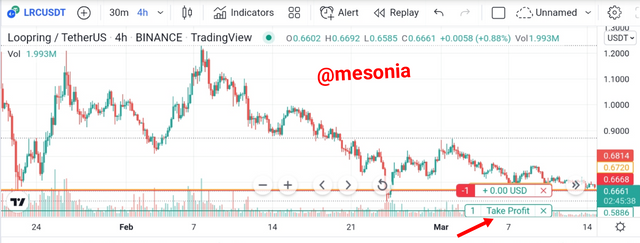
- I set my take profit in the direction of the trend having observed the upcoming support
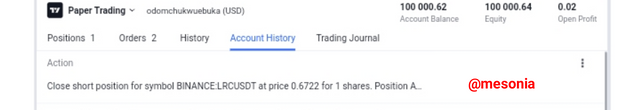
- As at the time of writing my stuff plus had been hit and 0.6722
CONCLUSION
It is important for traders to understand how to establish whether or not there is a trend in the market. After this we should be keen to observe whether the volume indicator supports high volatility and momentum as this would mean that the particular trend is gaining strength and likely to continue. Once this is done we should seek to establish the best ways and strategy to implement in the different kinds of market to be able to make profitable entries.
The market comes in different phases. In a bullish phase, we should always wait to enter long when a retracement has been made and the price bounces back upwards in continuation. The reverse should be the case in a bearish phase. In a sideways market it is best to stay away. However, if it is observed that this market is likely to last for a very long period, then you can consider going short at resistance and long at support. In all cases we should always be careful to diligently manage our risk.
Hello @mesonia , I’m glad you participated in the 4th week Season 6 at the Steemit Crypto Academy.
Unfortunately, i have noticed some plagiarised/spun contents in your work. You have copied and spinned contents from https://Babypip.com without acknowledging the source. We only tolerate original and quality content in the academy.
Plagiarised content.
Original content from https://www.babypips.com/forexpedia/dow-theory
Remark: Homework Task Disqualified
Cc: @kouba01
My apologies 🙇
I understand how unacceptable plagiarism is, it won't happen again.
Thank you.
Unfortunately @mesonia, your article contains Spun/plagiarized content.
The Steemit Crypto Academy community does not allow these practices. On the contrary, our goal is to encourage you to publish writing based on your own experience (or as per the mission requirements). Any spam/plagiarism/spun action reduces PoB's idea of rewarding good content.
Note: Any other try will mute you in the academy.