CRYPTO TRADING STRATEGY WITH MEDIAN INDICATOR - Steemit Crypto Academy- Homework post for Professor @abdu.navi03 by @mesonia
Edited with imarkup

Hello, everyone I welcome you to my blog again and I feel excited writing in response to the homework post given by professor @abdu.navi03. This post covers all about the median indicator which can be found on the tradingview platform. I will be explaining more about the indicator as well as its parameters and how to calculate them. Equally, I will show how it can be used to identify trends and how other indicators can be added to filter out false signals.
1-Explain your understanding with the median indicator.
The median indicator as a tool or instrument that can be applied on a cryptocurrency pair chart for the purposes of technical analysis is very helpful and plays an important role in making it possible for traders to identify the direction of the market as well as have ample information on the level of volatility in the market. Since it has a way of indicating the volatility in the market it means it can also help the trader to have a general idea of the volume that may have entered the market as well as the momentum.
Actually, the indicator functions as a channel based instrument that monitors the deviation of an ATR value. This ATR value is always observed to see how it deviates from the range of a middle value. Normally, the indicator is made to show a value which is actually a median value that is obtained by considering the average value which exists between the low and the high points over a period or length of time specified. Once the median value is known it is now compared to an exponential moving average(EMA) that is obtained over the same period or length of time.
Usually, a space exists between the EMA and the median value. This space occurs as a cloud that is coloured and the colour it displays depends on the value between the EMA and the median which is higher. When the median value is higher the cloud a green. The green cloud signifies the presence of an uptrending market. On the other hand, when the value of the EMA is higher it would show a violet colour which means that a downtrend is in place.
2-Parameters and Calculations of Median indicator. (Screenshot required)
There are a few important parameters and inputs that go into the creation of the median indicator. The indicator is encircled by bands and these bands obtain their basis from the Average True Range. The inputs and parameters that are available on the indicator include:-
The median source This is actually the source of data upon which the calculation of the median is done.
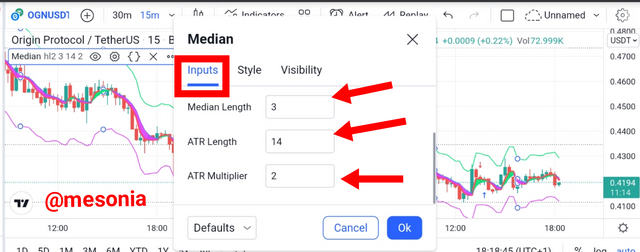
The median length:- The median length which is always 3 by default refers to the particular length that is chosen for the median value. Actually, this refers to the number of data points obtained from the median source which originally went into the calculation of the median.
The ATR length:- This refers to the period of time that is considered and utilised for the calculation of the Average True Range which goes into the median.
The ATR multiplier:- this refers to the number or the value that is used to multiply the ATR when producing the bands of the indicator.
The calculation of the median indicator simply refers to the calculation of the bands that go into each creation. To calculate the bands that are used in creating the median indicator we can take the steps below:-
- Obtain the value for the length of ATR to be used (by default, this is normally 14)
- Obtain the value of the ATR multiplier (by default, this is normally 2)
- Multiply the values from the first two steps above
- Add the product from step 3 to the median to obtain the upper band
- Subtract the product from step 3 from the median to obtain the lower band
Mathematically:-
Upper Band = (ATR Multiplier X ATR) + Median Length
Lower Band = (ATR Multiplier X ATR) - Median Length
To add the indicator to the tradingview platform you can follow the steps below:-
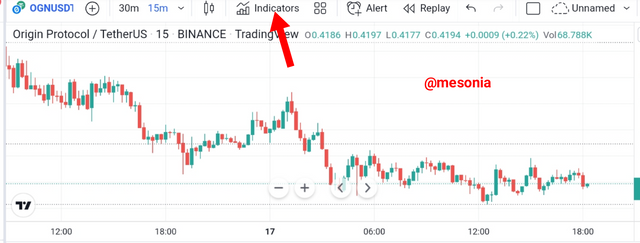
- First, click on the indicators icon
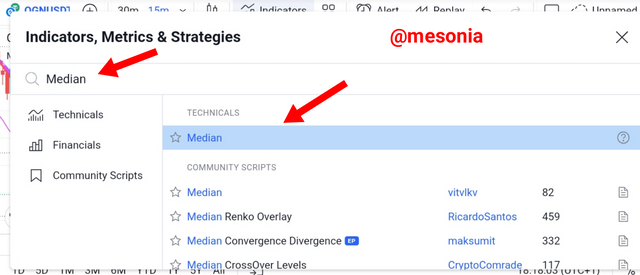
- From the search bar that appears type in median and select the first indicator that shows
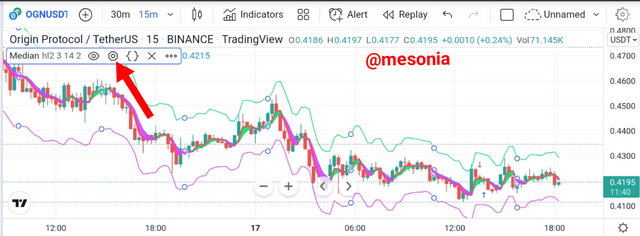
- This automatically adds the indicator to the crypto chart and to configure if you click on the settings tab highlighted on the body of the indicator
- The inputs settings gives you the opportunity to configure the median length, the ATR length and the ATR multiplier
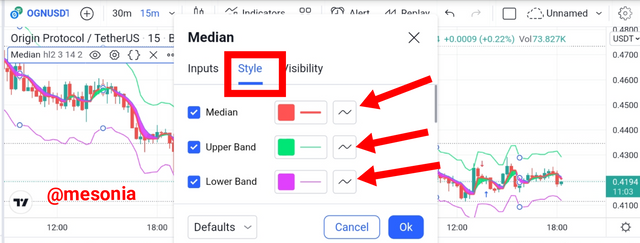
- The style settings gives you the opportunity to choose the colours of the median, the upper band and the lower band
3-Uptrend from Median indicator (screenshot required)
The median indicator works as a trend based indicator. Consequently, it has the ability to follow and identify the presence of a trend in the market. Being used as an indicator for the trending market makes it profitable since traders would normally gain the most when the market is moving in any particular direction.
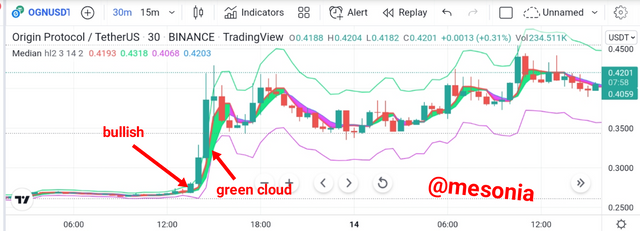
During uptrends the band of the indicator would turn green giving a signal for traders to go long. Interestingly, the indicator would follow all through the trend and also inform us when it has come to an end for exit. This makes it highly profitable as traders can ride all through the trend.
Source
By looking at the crypto chart above you will discover that the moment the market begins to push upwards due to high volatility and momentum of buyers the cloud of the median indicator quickly turns to green. Again, you will discover that the median line sits above the EMA meaning that the value of the median line is higher in the case of an uptrend.
4-Downtrend from Median Indicator (screenshot required)
The median indicator is also useful in identifying when a trend has shifted from an uptrend and the momentum and volume has started going in the opposite direction. This would mean that the volatility has shifted to the downside as there are now more sellers than buyers creating an exceeding quantity of supply to demand.
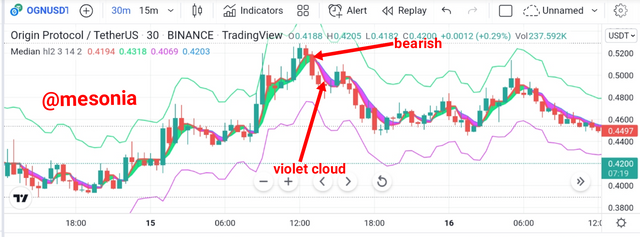
In the case of a downtrend the band of the indicator would normally turn violet telling traders to go short on the market. Another good side of the indicator is that it would follow throughout the downtrend and inform us when it changes to an uptrend for us to take the maximum profit and exit the market early.
Source
In the image of the crypto chart above you will discover that once the momentum had shifted from the upside to the downside and the market starts to push downwards the cloud simply turns violet. In this case the value of the EMA is higher than the value of the median line. So, the median line ordinarily sits below the EMA.
5-Identifying fake Signals with Median indicator(screenshot required)
The indicator can be used with other suitable indicators to identify places of potential false signal. This can be very vital especially when it comes to filtering out signals that suggest change of trend as most of the time people get caught on the wrong side when trying to trade trend reversals. There are different types of indicators available for use in the trading of cryptocurrencies. Often, it becomes necessary to combine different classes of indicators to help filter out the false signals from a particular class.
The median indicator itself is a trend based indicator. Since it is an indicator that follows trends it functions typically like every other moving average. Don't forget that moving averages are generally lagging indicators and may only follow after a signal has completed. Consequently, this indicator can be combined with other types of indicators like the RSI which is an overbought or oversold tool that equally helps to indicate volatility.
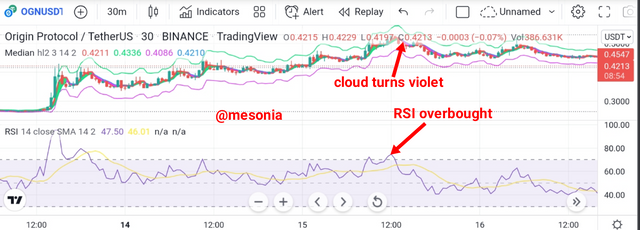
Hence, the median indicator can be combined with the Relative Strength Index (RSI) to help confirm signals and give high probable conditions for market reversal. The RSI has a midline which is marked 50. To the upside there is the 70 line above which an asset is considered overbought or overvalued. To the downside there is the 30 line below which an asset is considered oversold or undervalued.
Source
In the image above you will discover that the RSI can be used to confirm the reversal signal being given by the median indicator. At the time that the median indicator shows that a downward reversal is imminent and its cloud turns violet, the RSI equally shows that the price has entered above the 70 line showing overbought conditions and imminent reversal to the downside.
Source
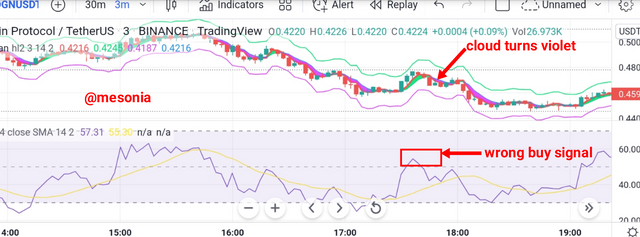
In the image above the line of the RSI crosses above the 50th midline. This is supposed to signify that an uptrend is gaining momentum and strength. However, the cloud of the median indicator actually turns purple in this case showing that although the market had shortly attempted a bullish run there was actually not enough momentum to push up the price of the asset. Hence, a downtrend was still in place, majorly.
6-Open two demo trades, long and short, with the help of a median indicator or combination that includes a median indicator (screenshot required)
I will be executing this section on the tradingview platform.
Buy Trade:-
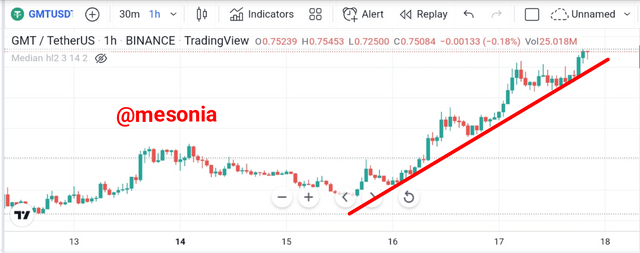
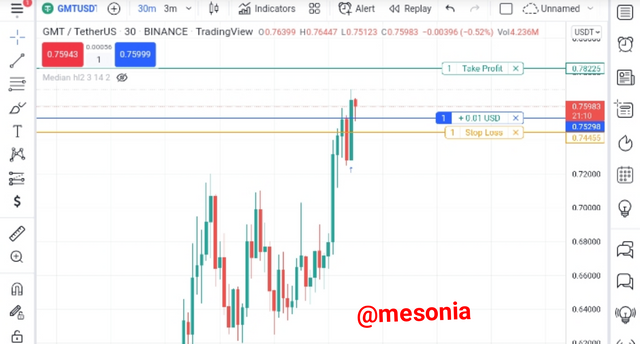
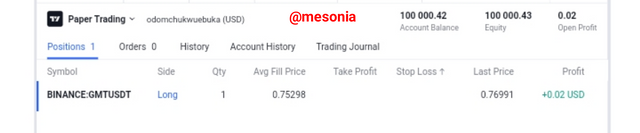
For the buy trade I observed the GMT/USDT crypto piar on the 1 hour intermediate time frame and discovered the market was creating higher highs and higher lows in a high rising uptrend. To execute the trade I checked the 1 minutes time frame and discovered that the cloud was green and RSI was also above 50. The RSI line was also above the SMA which showed the presence of an uptrend.
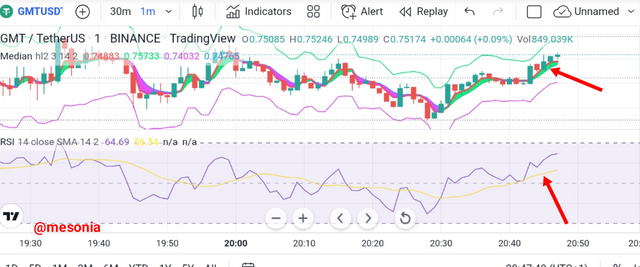
I took an entry at 0.75298 and set my stop-loss at 0.74455 while my take profit was up 0.78225. As at the time of writing the position was in some gain.
Sell Trade:-
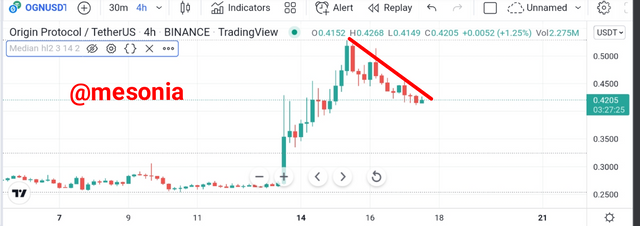
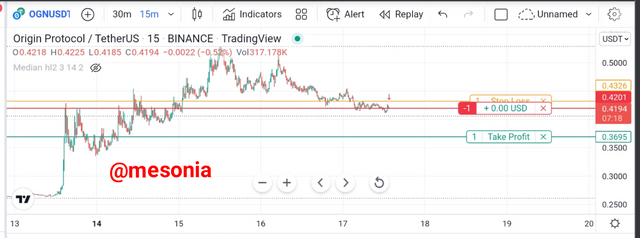
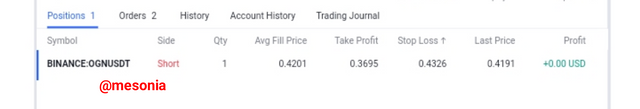
For the sell trade I observed the OGN/USDT crypto piar and discovered that in the 4 hour time frame there had been a strong downtrend that was creating lower highs and lower lows.
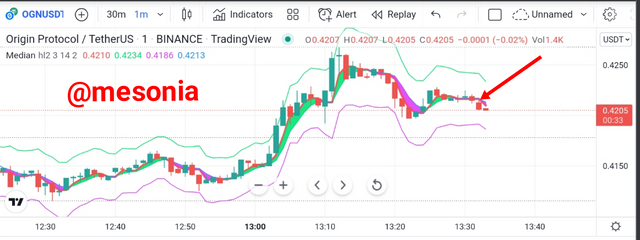
For execution I closed in on the 1 minute time frame and discovered the presence of a violet candle and I took my entry at 0.4201. I set my take profit as 0.3695 and my stop loss as 0.4326. When I was reporting the position was already in some gain.
CONCLUSION
The median indicator which can be found on the tradingview platform or any other platform which supports it acts as a trend based tools for technical analysis and traders. The indicator is actually EMA based and uses the ATR to derive its length. It monitors how the value of the ATR moves away or deviates from the median line to determine whether there is an uptrend or a downtrend in the market.
When the market is bullish the indicator would switch to a green cloud as it means that the median line now has a value which is higher than that of the EMA. Conversely, when the market is bearish the indicator would turn to a violet cloud meaning that the value of the EMA is now higher than that of the median line. Interestingly, the indicator can also help to determine a trend reversal and, hence, make it possible for us to know when to close our trades for the maximum profit and early exit from unfavorable markets.
The indicator can be combined with the RSI indicator in order to filter out false signals. Remember that the indicator is trend-based and the RSI is based on volatility. Hence, the RSI can help to tell us when the market is overbought or oversold. If the colour of the cloud of the median indicator should change accordingly in such market conditions, then a reversal of the trend should be highly anticipated.