Steemit Crypto Academy Season3 week2- Beginner's course| Introduction to Charts by @reminiscence01
Hello Steemains
Nice to be part of this week’s lecture.
Special regards to @reminiscence01 for a simple and interesting lecture, it's really an eye-opener for beginning traders.
INTRODUCTION
A trading chart is a graphical representation of the price movement of an asset in the market over a period of time. There are different types of charts used by traders some of which includes; Renko chart, Bar chart, Line chart, Candlestick charts. Out of these, the commonly used chart by traders is the Japanese Candlestick chart(a more comprehensive chart).
The Candlestick is an efficient trading tool used currently by technical analysts in cryptocurrency trading. This chart depicts the price of an asset in the market and indicates the sentiment of the market, showing who is in charge at a particular time, be it the buyers or sellers and with the candlestick chart technical analysts can tell the future price movement of an asset,this helps in making a better decision when trading.
1.Explain the Japanese Candlestick Chart? (Chart screenshot required)
The Japanese Candlestick is a type of technical analysis tool, used by traders create charts and analyze the price movement of securities in the market. The Japanese candlestick chart is an ancient trading chart invented by Munehisa Homma, a Japanese rice seller in the 1700's. The Japanese candlestick was developed by Homma to study and understand the price movements of rice market, as he observed that the rice market was influenced by sentiments, he then decided to develop the candlestick based on his understanding of Demand and Supply, as they are the major influence in a market.
Homma created the Japanese candlesticks that graphically shows the nature of price swings in the market, denoting by distinct colors(as seen on the chart). And traders makes use of this candlestick chart to discover price action patterns and make decisions based on the price's short-term direction, as the demand, supply, and distribution of products and services are clearly illustrated in a candlestick chart.
How the Japanese Candlestick chart works
The Japanese Candlesticks gives a more comprehensive price movement of an asset in the market within a period of time, as it graphically illustrate the level of supply and demand in the market, and telks the interaction between the buyers and sellers at a particular time over the price movement.
The Japanese candlesticks chart has four major parts, showing the opening, closing, high and low points of prices within a period of time. It is very simple for traders and investors to understand the price variation of a certain cryptocurrency using candlestick patterns.
Each candlestick has a center part called the body, which shows the distance between the open and close of the securities being traded. The opening price is at the top of the body, and the closing price at the bottom of the candlestick body.
The candlestick also has a shadow part. The upper shadow part shows the price difference between the top of the body and the high for the trading session. While, the lower shadow part represents the price difference between the bottom of the body and the trading period's low.
The body of a candlestick is used filled with colors like Red, Blue and Green for easy identification by traders, as traders choose from the varieties of hues to make better decisions in trading. The Red colour candlesticks indicates the upward movement of price, and the Green candlesticks indicate the downward movement of price of an asset.
2. Describe any other two types of charts? (Screenshot required).
▪︎BAR CHART
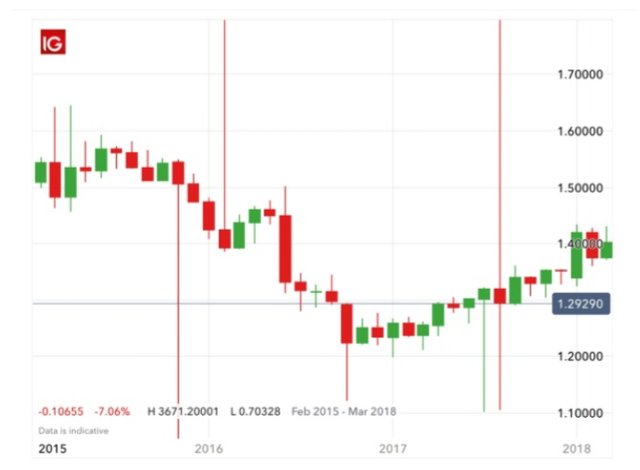
Bar charts are graphically representation of the price movement of an asset, indicating the up and down of prices with time, using multiple bars to indicate it. Bar charts have a horizontal line(representing the opening and closing price) and a Vertical line(representing the high and low prices), and each bar indicates the open, high, low, and close(OHLC) of prices within a period of time. Although this can be changed by a trader to show only the high, low, and close (HLC).
Bar charts are used by technical analysts to monitor price action of an asset and aids traders in trading decisions. Traders also use bar charts to study trends of price movement, identify and anticipate a potential reversal in trends and most importantly monitor volatility and price fluctuations in the market.
▪︎LINE CHART
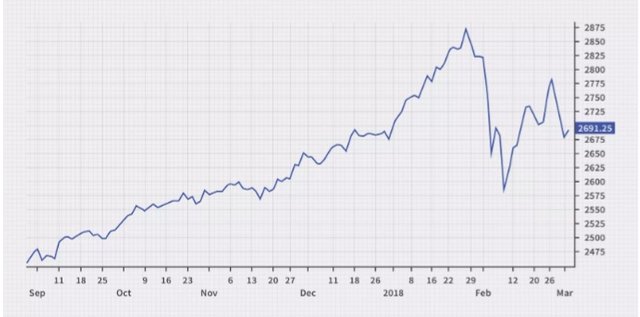
Line chart is also a graphical representation of the historic price action of an asset using a single and continously line. This chart is the simplest and basic type of chart used by traders(beginners inclusive) to monitor long-term changes in asset values. It basically illustrate the security closing price of an asset over a period of time.
Line charts are mostly used by traders to monitor the daily price changes in the trading market and can be used for any timeframe too, as it clearly depicts the resistance and support levels, and trend patterns of an asset.
3. In your own words, explain why the Japanese Candlestick chart is mostly used by traders.
The Japanese Candlesticks is mostly used by traders because;
• Comprehensive information
It provides a more comprehensive and accurate information of the price movement of an asset in the market, as opposed to the use of other charts by traders.
•Market Dierction
With Japanese Candlestick traders makes the best decision when trading, as they get a clear indication of the market price direction with the shape of the candlestick, as well as the color of the candles, which is an integral part of the Japanese Candlestick.
•Gives the current state of the market
With just a glance at the length and color of the candlestick, a traders is able to determine instantly the current state of the market, which means a trader can tell if the market is security is strong(becoming bullish) or weak (becoming bearish) instantly.
•Swift Identification of market patterns
Traders use Candlestick charts to quickly determine market trends and pattern at a particular time. It also indicates if the bulls or bears are in charge, as compared to other charts.
• For Future predictions
Traders are able to predict the future move of an asset with the use of Japanese Candlestick, as it is an ancient trading tool and gives the past trend of price value of an asset.
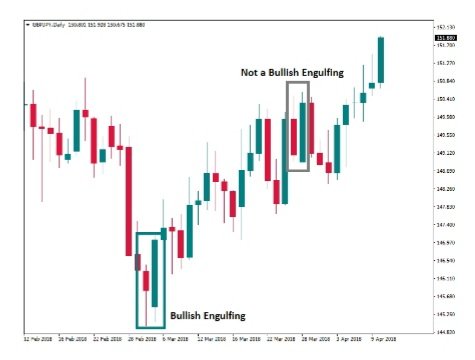
4.Describe a bullish candle and a bearish candle identifying its anatomy? (Screenshot is required).
It is important to know a bit about a candle before describing the bullish candle and bearish candle. A candle is composed of four major components(Open, High, Low, and Close) and two other parts(Shadow and real body) which includes;
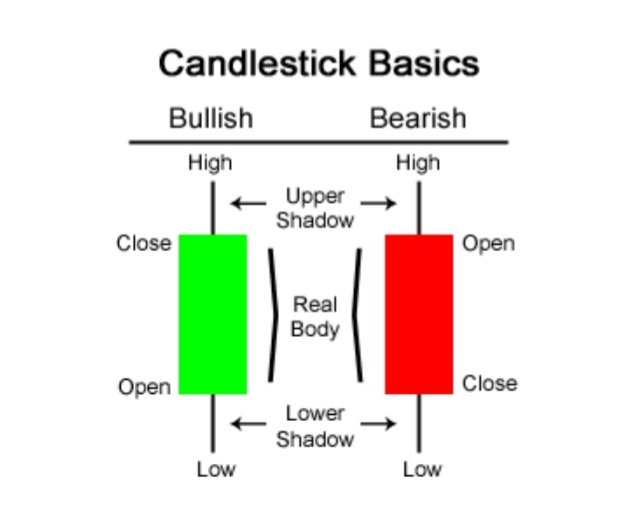
1. Open: The opening indicates the asset's trading price at the beginning of the candle within a certain time.
2.High: indicates the highest trading price of an asset and its the highest level in the candle within a certain time period.
3. Low: it demonstrates the lowest trading price of an asset, and is the lowest level in the candle recorded within a certain time period.
4. Close: it indicates the closing price of an asset, it is last trading price and completes the candle within a certain time period.
•Shadow: indicates uncertainty in movement of price, and shows the struggle between the buyers and sellers at a certain period of time.
•Real body: The real body of the Japanese candle shows the distance between opening price and closing price over a certain time period.
This is an upward moving candles which is either in Green or White colors. A bullish candle is one in which the opening price is lower than the closing price. The bullish candle opens below and closes above the real body, indicating that price value is rising upstream. For a bullish candle, the opening price is indicated below the closing price in the candle's body, indicating a rise in the price value of an asset within a certain period of time
The continuous formation of a bullish candle in a trading system indicates a continuous rise in the price value of an asset, and this is referred to as a Bullish Trend.
A Bearish candlestick denoted by a Red colour, is a representation of a decrease or decline in price of an asset. The closing price of a bearish candle settles and closes below the opening price, which indicates a downward movement of price and a decrease in value of an asset at a certain period of time.
The continuous formation of a bearish candle in a trading market indicates a continued decrease in the price value of an asset and this is referred to as a Bearish Trend.
The Japanese candlestick chart is an accurate and popular chart used by traders in monitoring the price movement of an asset or commodity in a trade market and . It is of importance that every Crypto trader must study and understand these charts as it will guide them in making good and profitable decisions when trading.
Thanks prof @reminiscence01 for a simple and interesting lecture, indeed have learnt alot about charts and trading with Japanese Candlestick chart.
cc;
@reminiscence01