Steemit Crypto Academy Season 3-Week 5 | Trading Crypto With Ichimoku-Kinko-Hyo Indicator - Part 2
Discuss your understanding of Kumo, as well as its two lines. (Screenshot required)
(KUMO) also known as the Ichimoku cloud is a combination/collection of technical indicators that represents support and resistance level in trends it also shows technical momentum of trends level that support traders to make technical decisive decisions when executing or making appropriate trade entry.
It gives traders trend direction by showing future trend movement of the price chart in the market trends, it is used to prepare traders against high and low market volatility and high liquidity in the market.
With Kumo cloud trends line direction can be plotted on an average chart which can be used to forecast where the market price might find support and resistance.
The Kumo Cloud is also a key indicator that can signal a buy and sell entry in the market when the price is above the cloud it signals a buy entry and when below it signals a sell entry although traders need to wait for a more clear confirmation before making any alternate entry
It can also be observed that during an uptrend the cloud moves in an upward direction and for a downtrend, it is quite the opposite.
What does Kumo Cloud represent in trading
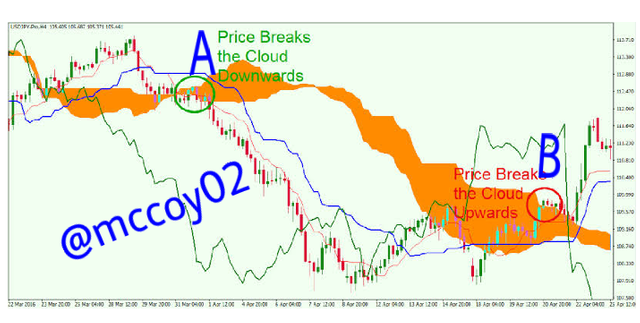
*The chart above shows a typical illustration of the Kumo cloud following the market up and downtrend the circle A" shows a breakdown in price after the price breakout below the cloud and Circle B shows price breaking the cloud in an upward trend.
It shows important trends information at a glance by calculating trend lines average and represents a market equilibrium.
Entry buy signal shows when the price is above the cloud and below when it's below the cloud signals a sell entry.
The cloud level can be used to represent support and resistance that can be projected in the future.
The Kumo line Span A and span B
Senkou Span A
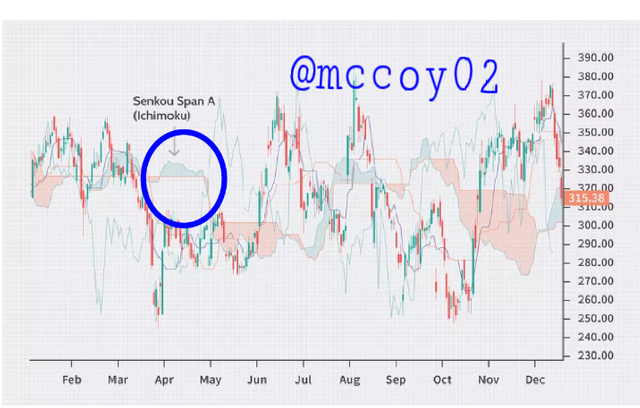
The Senkou span A is also known as the leading span used to predict the historical future, of a market trend by using historical data it can be plotted using 26 periods into the future which is used to show where support and resistance will be expected in the future.
The senkou span A works in conjunction with span B which combines to form the Kumo could, and is used to provide traders ideas base on market support and resistance.
When the senkou span A takes the top position in a trend it indicates a bullish signal.
Senkou Span B
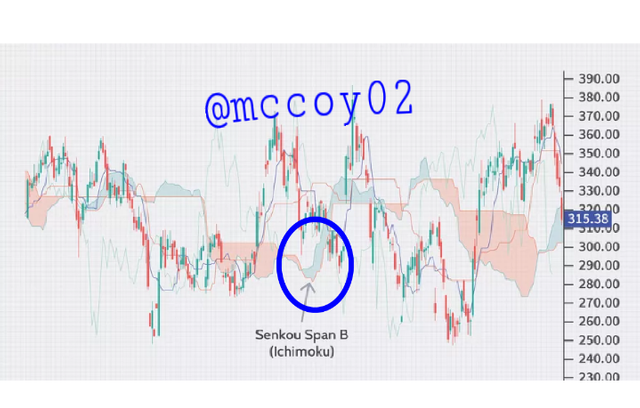
As earlier said both spans A and B work in conjunction although calculating span B varies from span A, here using 52 periods of data ((52-period high + 52-period low) / 2)
It is used to show support and resistance when the price below the cloud represents resistance while above the cloud shows support.
The separation/space between span A and B is what produces or represents the Kumo could.
What is the relationship between this cloud and the price movement? And how do you determine resistance and support levels using Kumo? (Screenshot required)
The price relationship between cloud and price movement can be represented/indicated from the historical data or cumulative calculation of the average momentum signals that are generated according to the price baseline and conversion line ( this means a trader can mark his support and resistance on the trend chart by locating market movement price a quick movement of price above/below Kumo cloud can represent a bull/bear run or price correlation )
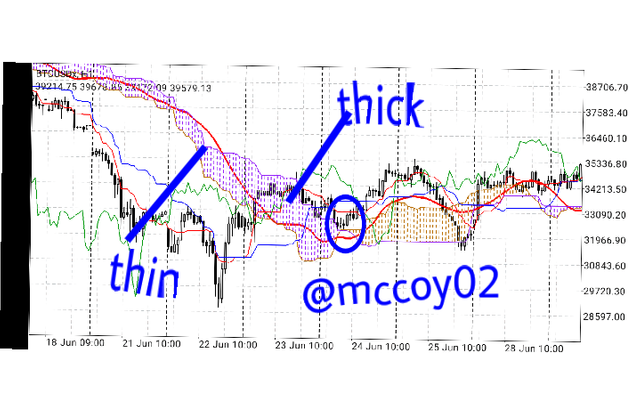
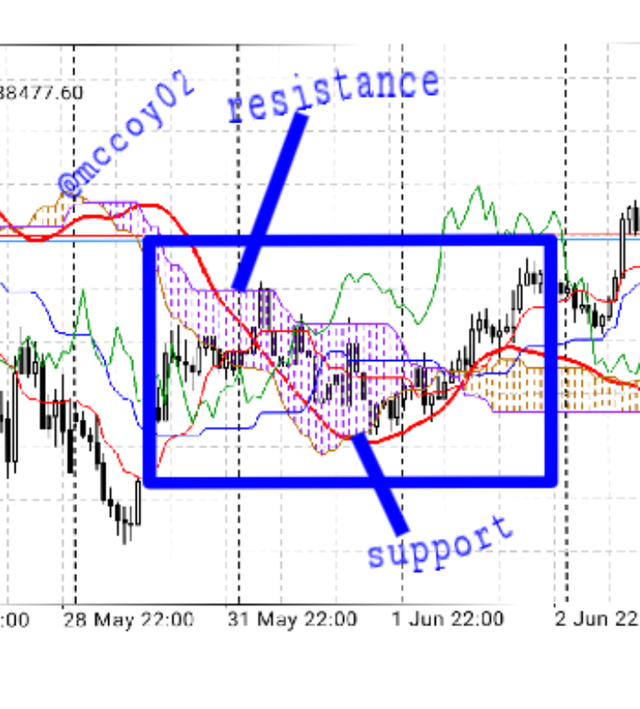
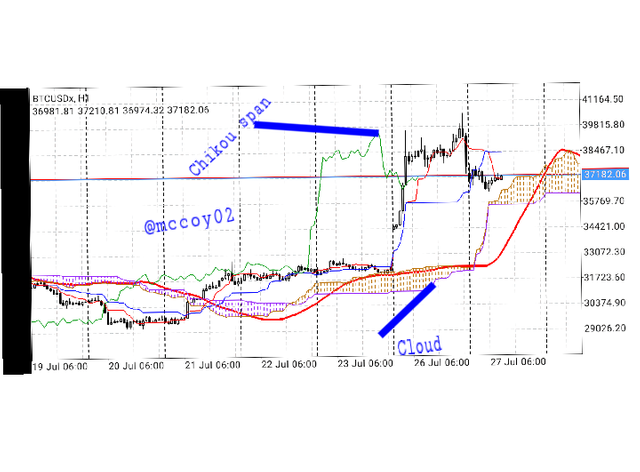
Also, the price movement relationship can be represented on the Kumo cloud base on the cloud thinness and thickness when there is high price volatility in the market the cloud tends to expand or becomes large and when volatility is less the Kumo cloud becomes thin.
The chart above is taken from my mata4 trading app shows how price volatility was represented using the cloud thinness and thickness it can also be observed how the price movement breaking out from the cloud indicated a bull market.
Determining support and resistance using Kumo
Just like other trading indicators Kumo support and resistance are great tools used by traders to take advantage of the market price movement.
The Senkou Span A can act/indicate as a support line during an uptrend and as well act as a resistance line during a downtrend in this case the price chart candlestick tends to move closer to span A here also the Senkou span B can also ack as support and resistance this all depends on the projected period and price level movement either away or moving toward the cloud will determine how a trader can mark his support and resistance level.
Traders in most cases determine Kumo support and resistance based on its shape and size.
How and why is the twist formed? And once we've "seen" the twist, how do we use it in our trading? (Screenshot required)
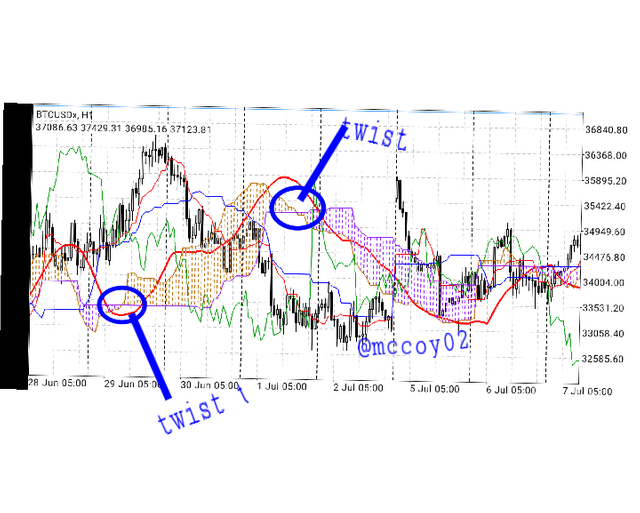
In Kumo Cloud trend a twist is formed when Senkou Span A crosses the Senkou Span B formed at a junction.
A bullish trend can also be indicated when Senkou Span A crosses span B from below, the reverse happens for a bearish trend.
In general, the twist is formed in Kumo to represent a potential change in the signal can be a reversal signal or price correction, or correlation.
Since the twist are used to signal a trader to be ready for either price entry or exit in a trade a trader can use the twist to take proper advantage of the market price movement with this tool he can know when a price will reverse or correlate while taking a position or exiting a position on any trade.
The screenshot above shows a typical example of a Kumo twist taken from my mata4 trading app it can be observed from the screenshot each time a twist has formed the price of BTC/USDx makes a quick move for the first circle twist a quick uptrend was seen while the second circle twists a quick downtrend this shows a twist can quickly signal a trader there will be a change in price movement.
What is the Ichimoku trend confirmation strategy with the cloud (Kumo)? And what are the signals that detect a trend reversal? (Screenshot required)
What is the Ichimoku trend confirmation strategy with the cloud (Kumo)
It can be deducted traders use different strategies and approaches when reacting to a market trend also an important role the Ichimoku trend confirmation strategy plays is it can be used to confirm market price movement without the use of other subordinate lines here a trader can only use the Kumo cloud and make important market entry and decision without taking other lines or colors into consideration.
In general Ichimoku trend confirmation strategy with the Kumo cloud is when a trader makes important price entries such as buy/sell any position using only the cloud as a point of reference.
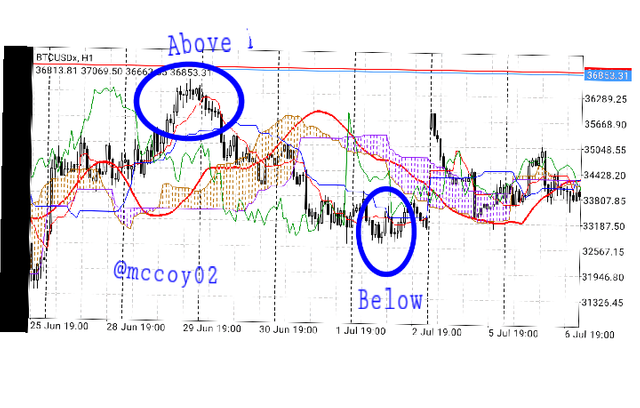
Typical example, a price movement above the cloud indicates a bullish price move and a price below the cloud shows a bear price move.
As can be seen from the above screenshot how price responds to the cloud changes price above the cloud shows a bullish trend while below the cloud shows a bearish trend move.
Signals that detect a trend reversal
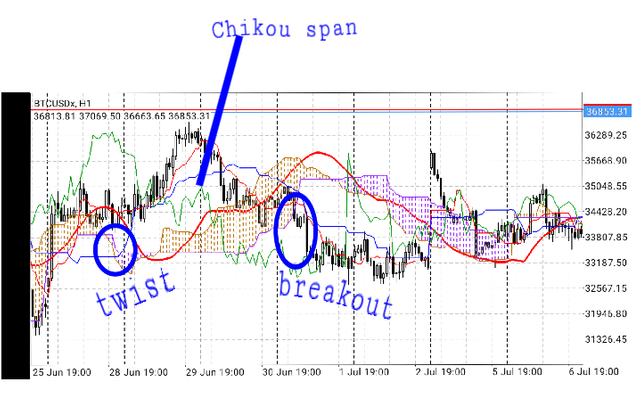
For any trader to detect a trend reversal on the Ichimoku trend, some factors need to be put into consideration twist is a basic confirmation one needs to watch out for although it can be seen a twist can signal a false breakout which means traders will need others confirmation signal to detect a trend reversal like breakout this breakout can be a bullish/bearish signal that occurs when price breakout from the cloud depending on the direction of the price breakout and also depends on the position of the Chikou span the direction of the price breakout when it's in line with the future cloud it can signal a strong signal and if it's not it is considered the opposite.
When a clear twist, real price breakout, Chikou span direction movement, and cloud sync signal are located on a trend this can give a trader an affirmation to make either a buy/sell entry in the market price movement
The above screenshot shows a trend twist, Chikou span inline with the downtrend cloud, and a breakdown of the price from the cloud.
Explain the trading strategy using the cloud and the Chikou span together. (Screenshot required)
The Chikou span is also known as the lagging span it can be used to represent candle closes in price movement in a market trend because it is used to represent X period in the past this is why it is called a lagging span.
In trading strategy the position of the Chikou span together with the cloud is an indication or representation of price strength for the current market price trends
So in general when the the Chikou span is showing a strong trend signal along with the cloud it tells a trader there will be a strong trend move and in reverse, a weak Chikou span represents a weak trend signal.
Also interaction between the he Chikou span and the cloud can be used to indicate support and resistance in a trend.
Above is a BTC/USDx taken from my trading app it can be observed how the Chikou span showed a strong strength that and also the cloud thickness was increased this made the price of BTC move upward in price the graph represents the recent move in BTC price.
Explain the use of the Ichimoku indicator for the scalping trading strategy. (Screenshot required)
It should be noted trading with Kumo indicators requires a high timeframe using a minute timeframe can give a trader a false breakout in trades.
The use of the Ichimoku indicator in trading is it can be used to show dominant trends in the market, it shows the strength of a trend, it can be used to give traders trade signal and lastly, it can be used to provide reliable support and resistance in the market trends.
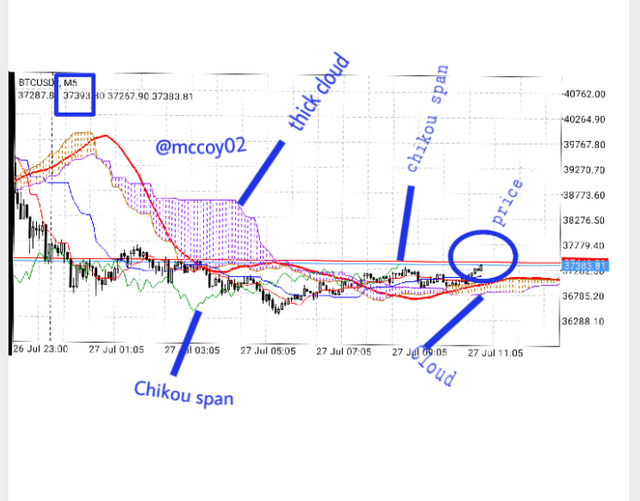
The above screenshot is a 5-minute timeframe BTC/USDx chart from my mata4 trading app.
The above information shows thickness in Kumo cloud indicates there will be high price movement blow the thick cloud shows the Chikou span which confirms strength in the price movement moving forward it can also be seen the price of BTC is above the cloud also giving a clear confirmation of a bull run.
with the above information, a trader doing scalping daily timeframe trade can open a buy entry immediately or slightly below the circle.
Conclusion
Trading with the Kumo cloud and Ichimoku indicator can be a very good strategy for traders to take proper advantage of the market trends since it can be used to show the present, future and, history of price movement at a glance proper understanding of this chart can help improve traders skill of maximizing profit in the market.
Importantly a trader should always watch out for false breakout and wait patiently by observing and putting all necessary technical indicators into use before making trade entry.
