Homework task season 2 week 8 by professor @kouba01 Bollinger bands
Define the Bollinger Bands indicator by explaining its calculation method, how does it work? and what is the best Bollinger Band setup?
What is Bollinger bands indicator
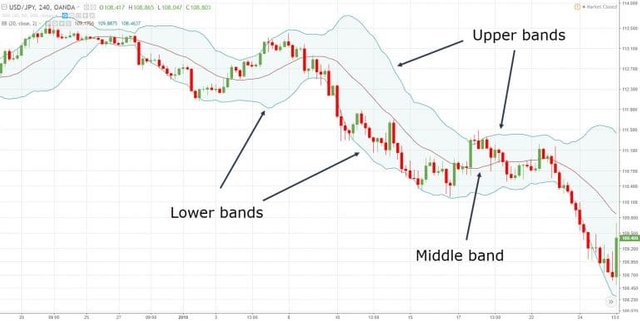
source
Bollinger bands are trading indicators that are used in trading/investment activities for checking market trends and movement.
It supports traders to make some certain movement in the market trends by identifying market volatility, support, and resistance market price reversal as well as helps traders to make a certain special entry in any market activities like setting appropriate position when and how to exit a particular market base on moving volatility of such market.
In a very simple term, Bollinger bands are used to measure market volatility, for example, it shows traders when a market is in an uptrend or downtrend by contracting or expanding its bands.
Calculation methods of Bollinger bands
Calculating Bollinger bands will need the incorporation of two formula which includes traders first knowing what the market moving average and then additionally add up the Bollinger formulas
For moving average the formula is Moving Average = Sum of prices over x days/number of days
On successfully having the moving average base on traders trading strategy they can choose to use 20 days which will need using a standard deviation of 2 or 10 days which will need a standard deviation of 1.5
So to calculate the Bollinger bands a trader will need to first calculate the moving average of the market and then choose either chose a standard default of 20 days with 2 standard deviations or make adjustments of any day of his choice.
How does Bollinger bands work
Bollinger bands allow traders to simply identify the moving average of either cryptocurrency or other commodities by connecting them to a band which makes it easy to identify support and resistance of such commodity and also up and downtrend of any particular commodity.
It works to use the moving average of a commodity as well as incorporate the volatility of that commodity.
So in essence Bollinger band works to show a trader the market moving average and volatility of the market all in one place.
What is the best Bollinger setup
The best setup will only depend on traders' trading strategy by making use of the appropriate days and standard deviation.
What is a breakout and how do you determine it? (Screenshot required)
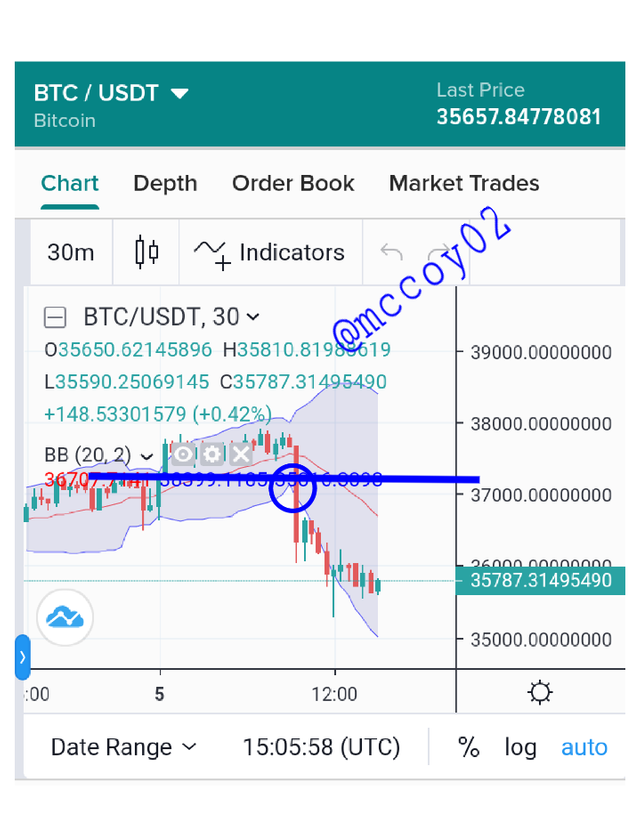
A breakout is seen in a trading pair when a price of a particular pair moves above or below the support and resistance level.
When there is certain pair I will be using the BTC/USDT pair to show an example of market breakout.
The above screenshot is taken from my poloniex trading web app shows a bearish pattern move in BTC pair it can be seen the lower band a candle chart pass through the band and it continually fell after the breakout.
A breakout happens when there is confirmation of price continuously moving up or down a trend.
How to use Bollinger bands with a trending market? (screenshot required)
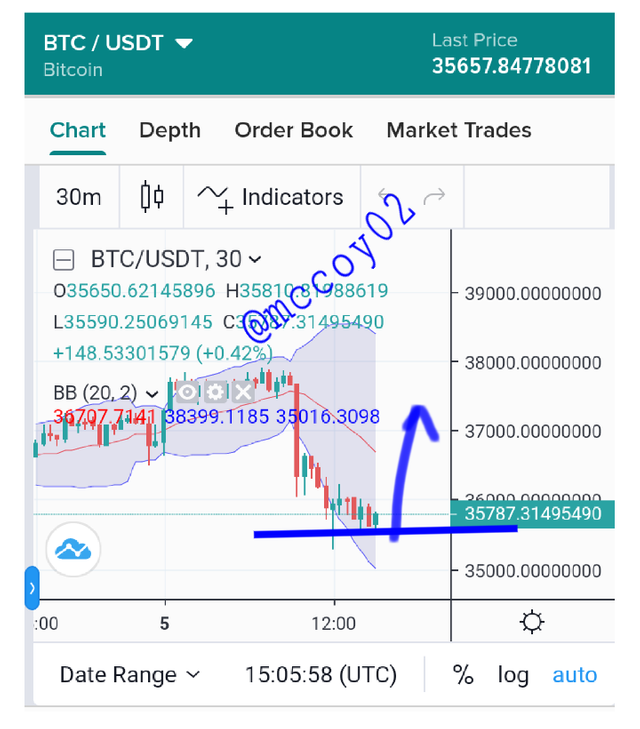
Above is the current price of the BTC/USDT pair as of the time of writing this post if a trader will follow the Bollinger band strategy there is a clear confirmation the sellers will be taking profit and exiting the market allowing the buyers to start taking over the market.
With the above chart, it can be seen that the Bollinger bands can be used to know the possibility of when traders will start booking profit on a particular market trend to get ready for a new position.
What is the best indicator to use with Bollinger Bands to make your trade more meaningful? (Screenshot required) (Screenshot required)
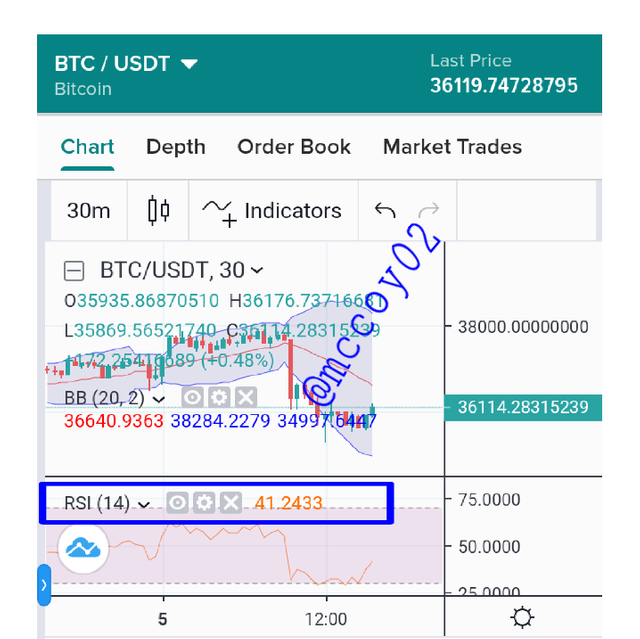
Relative strength index (RSI) is a technical indicator that is used for knowing the market trends it can be used to show when the market is in an uptrend or downtrend it can also be used to show who is dominating a particular market either the buyers or sellers.
The RSI has a number range between 1- 100 when it shows a range above 60-70 it means that the buyers are taking over the market and the market is in an uptrend.
Also when it is showing a range below 49-30 means buyers are week and the market is in a downtrend.
Using Bollinger Bands and RSI will give a trader some clear certainly of how the market is moving for me using RSI and Bollinger will make my trading meaningful.
The above chart shows two technical indicators Bollinger bands and RSI it can be seen that the RSI is in the range of 41.2 which shows that the buyers are week and sellers are dominating the market.
What timeframe do the Bollinger Bands work best on? And why? (Screenshots required)
Choosing a timeframe on Bollinger bands will depend on traders' best trading strategy for day traders a timeframe between 15-30 minutes will be best recommended.
For swing trade daily or weekly timeframe will be good.
Day traders will need a smaller timeframe because it can help them make a quick analysis of the market movement and also with a short time frame RSI will correspond to a trader trading chart.
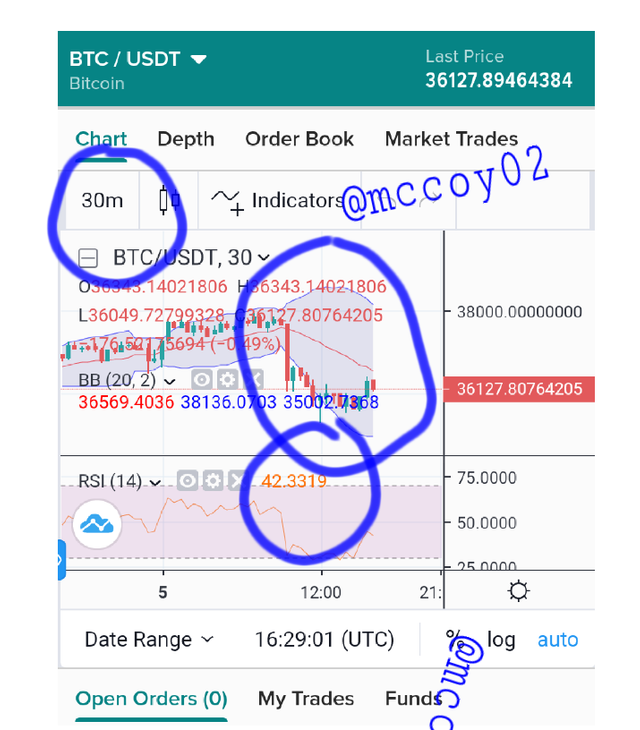
Above is a 30-minute timeframe chart it shows high market volatility indicating sellers are dominating the market with an RSI of 42
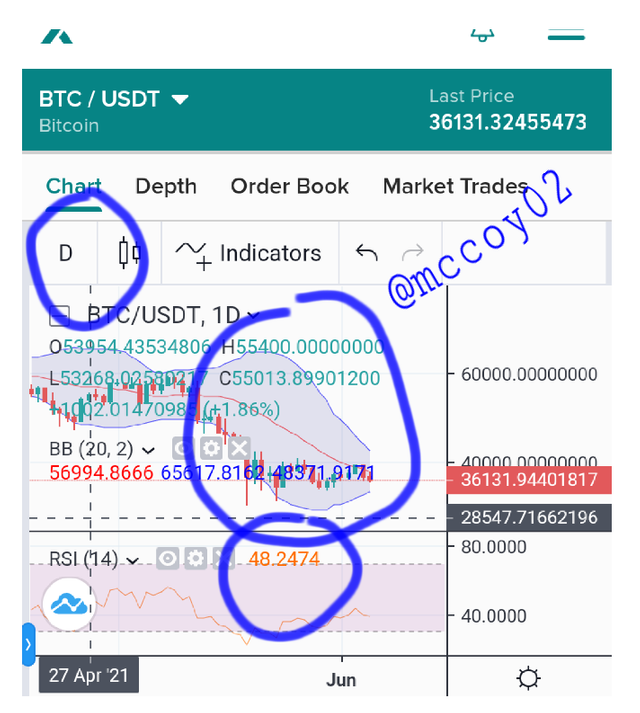
While for the daily time frame the Bollinger bands seem contracted to show sellers are getting weak and RSI has increased to 48
With a short timeframe, traders can make a profit faster.
Review the chart of any pair and present the various signals giving by the indicator Bollinger Bands. (Screenshot required)
The above chart is BTC/USDT pair from the Bollinger chart it can be seen that the market is in a downtrend with the majority of the chart moving towards the lower band
Using knowledge gain from the class can be seen there is a high possibility of market reversal and the buyers can be taking over the market.
Conclusion
Bollinger band is a very useful technical indicator tool that supports traders to know how/where the market will be moving it uses moving average combine with volatility movement of a particular commodity to anticipate market movement.
Combining Bollinger Bands with RSI can help a trader have more clarity on the market trends.
Traders can choose any time frame that suits their trading strategy to trade Bollinger bands.
Hello @mccoy02,
Thank you for participating in the 8th Week Crypto Course in its second season and for your efforts to complete the suggested tasks, you deserve a 5/10 rating, according to the following scale:
My review :
Work with medium content, you did not delve into the analysis of the answers, as you provided only scattered information without explaining it well.
Thanks again for your effort, and we look forward to reading your next work.
Sincerely,@kouba01
Thanks for the feedback