Homework task 4 season 2 by professor @kouba01 relative strength index (RSI)
A very interesting topic by professor @kouba01 thanks for sharing with steemitians an important trading tool thanks to @steemitblog for such initiative.
What is the Relative Strength Index - RSI and How is it Calculated?
RSI is a technical analysis trading tool/indicator scaling from 0 to 100 used by traders to know when there is high market buying/selling it helps traders know when there is market oversold/overbought with relative strength index traders can easily dictate a market uptrend or downtrend.
When the RSI shows or reads above 70 it means there is high demand for buying in the market while reading below 30 shows there is low demand which indicates sellers are dominating the market.
With RSI a trader can easily keep track of market movement by scaling what range the RSI falls if below or above 50.
It can also be used to indicate overbought and oversold conditions in the market.
Although traders will not completely rely on RSI as sometimes there can be a fake breakout which can lead to uncertain movement of RSI.
How to calculate RSI
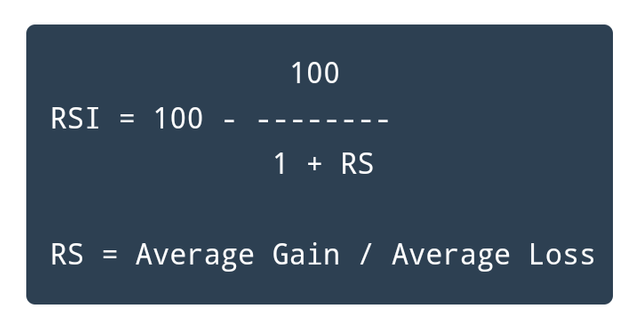
Where RS from the above image represents Average gain/Average loss
RS = average gain/average loss
14 = period/days is a constant value used for completing RSI calculation.
In other to make the calculation 14 days intervals will be taken into consideration.
Average gain = sum of gains over the past 14 days/14
Average loss = sum of loss over the past 14 days/14
So let's say data for loss and gain for the past 14 days were recorded by a trader he/she can be able to compute the RSI by inputting all the appropriate data.
example
The average gain for 14 days = 50, 60, 70, 55, 64, 66, 76, 59, 64, 55, 57, 58, 64, 58.
The average loss for 14 days = 35, 49, 25, 47, 23, 14, 35, 12, 43, 39, 47, 34, 43, 12.
Sum of average gain = 856
Sum of average loss = 458
From our formula RS = average gain/average loss = 856/458 = 1.8689
RSI = 100 - 100/ 1 + RS
where RS = 1.8689
Using our formula
RSI = 65.14
Note from my data I used numbers above 50 for my gains and numbers below 50 for my loss.
Can we trust the RSI on cryptocurrency trading and why?
RSI will be very useful for day trading where a trader will be able to stay active in the market and take profit daily.
Looking at RSI on long-term trading can easily mislead a trader as a newbie.
Also, a trader can not depend only on the RSI indicator if they want to make successful trading, a false market trend can alter the movement of RSI leading to a false breakout.
As a day trader, I normally take advantage of RSI, I don't solely depend on the RSI as I need to make other market technical analyses and compare them with the market current or previous RSI.
We can trust RSI if only it can be compared with other technical tools before trading.
How do you configure the RSI indicator on the chart and what does the length parameter mean? Why is it equal to 14 by default? Can we change it? (Screen capture required)
I will be using a meta5 trading app to show how to set up RSI
By selecting any currency of choice I will be using EUR/USD.
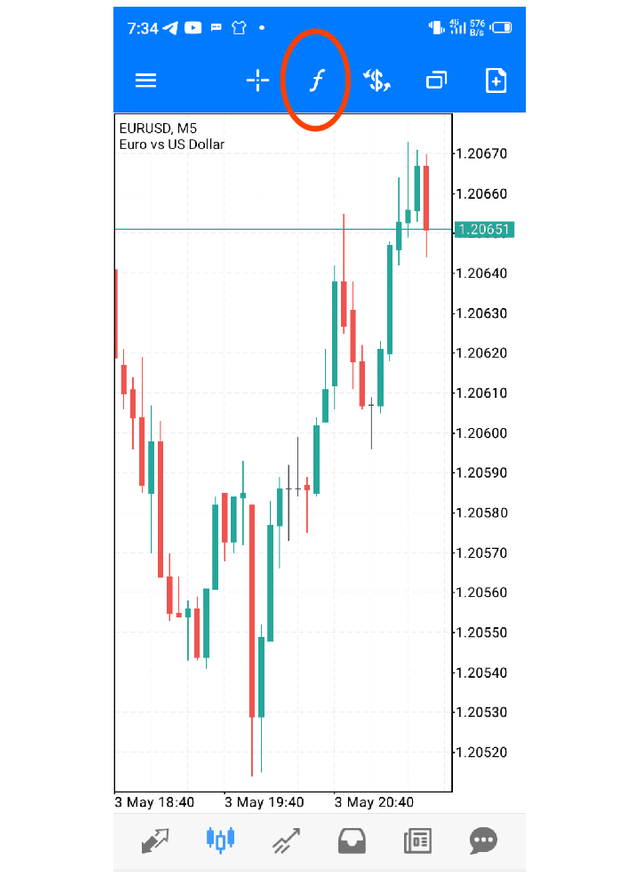
Select Chart and click on the f sign from the top corner of the chart
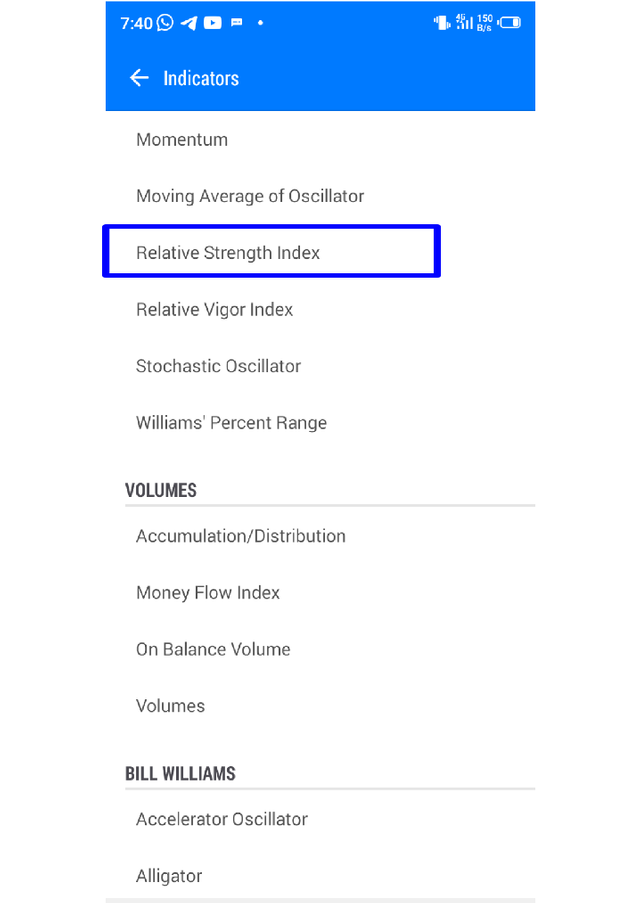
And search for the Relative strength index and select it.
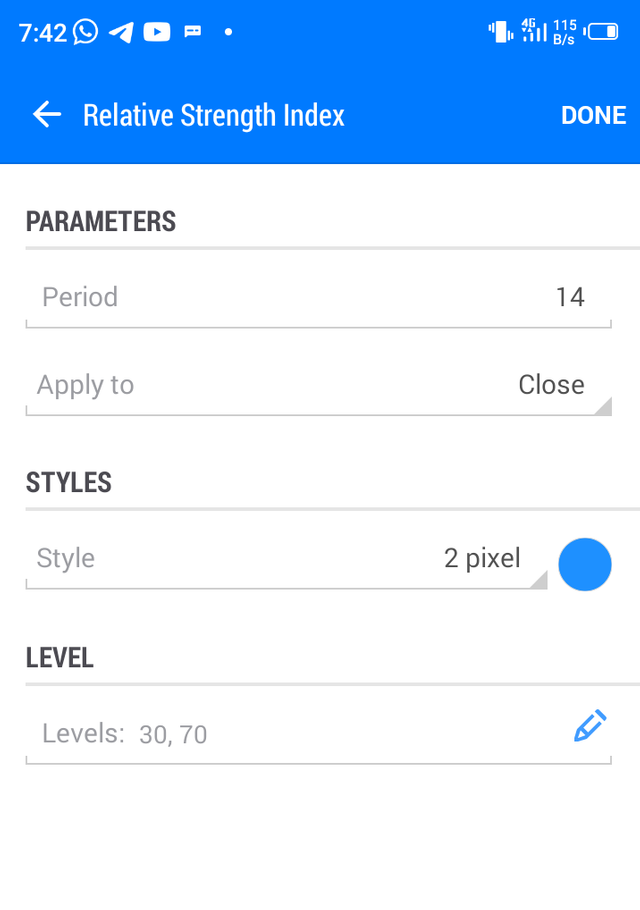
Inputs your preferred value which will be displayed on the chart by clicking done.
length parameter is used to show how stable RSI will be in the market, it can be used to show how fast a market will move up and down.
The default settings 14 can be changed by a trader it depends on his trading strategy.
How do you interpret the overbought and oversold signals when trading cryptocurrencies? (Screen capture required)
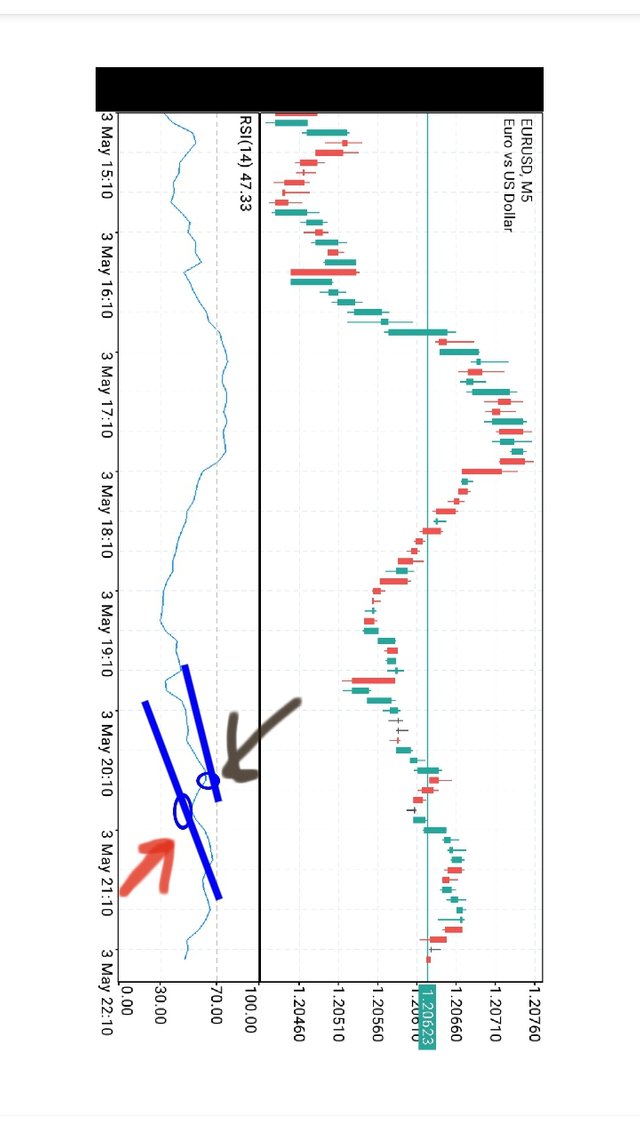
The chart above shows an RSI showing the overbought and oversold price or demand in EUR/USD pair
The black arrow shows or indicates overbought while the red arrow indicates oversold from the RSI chart.
How do we filter RSI signals to distinguish and recognize true signals from false signals. (Screen capture required)
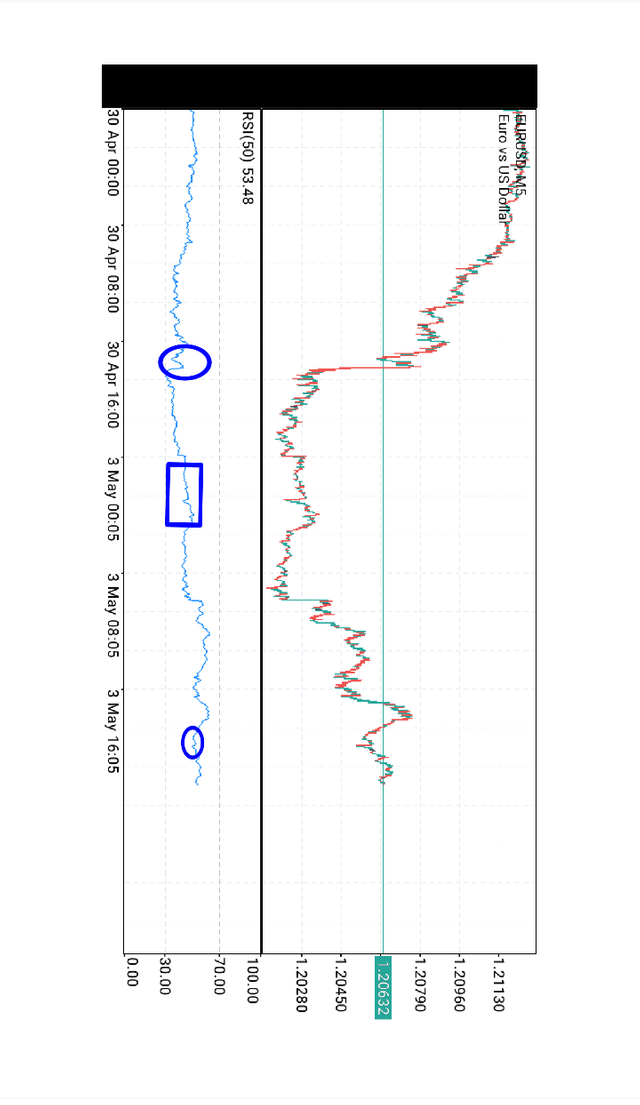
In other, to filter RSI I set my RSI parameter length to 50 to have a more proper view of the trending line in the market I used the square box to indicate the false RSI market movement while the circle was for a real breakout
Review the chart of any pair (eg TRX / USD) and present the various signals from the RSI. (Screen capture required)
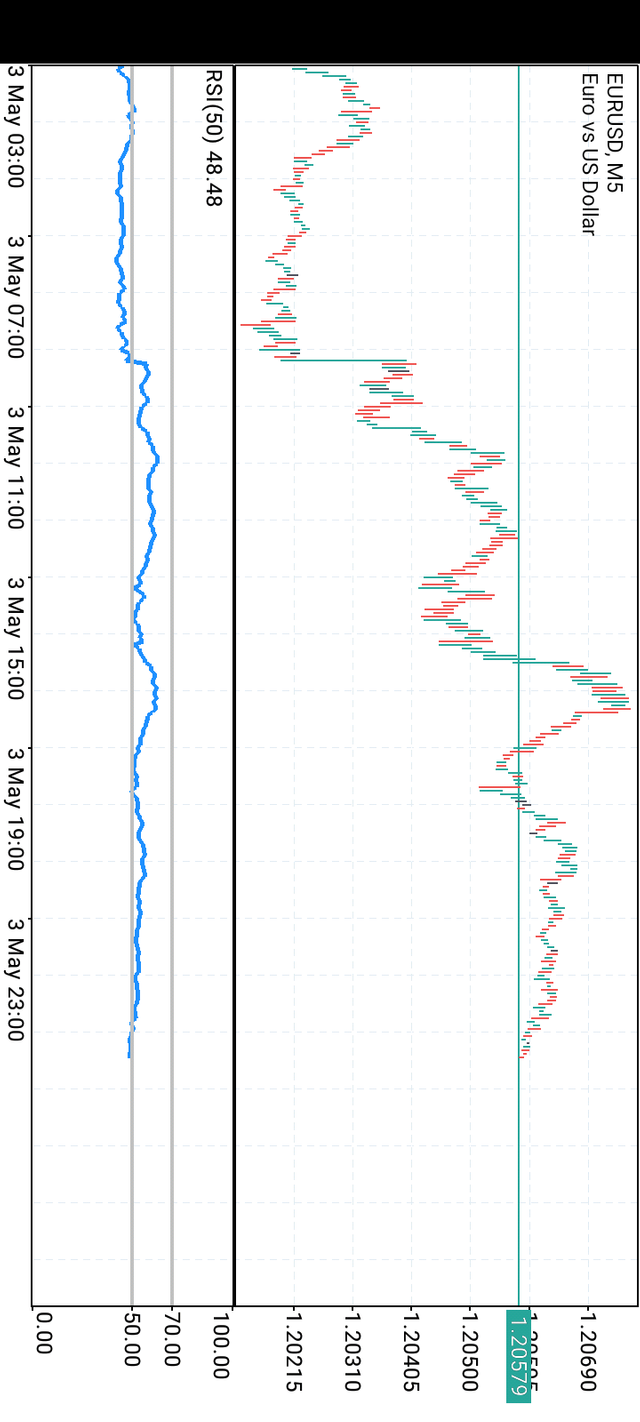
From the chart above I set up the RSI line to range between 50 and 70 for EUR/USD it can be seen from the chart there have been many fluctuations in the market movement there for may 3rd the RSI have not moved above 70 but have been moving along 50 and below which show there has been price oversold for 3rd May.
Conclusion :
Although RSI is a good tool for making technical analysis traders are not advised to completely depend on using only the indicator.
Also with RSI, a trader can keep track of market movement by easily identifying when the market is oversold or overbought in other to stay alert with current and previous market trends.
Hi @mccoy02
Thanks for your participation in the Steemit Crypto Academy
Feedback
This is Good work. Well done with your research study on the RSI trading indicator.
Homework task
7
Hi thanks much for the feedback appreciate.