Crypto Academy Season 4 week 4: Crypto Trading With Williams % R Indicator
Explain the Williams %R indicator by introducing how it is calculated, how it works? And what is the best setting? With justification for your choice.
Larry Williams a known American stock commodity trader created the Williams % Range indicator used for measuring trade price momentum of price high and low swings in a market trend.
Every trader has his trading strategy and with different indicators available for the trading price and commodities traders can choose from these multiple indicators and develop a strategic trading skill.
Explain the Williams %R indicator by introducing how it is calculated
Williams %R is an indicator used by traders it is used to signal or tell a trader when a particular currency pair is likely to be overbought or sold in the market, it is also a momentum indicator that shows how price is relative based on the highest and lowest price swings of a given period, it is also used to measure the strength of currency pair in the market.
It has an important point or range point used for representing market strength based on price overbought and oversold signals.
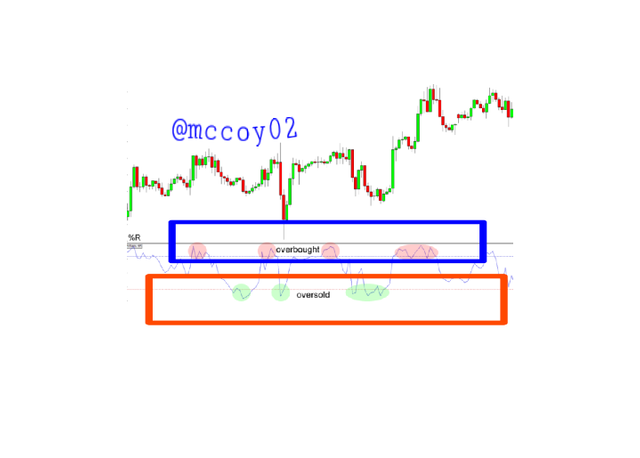
The ranges -20 and -80 are known as extreme points on the Williams %R indicator it uses a scale of -100 to 0 range to interpret market price movement.
On the scale a reading above -20 indicates price overbought, which means a bullish trend is ongoing and the buyers are in control of the market
While a reading below -80 indicates a price oversold representing a bearish market where sellers are dominant
The graph above shows a typical example of price overbought and oversold using the Williams %Range indicator.
While taking the scale reading a trader is to note a price overbought or sold in the current market does not guarantee price reversal in the market a trader will have to wait for clear entry confirmation before entering a position.
How it is calculated
When calculating the Williams %Range using an indicator the highest price point in the market is used as the pair closing price.
The Formula for calculating the Williams %R Is:
Wiliams %R= HH−Close/HH−LL
where;
HH represents Highest High
LL represents Lowest Low
HH = is the highest price of a currency pair in n period days ( numbers of the previous period of the highest price )
Close = is the recent closing price of the last n day
LL = is the lowest price of a currency pair in n period of days ( number of previous periods lowest price )
Taking a practical example.
If the HH price for the last 15 days is; 50, 60, 40, 74, 78, 46, 82, 85, 68, 56, 34, 43, 64, 87, 53.
And the LL price for the last 15 days is; 45, 46, 47, 50, 55, 69, 68, 49, 55, 48, 55, 58, 74, 56, 53.
Therefore, from the above 15 days previous price period of HH and LL, 87 is the HH and 45 is the LL
53 This Is the close price for the last 15 days.
From our formula = HH−Close/HH−LL
We have 87 - 53/ 87 - 45
= 34/ 42 = 0.809
When multiple by -100% we have -80.9%
Therefore the Wiliams %R = -80.9%
Our Wiliams %R from the 15 days price period shows a reading scale between the range of -80.9% this indicates a price oversold in the market.
How it works? And what is the best setting? With justification for your choice.
The Wiliams %R works by telling a trader where the current price of an asset is heading relative to the highest high or low of a price depending on which period a trader chooses.
Like the example above with a range between -80 tells a trader the current price is oversold while reading between -20 and 00 tells a trader the price is overbought.
What is the best settings
The best settings for Wiliams %R will solely depend on a trader's trading strategy a trader who trades short-term will need less period in other to get the best results from his trade chart reading.
While long-term traders will need more periods to get an accurate chart reading.
In general, the best setting will depend on if a trader is a long-term or short-term trader long term traders need more periods this will help them get more accurate chart reading, while short-term traders will need fewer periods.
The lesser the period the more a trader can easily read a chart with a shorter time frame.
How do you interpret overbought and oversold signals with The Williams %R when trading cryptocurrencies? (screenshot required)
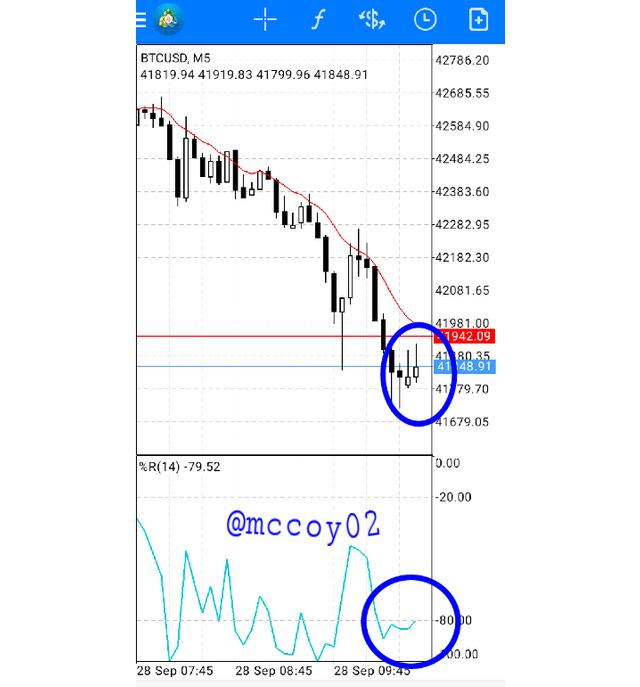
Price oversold
Above is a BTC/USD 5 minutes chart taken from my Meta4 trading app applying the Wiliams %R indicator which is shown on the chart it can be seen from the indicator reading with a scale range of -80% interpreting price oversold in the market.
With the reading shown above, it can be said a bearish market is currently ongoing where sellers have been dominant in the market it can also be seen the current price of BTC is respectively corresponding with the Wiliams %R as shown above.
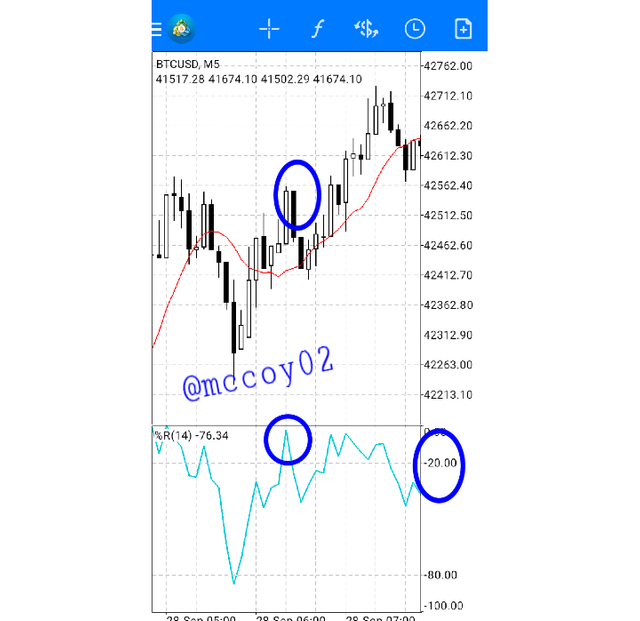
Price overbought
Above is also a 5 minutes BTC/USDT chart with the Williams %R indicator shown with a reading above -20% this interprets/shows price overbought in the market making the bulls major dominant in the market also the Williams %R is seen to relatively corresponding to the current price of BTC.
As shown from the above chart it can be observed that the Williams %R indicator can be used by traders to interpret the current price action of a particular currency pair.
What are "failure swings" and how do you define it using The Williams %R? (screenshot required)
In a very simple term, the failure swing is when an indicator and the current market price of an asset show different corresponding results.
In an uptrend for instance, when there is price overbought an indicator suppose to show from its reading scale that there, is price overbought but it turns out to show a different reading.
Swing failure is when the current market price of an asset does not correspond relatively to the scaling reading of an indicator.
Suppose a trader is using the Williams %Range to trade and he observed there is a market uptrend but from the Williams %R a different scale reading is seen it means there is a swing failure, most swing failures in trades lead to a price reversal.
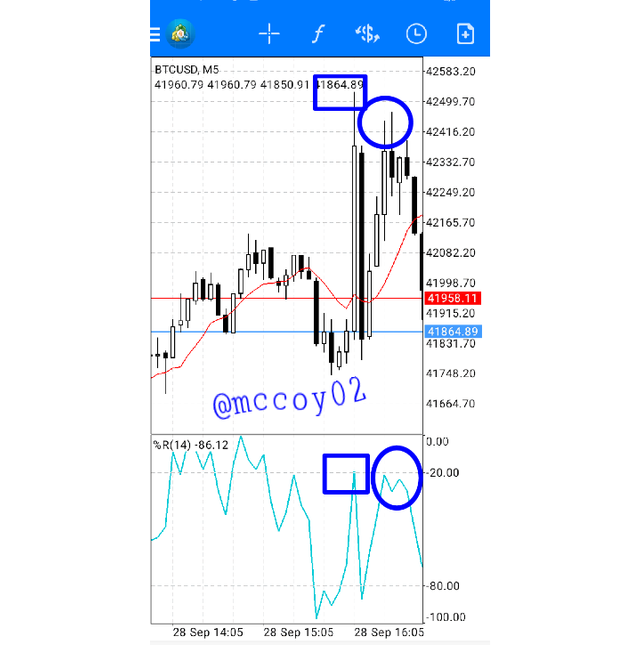
Bullish failure swing
From the chart shown above a bullish trend is formed which shows there is a price overbought in the market it can also be seen an M sign Is observed on the Williams %Range indicator this tell a trader there has been a current price overbought but on the indicator, the reading scale does not relatively correspond to the market price.
Taking a close look at the rectangular box it can be observed that the William %Range reading is slightly below the -20% range which indicates a swing failure.
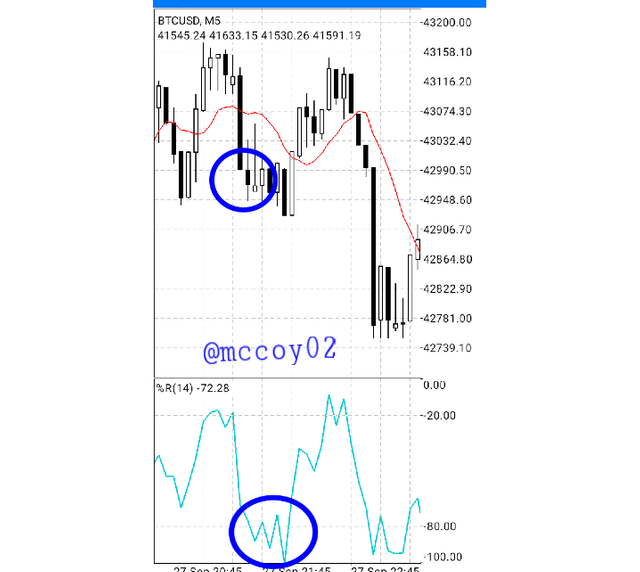
Bearish swing failure
For a bearish swing failure, a W sign is formed on the William %Range indicator a low price trend is formed showing price oversold but on the indicator, a different scale reading is observed which means the William %Range price trend is relatively different.
It can also be seen the William %Range is slightly above -80 which does not relatively correspond to the current price oversold which leads to forming a reversal trend pattern.
It can therefore be observed both the bullish and bearish trend swing failure results in a market reversal in the above BTC pair.
How to use bearish and bullish divergence with the Williams %R indicator? What are its main conclusions? (screenshot required)
Bullish divergence with the Williams %Range
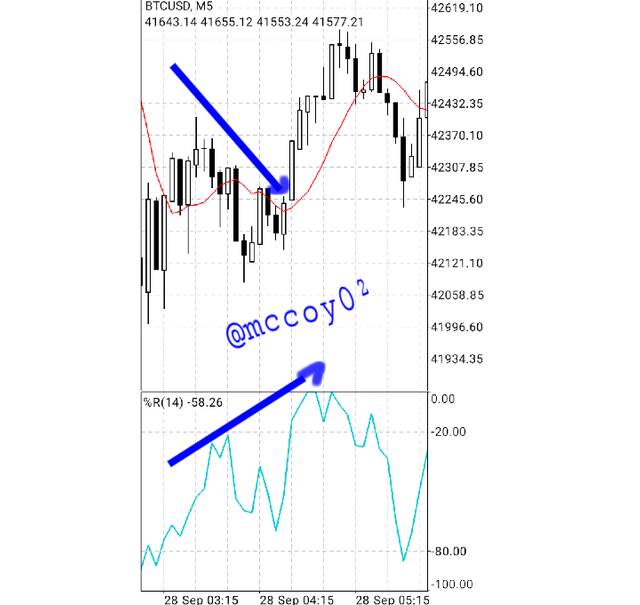
When divergence occurs on a trading pair in a bullish market traders use this opportunity to take advantage of the market price movement to make a buy entry, how the divergence is used with Williams %Range is in an uptrend which is a bull run there will price decrease in pair but the Williams %Range indicator will increase, following a different pattern which is when the price is showing downtrend the Williams %Range will show uptrend they are moving in divergence manner.
Above is a typical example of a bullish divergence chart as shown above it can be seen that the Williams %Range is moving in an upward direction while the price of BTC is moving in a downward direction.
As seen above a bullish trend is followed immediately this shows that the bullish divergence Williams %Range indicator can be used by traders to enter a buy entry position in the market.
In general use of bullish divergence with Williams %Range is used to confirm a buy signal in the market.
Bearish divergence with the Williams %Range
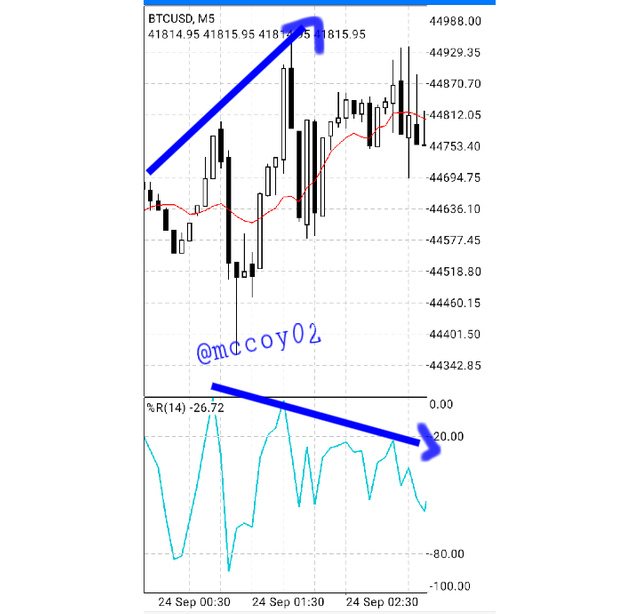
The bearish divergence with the Williams %Range is the opposite of the bullish divergence here the price will be showing an uptrend while the Williams %Range indicator scale will be showing a downward direction move.
This pair movement is used by traders to signal or confirm a sell entry position.
The above bearish chart shows price moving in an upward direction while the Williams %Range moves in a downward direction this is used to indicate a sell entry signal for traders.
How do you spot a trend using Williams %R? How are false signals filtered? (screenshot required)
When the Williams %Range gives a reading scale of below -50 in an uptrend market this signals a continuous bullish/uptrend movement.
When the Williams %Range reads above -50 in a bearish/downward-moving market then a continuous moving downtrend will be observed in the market.
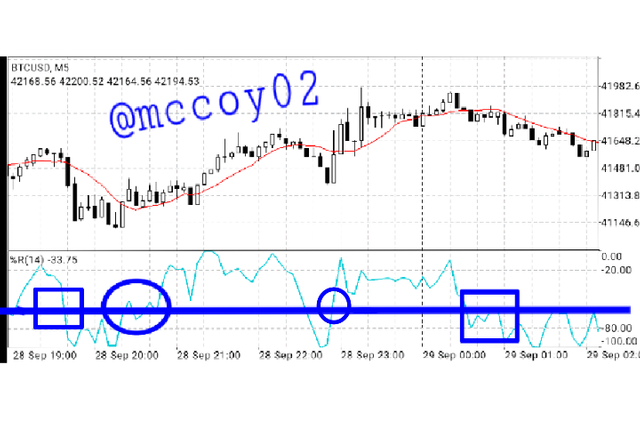
The -50 range scale reading on the Williams %Range is worth looking out for on the price trend as they are significant point that is used for identifying a continuous uptrend and downtrend market price entry.
The chart above identifies the blue circle with a scale reading below -50 representing a continuous upward price movement while the rectangular box represents a scale reading above the -50 scale reading on the Williams %Range.
With the reading below and above -50, a trader can easily spot a trend entry position either a buy or sell depending on the current market trend.
In other to filter a trend price with Williams %Range a trader will need to add a trading indicator this will help such traders to have a good confirmation on any entry price.
The Bolinger band is a good trading indicator that can be integrated with the Williams $Range to have a good price confirmation.
The contraction and expansion of the band corresponding to the Williams %Range can be used for making entries.
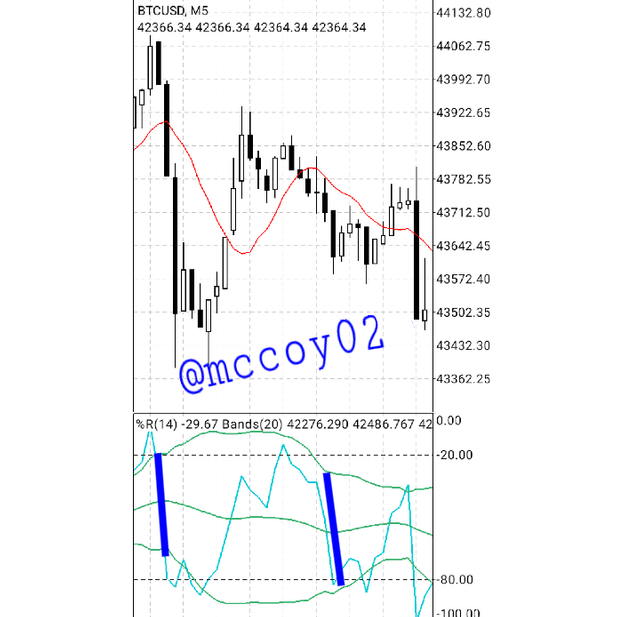
The Bolinger band below shows a price uptrend by the expansion of its band the Williams %Range also respect the band movement as the band starts forming a neckline the price starts changing direction with the Williams %Range also changing its scale reading.
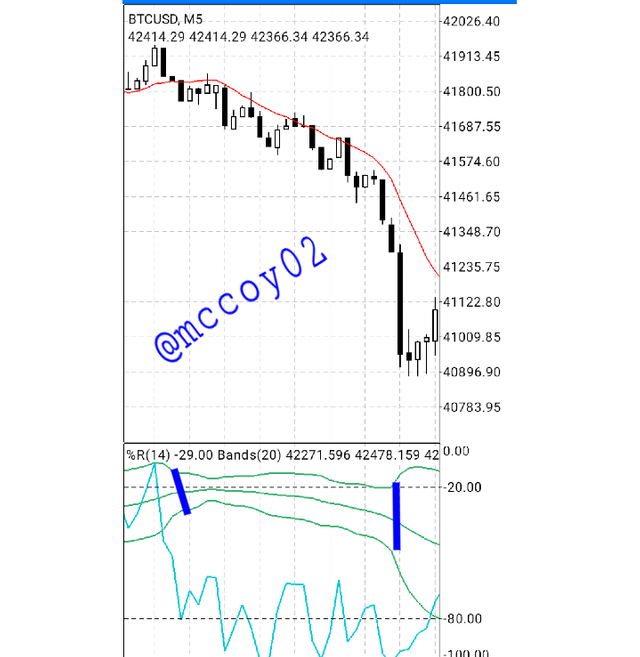
Also below shows as the Bolinger band start contracting with a neckline formed pair price begins to change corresponding to Williams %range indicator.
The Bolinger band expansion and contraction integrated with the Williams %Range can be used by traders to filter trend signals also it can be observed when a new neckline starts forming on the Bolinger band a new price position is about to be formed.
Use the chart of any pair (eg STEEM/USDT) to present the various signals from the Williams %R indicator. (Screen capture required)
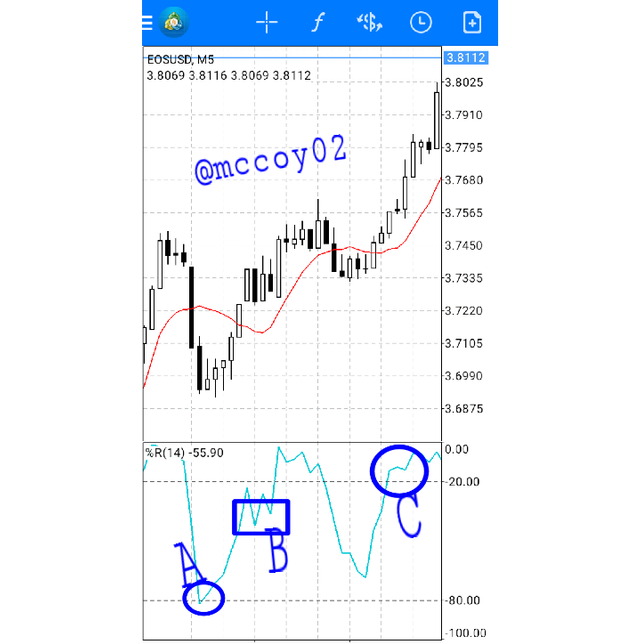
The Chart above is a 5-minute timeframe EOS/USDT chart.
Sign A shows an oversold price movement of EOS with the Williams %Range scale reading of -80 this indicates a bearish market trend, moving up the price maintain stability across the -50 range confirming a continuous bullish run which is on sign B the C sign shows the Williams %scale reading above -20 with the price of EOS on an overbought range indicating a bullish market price trend.
Conclusion
The Williams %Range is a very important signal indicator used by traders to determine the price strength of a market trend the highest price for a period is used for determining the strength of buyers in the market while the lowest price of a period is also used to determine the strength of sellers with the help of the Williams %Range scale reading a trader can be able to read who are major dominant in the market also in other for a trader to have proper market entry and confirmation of price there is need for such trader to add/integrate the use of more indicators while using the Williams %Range to avoid false swings or market entry.
Hi @mccoy02
Thanks for participating in the Steemit Crypto Academy
Feedback
This is good content though you need to improve on the quality of your work by eliminating the many grammatical errors in it. Otherwise, Thanks for taking the time in demonstrating such a clear understanding of trading with the William %R indicator.
Total| 7/10
Thanks professor well noted.