Crypto Academy / Season 3 / Week 7 - Homework Post for @yousafharoonkhan | How to create an account on TradingView, how to use indicators, tools, features of tradingview
Introduction
To be effective in trading, you must conduct thorough research that covers both the fundamental and technical aspects of the markets. As a result, I've come to discuss about an vital and one of the most popular Trading platform that offer basically the technical analysis of a trade, as a result of the enormous number of tools and features it makes available to its users, the platform has made things easier for for traders but newbie and old ones in every way possible. The name of this trading platform is know as Tradingview, The professor explained the Tradingview website in his lecture, this platform is widely used by traders. Before trading, any good trader should use this tool. So, if you haven't tried it yet, I strongly advise you to do so.
 Made with Poster wall
Define the TradingView site and how to register an account on TradingView? What are the different registration plans (screenshot required)
Tradingview is a trading analysis platform with a variety of tools, features, and services that are beneficial to every trader, whether they trade stocks, forex, crypto, or anything else. Essentially, the platform is not confined to a particular sort of trade, but we can find charts, information, and features connected to each type of asset that exists today.
Tradingview is one of the best free-market trading website that is accessible to all from any devices. The platform was established on September 2011, the platform with it unique features and tools has helped millions of traders makes successful trading decisions.
For a newbie, the platform is very simple to use, and the complexity is minimized. It's also a feature-rich site for seasoned traders.
In addition, It also provides a service that allows us to examine cryptocurrencies, currencies, stocks, indices, bonds, and futures in the market.
How to register an account in TradingView?
The website is user friendly and easy to navigate, the free basic plan option is sufficient for first-time Tradingview users. Then probably after the user have gained some experience with Tradingview and have a better understanding of the market, he/she can opt-in for other options.
Search for Tradingview or visit https://www.tradingview.com/ website on your browser.
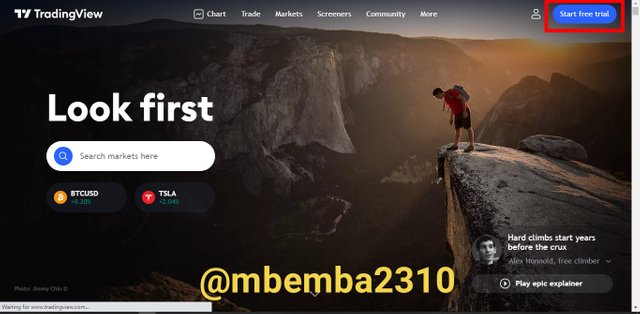
 Tradingview Homepage
Then click on Start Free Trial on the top right corner of the screen.
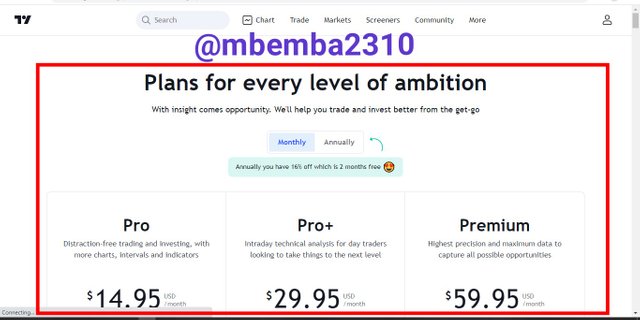
A new page will pop up, it will display different plans for different level of goals, they are The Free Basic Plan, The Pro Plan, The Pro+ Plan and The Premium Plan.
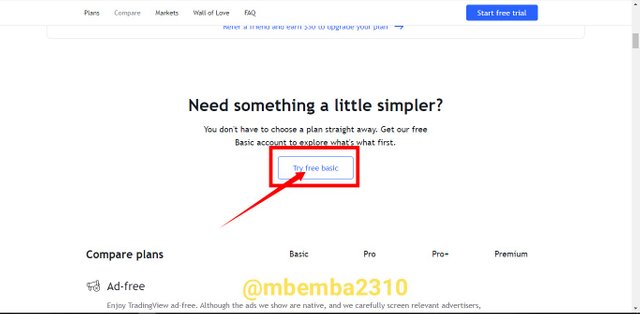
To register on Tradingview using a Free Basic plan, scroll down a little bit, locate and click on Try Free Basic as shown in the screenshot below
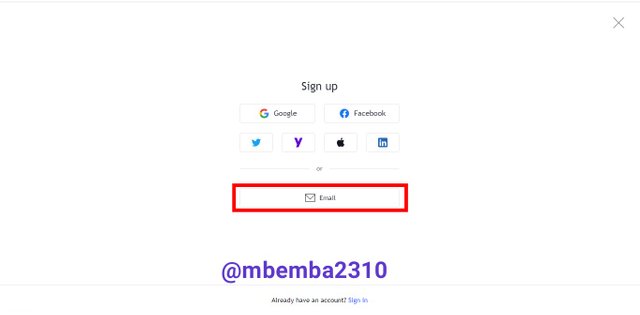
There are numerous options available to start the registration procedure, you can register with Google, Facebook, Twitter, Yahoo, Apple, LinkedIn and Email. I prefer the Email, so I select Email.
I entered my preferred username, and entered my email and use a strong password. I proceed to click on the small box to accept the terms and opt-out from receiving marketing emails. I confirmed that "I'm not a robot" and clicked "Create acccount"..

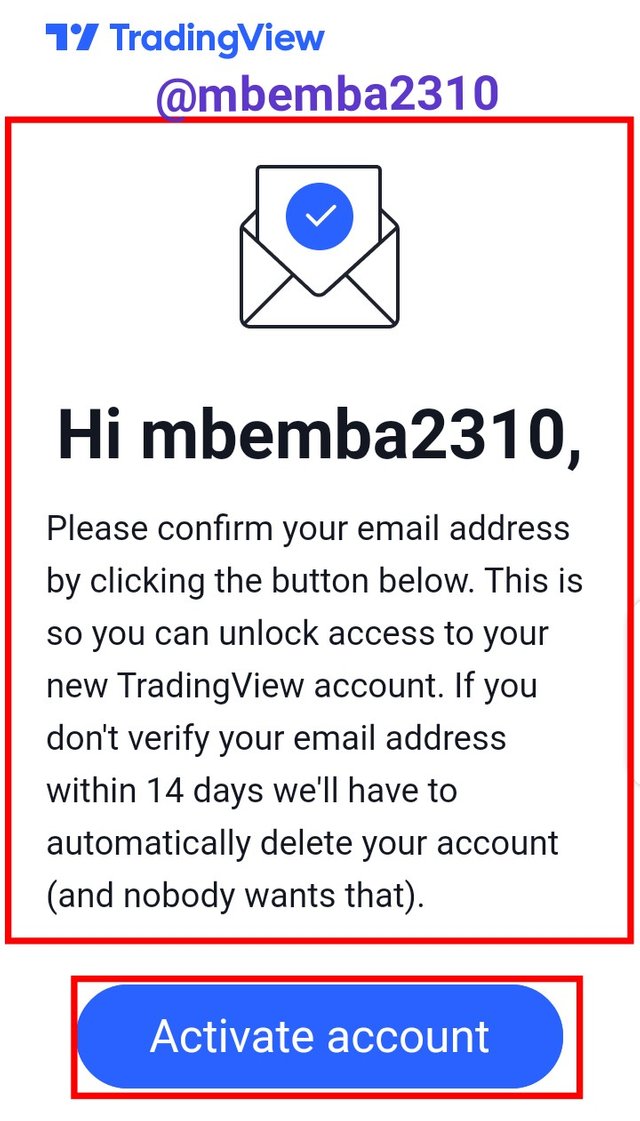
A verification link was sent to email I provided and I opened my email and click on the link to activate my account.
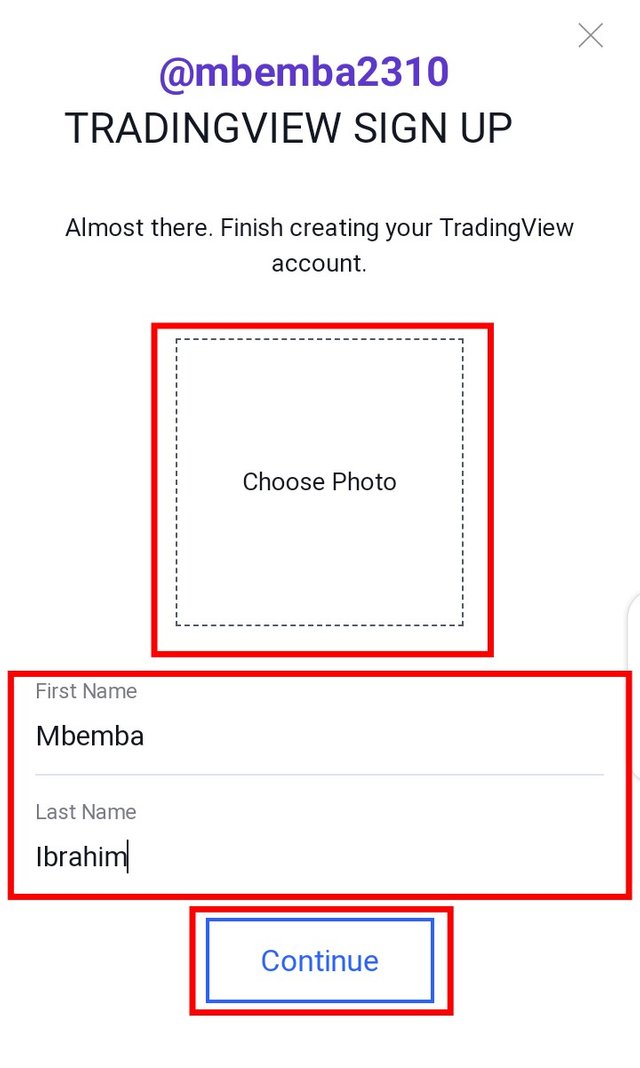
I entered my first name and last name, I can also decided to upload my picture if I want.
I have successfully registered for a free account on Tradingview platform, I can now access some features applicable to Free Basic plan
Different Registration plans available on TradingView
 All the plans on Tradingview
The Free Basic Plan: The free basic plan is intended for newcomers to the platform, primarily for those who are just starting to trade and/or do not have the financial means to pay for registration. It is the most cost-effective option to register and use the platform for free. When compared to paid plans, this one has a lot of limitations, one of which is that the user can only apply a maximum of 3 Indicators on chart at the same time.
The Pro Plan: The Pro Plan is a paid plan that is mostly used by customers with some experience. $14.95 per month is the cost of membership. In comparison to the free plan, you can add a maximum of 5 indicators on a chart at the same time, place two charts in the window, customize the time interval, add multiple watchlists, and this plan is ad-free, which means you won't see any adverts. This package comes with a slew of additional and incredible features.
The Pro+ Plan: this is another paid plan that is designed for slightly more experienced traders. The cost of membership is $29.95 per month, and it includes a number of benefits and features, including the ability to apply 10 indicators to a chart, set up to 100 price alerts, and use charts based on special formulas. The plan also allows users to export chart data and set indicators on indicators, all these unique feature are not available on either the Free or Pro plans.
The Premium Plan: this plan is meant for the most experienced traders. The cost of membership is $59.95 per month, and it includes a variety of benefits and features, such as the option to add 25 indicators to a chart, a non-expiring alert, and the ability to use the account on up to 5 devices at the same time. Traders with the premium subscription can also publish invite-only indicators.
So the above is the list of all the plans available on Tradingview and there benefits.

Explain the different features of tradingView and what is your favorite feature and why? (Screenshot required)
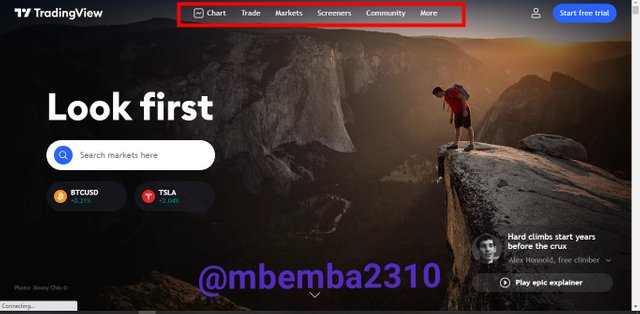
TradingView includes a number of features and functionalities that make it a one-of-a-kind and essential trading analysis platform that helps traders to make trading decisions in today's market. I'll describe a few of them to you:
Chart
The chart features on Tradingview platform will allow you to see the graphs of any asset's pair, as well as search for them. On the left side of the chart, you will find numerous tools for graphic drawing, as well as the ability to draw and write on the charts. There is also an opportunity to adjust the time period of the charts at the top, as well as to select and apply other indicators to the chart. All of these tools are extremely beneficial to traders since they enable them to keep track of price patterns and make the best trading decisions needed.

Other things that can be done on Chart include;
- Apply different kind of indicator and the number is based on your plan subscription. For instance if you subscribe to the Pro plan you can apply up to 5 indicators
- Customize the trend line, change the length and the colour of the lines.
- Draw different type of line, write on the charts, which you can screenshoot or download it. For instance you can draw the support and resistance line of an asset pair.
Trade

There are two sub-sections in this section.
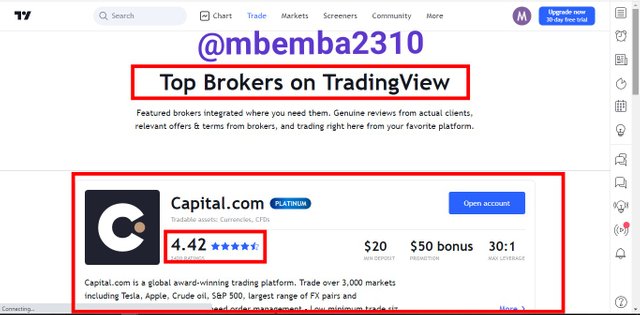
- Best Broker This section contains a list of all the best brokers, ranked by their rates. Capital.com now has the highest ranking, with a 4.42 rating. You may also get information about the brokers, such as the minimum deposit, terms and conditions, and the rules that govern each broker.
- Brokers Awards: this section offers a list of past year's winners of the brokers Awards; you can also leave a review to help your favorite broker win the next Awards.
Markets
This section consist of many sub-section, which include cryptocurrencies, currencies, stocks, indices, futures, bonds, sparks.
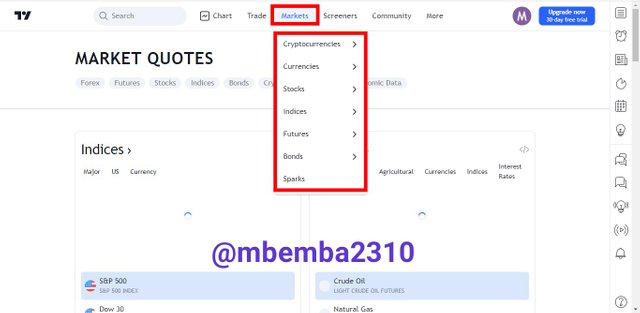
- Cryptocurrencies: In this sub-section, you can view the price of any assets, the list of the most popular cryptocurrencies are displayed in order. Also you can view the total market cap chart and DeFi coin and the market cap.
- Currencies: This is another sub-section, this contain the list of all major and minor currencies in the world. You can as well select the currencies based on the continent. Check the currencies charts and as well as the heat map.
- Stocks: This section's sub-section is one of the most often visited. It is further subdivided into several sections. Stocks are classified as having the most capital, the most increasing, the most falling, and the most traded. You may get more extensive information and statistics by clicking on these categories.
- Indices: This is a sub-part of the market section that is divided into four sections: The world indices, The US indices, The foreign exchange indices, and the **S&P500 Index.
- Futures: this sub-section shows the list of agriculture markets, energy markets, metals markets, currencies markets, world indices and interest rate. For instance, if you select the Metal, it will show the markets of metals like gold or coppers.
- Sparks: this is a new feature, you can find new ideas and find out the signs that made up an industry. This is basically for stock research
Screeners
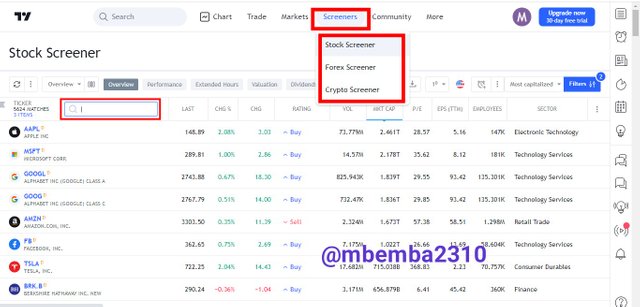
This is another section of the TradingView platform, with sub-sections such as Stock screener, Forex screener, and Crypto screener. The assets can be sifted by sorting them by price, alphabetically, and so on.
You can also use the search section to find the asset you're looking for, or use the filtering method to sift the assets based on the criteria you've established.
Community
This is another section of the TradingView platform where you can find a variety of trending data that can be quite beneficial in gaining insight into a specific market. You can also follow different users and obtain timely information from their publications to stay up to date on the latest market news. Ideas, Scripts, Streams, and More are the four sub-sections of this feature.

Additionally, this feature can be used to perform fundamental analysis on some assets based on information gathered from the community, and it can also be utilized to secure path into an asset's market.
Watchlist

This is another amazing feature, this section allow users to keep track of their favorite assets. This can be aid the traders in watching the trend of the asset and see how they behave this will automatically help the traders in making trading decisions.
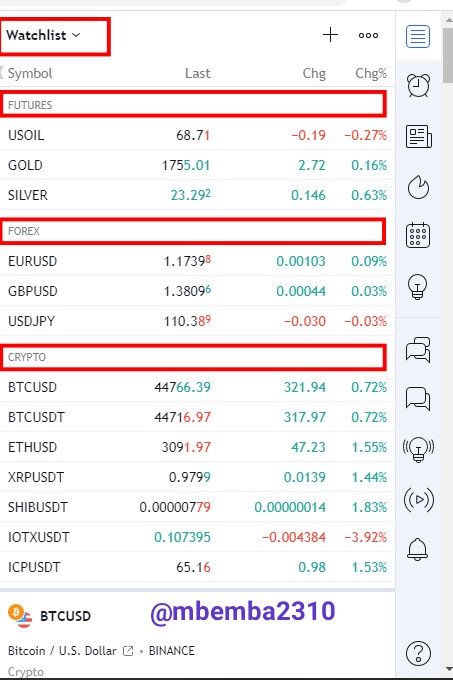 My Watchlist on Tradingview
The screenshot above shows my Watchlist on Tradingview platform. You can see the assets am monitoring through this watchlist features I can easily keep track of them.
My favourite feature of the TradingView and Why?
Tradingview is one of the best platform that helps traders make easy technical analysis, the platform is easy to use and my favorite feature is the Chart as it allow me to choose trading pair of any assets. The reason is because I'm Crypto trader although am still learning with the aid of this Chart feature I can perform technical analysis on any asset pair.
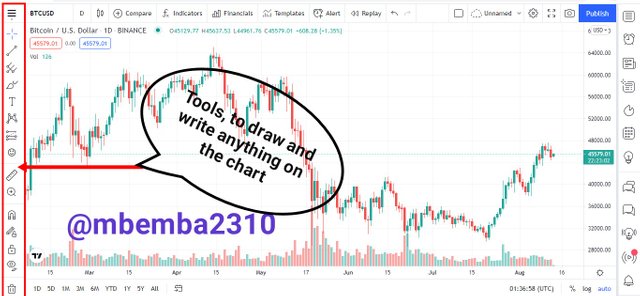 BTC/USD Chart on Tradingview
In addition, the Chart allow me to draw out line, and I can use this to draw the support and resistance line on any asset pairs. With the aid of the indicator I can easily predict the next trend of an asset and this will help me make the best trading decisions.

How to set up a chart in TradingView and use two tools to edit it.(screenshot necessary)
It's critical to understand how to set up the chart on TradingView and to experiment with the many parameters of the chart, as it may be customized to your liking. I'll be using the BTC/USD trading pair to do this configuration on this platform. With the required screenshots, I'll demonstrate how this is done.
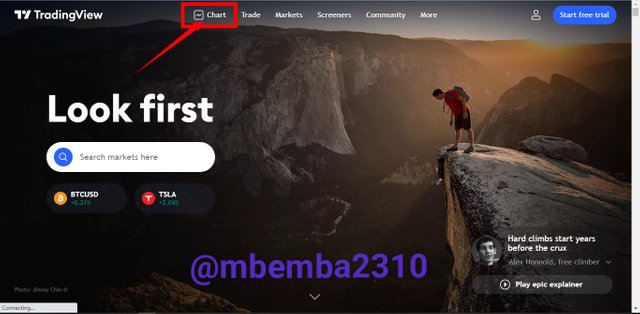
Visit https://www.tradingview.com/, and from the homepage I navigate to the Chart section on the upper side of the page.
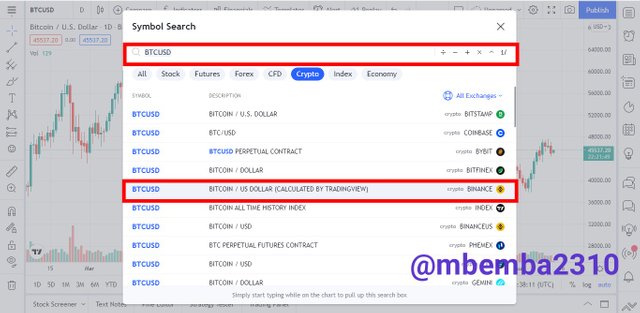
Search for the pair, since am using BTC/USD. I proceed to search for it then I click on the one of my choice I strongly prefer Binance exchange pair because of the high trading volume on the exchange
Now I'm on Tradingview BTC/USD chart, then I locate Settings, this comes with some options. I will discuss the options one after the other.
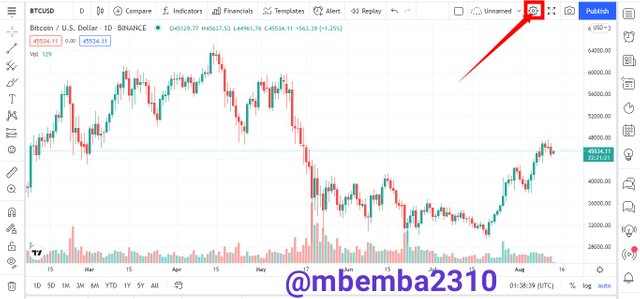
Symbol: in this option of the chart settings, you can choose the color structure of the graph, the body, the edges, and the wick.
Furthermore, you can also customize the colors of the candlesticks for both bullish and bearish, as well as their body and border. you can also opt to add or delete wicks from the candlestick's component, and so on. The default colors of the bullish and bearish candlestick are green and respectively. Personally I prefer to leave them by default.
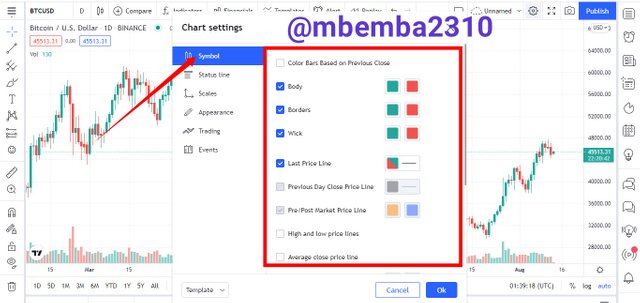
Status line the Status line is another option on the Chart setting, here you can decided to hide or show the symbol, open market status, the buy or sell button, the titles of the indicator as well as the background colour and many more.
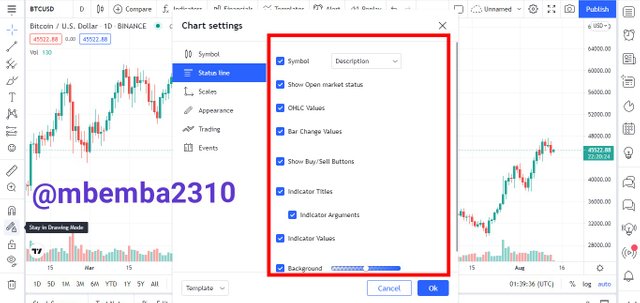
Scales: this is another option on the Chart setting, where you can decided to show or hide some labels by just ticking the box, labels like the financial name, symbol name, symbol last price and so on.
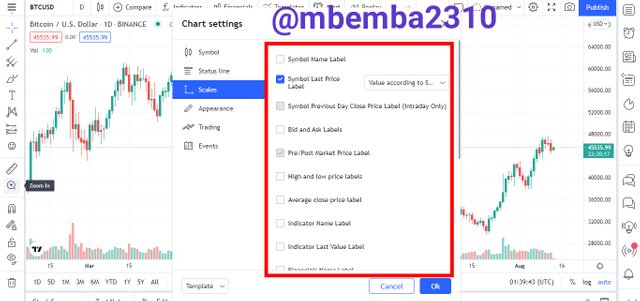
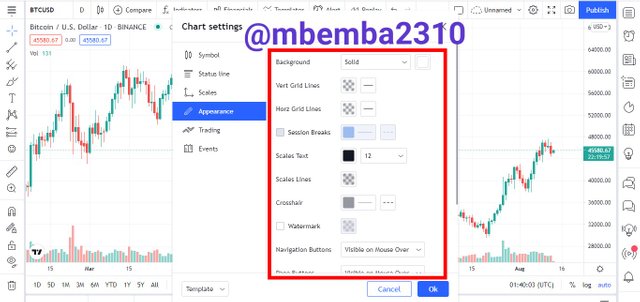
Appearance: The appearance is an option on the Chart setting, here you can edit the background format, and customize its color, we can further change the Text size and the color, the Horizontal and Vertical grid lines, and the navigation buttons.
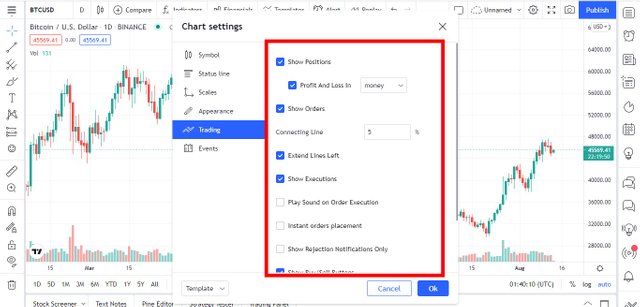
Trading: This is another option on the Chart settings, here you can show position, show profit and loss, show orders by ticking the box, furthermore, you can extend the play sound on order execution, you can extend the left line and so many more
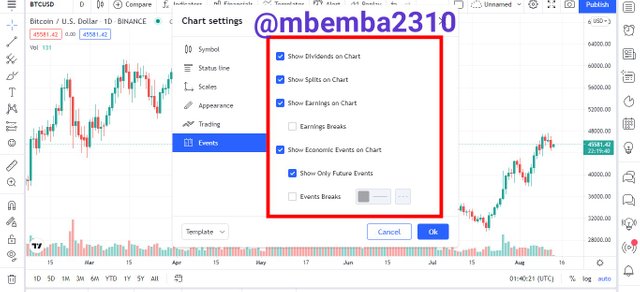
Events: this is the last option on the Chart setting here you can show or hide dividend on charts, splits on chart, earning breaks and so many more.
How to use Two tools to edit the Chart
In this task, I will be using two different tools on the chart and I will illustrate how to use it and the functions of the tools. The tools are Trend Line and Text
Trend Line
This tool is use to draw lines on the charts, it is mostly used to draw the support and resistance point of an asset or show any trend patterns on a chart
To use this, go to the Tradingview website and locate the Chart, at the left side of the locate the Trend Line tool.
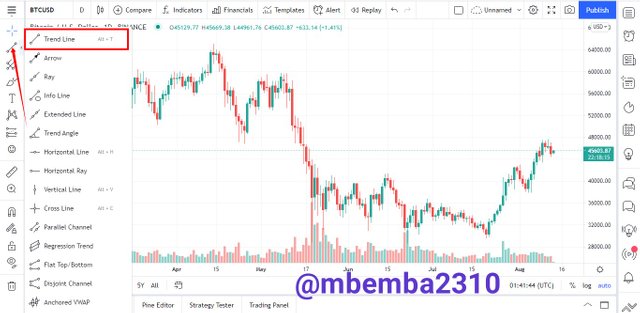
Then I scroll to the point I want to draw the line, for instance I will be drawing the resistance line on the BTC/USD chart. When I got to the point I click and drag it that will determine the length of the line. Furthermore you can change the color and weight of the line.
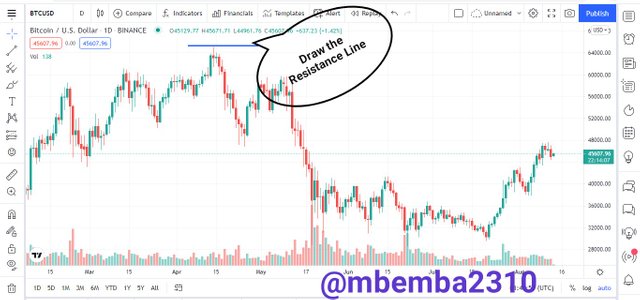
From the above screenshoot, I draw the resistance line on BTC/USD chart and changed the color to blue,
Text
This is another tool in the chart section, with this tools you can write anything on the chart, you can as well customize the text size, font and color.
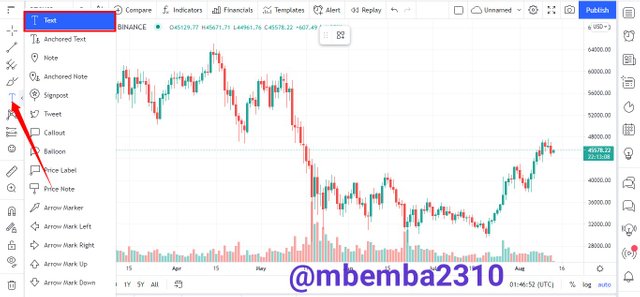
To add a text to your chart, navigate to the left side of the page, locate Text tool icon T, entered the text your preferred text, you can also adjust the size, the font and the color.
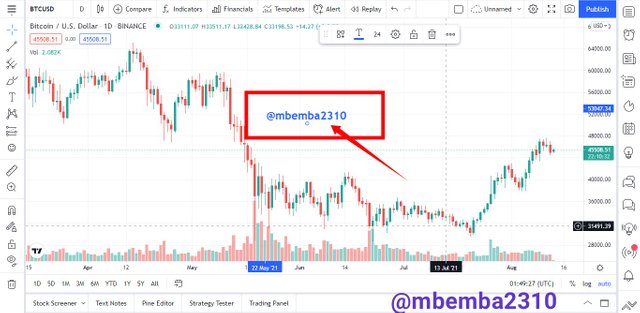
From the above screenshoot, I have added my Steemit username and I change the font and the color to my preference.

How do we add an indicator on the chart and what is my favorite indicator?
Indicators provide the trader with market information, it helps traders to know the trend and pattern of the asset, this can be use to predict the next trend movement of an asset if use correctly and aid the traders in making the best trading decisions. I will illustrate how do add a Moving Average Indicator to BTC/USD chart
On the chart, navigate up and locate and click on fx Indicator.
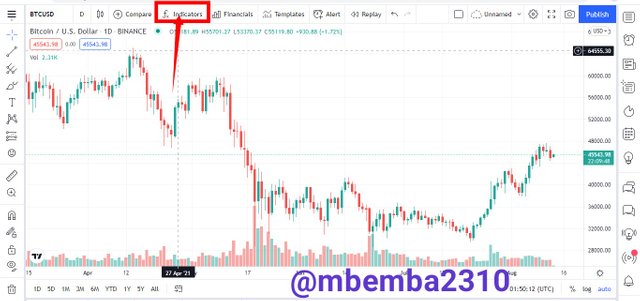
Search for your preferred indicator, since I'm adding Moving Average, I searched for MA and click on it twice to add two Moving Average indicator
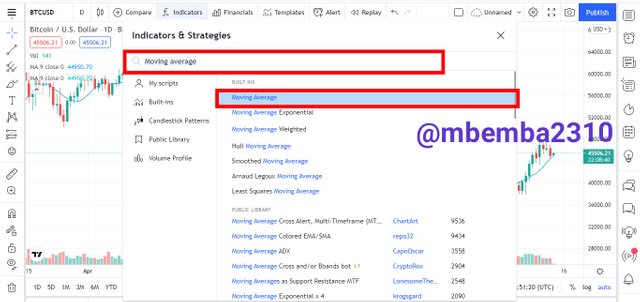
For the two Moving Average indicators to work perfectly we must configuration them, I will be configuring the MA 1 and MA 2 for easy identification.
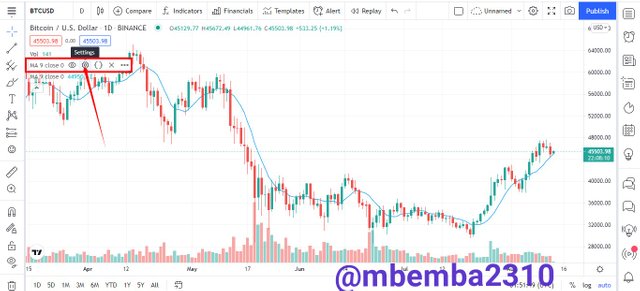
Click on the MA 1 (first MA) and selectsettings icon to configure it. The MA 1 is the short-term moving average line, so I navigate to Input selection and change the length to 50, then go to the Style section and change the color to blue this will help me identify it easily.
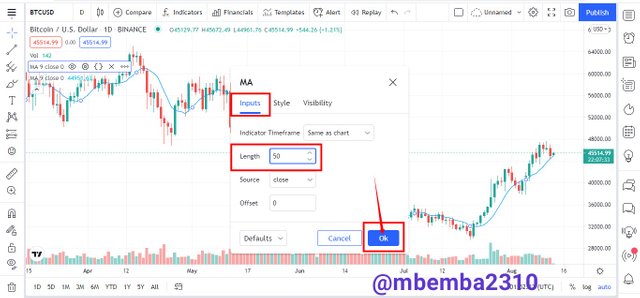
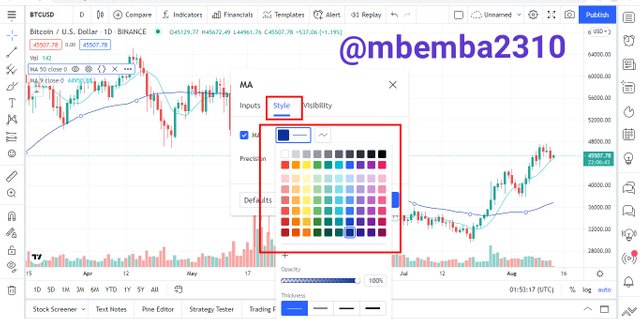
Now to the MA 2 (second MA), click on it and select setting icon to configure it, this is the long-term moving average line so I navigate to Input section and change the length to 200, then go-to the Style section and change the color to red this will help me to identify the line easily.
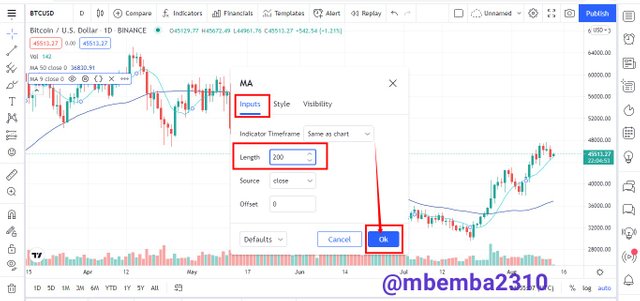
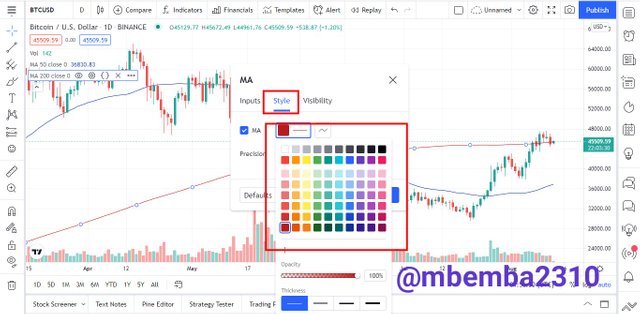
Now that I have configure the two moving line, below is the outcome. The short-term (50 days) moving average line is blue while the long-term (200 days) moving average line is red.

What is my favorite indicator?
The Moving Average Indicator is my favorite indicator, and I have illustrate how to apply it on a chart above. To use this indicator you need to add the two which are the short-term and long-term line.
The reason why I choose the Moving Average Indicator is that it help me to know the next trend of an asset for example I can easily determine the golden cross and the death cross in an asset. For instance I will use the moving average Indicator to determine both the Golden cross and Death cross on BTC/USD pair
The Golden cross is when the short-term moving line crosses the long-term moving line, this usually occur during a bearish trend and signify a trend reversal that is the bearish trend will turn bullish. The price of the asset will rise implying a buy signal to the trader.
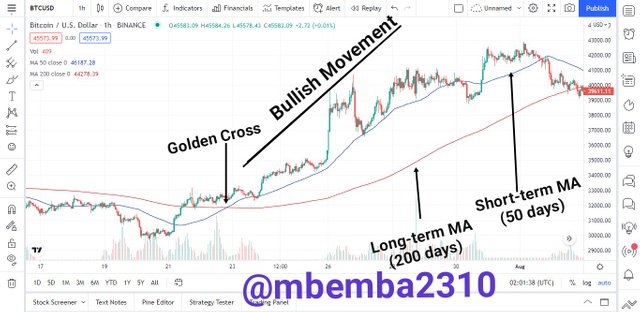
From the above screenshoot the short-term moving line cross the long-term moving line that indicates a golden cross meaning the price of the BTC will rise as the golden cross indicate a bullish trend. Implying the perfect time to buy BTC.
The Death cross is when the long-term moving line crosses the short-term moving line, this usually occur during a bullish trend and signify a trend reversal that is the bullish trend will turn bearish. The price of the asset will drop implying a sell signal to the trader.
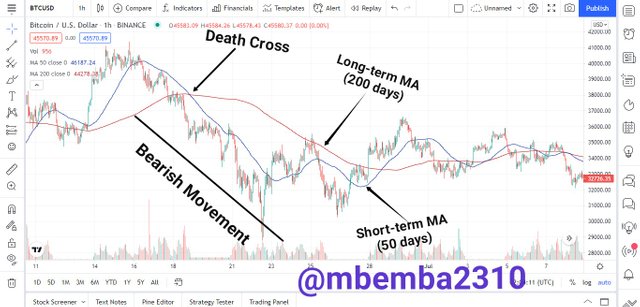
From the above screenshoot the long-term moving line cross the short-term moving line that indicates a death cross meaning the price of the BTC will drop as the death cross indicate a bearish trend. Implying the perfect time to sell BTC.
The fact is that this indicator isn't perfect has it sometimes gives wrong signals, so has a trader you need to be very careful and make sure you use other indicators to identify and confirm the change, this will help to make the best trading decisions.

Do you think TradingView is useful for predicting the cryptocurrency market? (trend / price)
I personally think the Tradingview platform is very useful, has it offers numerous features that helps the traders to make both fundamental and technical analysis. Traders can easily follow the price trend of their preferred assets and this can be used to make the best trading decisions
On the Tradingview platform the chart of any assets can be examined which includes stocks, energy, metals and so on. With the appropriate use of the tools, traders can do a fundamental and technical studies.
For instance, the chart feature can be very useful in predicting the price of a cryptocurrency, where a trader can conduct analysis on various cryptocurrencies of their choice to predict the next trend and future price, this demonstrates the ability of predicting the cryptocurrency market using TradingView's features.
For me whenever I want to examine an asset chart I uses the Tradingview platform, has it possesses numerous tools, for example a trend line helps me to draw the support and resistance points and guide my trading strategy accordingly.
Moreover, I can easily apply the indicator of my choice to any charts and this will help me to know the next trend of the asset allowing me to me the best trading decision.
The Tradingview platform is commonly utilized not only by cryptocurrency traders, but also by traders in the financial industry as a whole. Traders who use this platform trade more carefully. It's without a doubt very valuable in predicting the market of an asset, both in price and trend.

Conclusion
Tradingview is a fantastic platform that allows users to conduct fundamental and technical analysis by employing multiple platform features to forecast the future trend or price of a crypto asset, all in the hopes of assisting them in making successful trading decisions.
TradingView is one of the most top-rated platform for successful analysis, and its chart feature, as well as various other features, are used by many traders in the crypto world and beyond. There are a variety of features available to assist traders in navigating the market. These features are available for free because there is a plan for free users; generally, it's a wonderful platform for staying on top of the market and receiving its rewards.
Personally I use this platform to perform some technical and fundamental analysis on any assets I want to invest in, I also utilize the watchlist to keep track and monitor my favorite assets.
A special lecture by one of the most intelligent professor in the crypto academy, special appreciation to professor @yousafharoonkhan for this great lecture.
Hi @mbemba2310
Thanks for participating in the Steemit Crypto Academy
Feedback
This is excellent work. Well done with your practical study on Tradingview.
Thank you for the review, I so much appreciate