[Japanese candlestick chart explain by @mayureshpandit] - Steemit Crypto Academy Season 4 - Homework Post for Task 10

Homework question

1a) Explain the Japanese candlestick chart? (Original screenshot required).
b) In your own words, explain why the Japanese Candlestick chart is the most used in the financial market.
c) Describe a bullish and a bearish candle. Also, explain its anatomy. (Original screenshot required)
a) Explain the Japanese candlestick chart? (Original screenshot required)
Financial analysis for the future trends of the financial asset we have to study the charts and news. For the charts, we have a lot of types of the chart. All charts show the same data but the presentation of the information is shown in a different way.
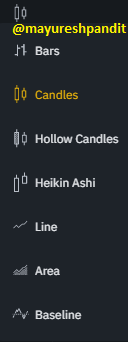
As you saw to see the price action we have lots of chart options. But Japanese candlestick chart is widely used all over the world as it shows all the information in a very informative manner and also it helps to identify the trends by analyzing the different candles. We will see all the candle's anatomy in this post later.
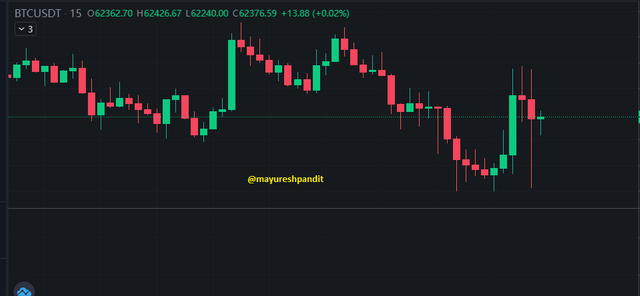
As you saw in the above image candlestick chart is comes in Green(Bullish) and Red (Bearish) candles. This candle helps traders to know the trends. In some forex trading candles chart, all the candles come in black(Bearish) and white(Bullish) candles. Let's see How to identify the bullish and bearish candles.
As you saw in the above images Bullish candles formed is when for a certain period the opening price for the financial asset is low and the closing price is high. Bearish candles are formed when the Opening price is high and the closing price for that period is low. We can select different time frames for the candlestick chart
b) In your own words, explain why the Japanese Candlestick chart is the most used in the financial market.
As per my view, the Japanese Candlestick chart is used because of the following features of the chart.
1) Easy to Visulize the data:-
Japanese Candlestick is chart is the combination of the green and red candles which formed one trend line. Each candle hold information related to price for the specific time frames. It green candles represent the hike in the price and the red candles represent the fall in the price. So you can say it is the best way to visualize the price data of the financial asset.
2) Helps to identify the potential entry point:-
In the candlestick chart traders easily finds the entry points for the financial asset. As candlestick chart helps traders to find the support and resistance level easily and also with different patterns of the candles will help to recognize the traders or investors to identify the entry points for the financial asset.
3) Helps to identify the Direction of the market:-
Candlestick patterns are formed patterns and those patterns help investors/traders to find the direction of the market. Also, there are some reversal patterns that help to identify when the market trend is changed. It is very important for the traders to know the market trend before entering the market.
c) Describe a bullish and a bearish candle. Also, explain its anatomy. (Original screenshot required)
Bullish candle
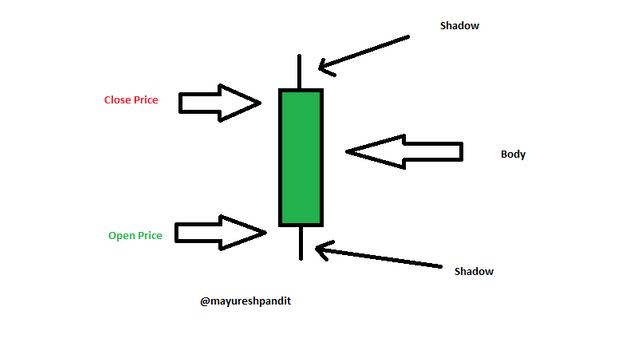
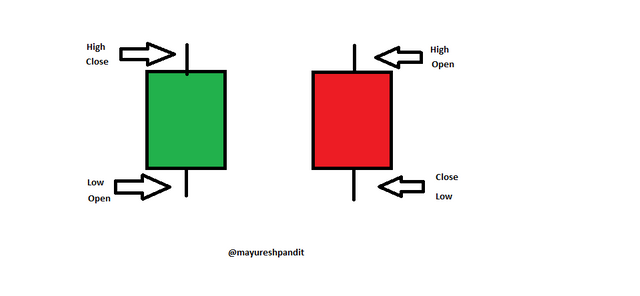
As you saw in the above picture you will come to know that In the bullish candle Opening price is lower than the closing price. Shadow represents the Highest price and Lowest Price for that time period. The body is the price range between opening and close price. It represents the green or white color on the chart.
Bearish candle
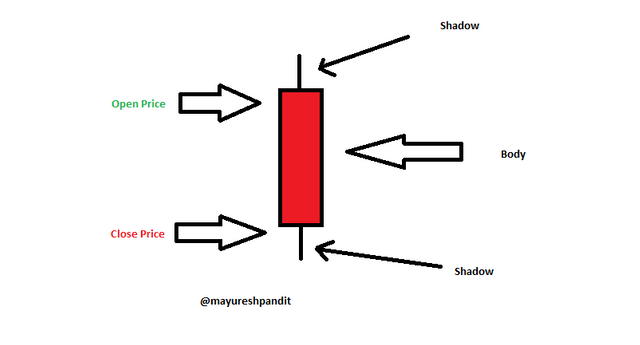
A bearish candle is formed in the chart when the financial asset has an open price higher than the close price and It represents by red or black color on the chart. As you know body is the price range between the open and close price and shadow represents the Highest and lowest price for that particular time frame.
Candlestick anatomy
1) Hammer and Hanging man
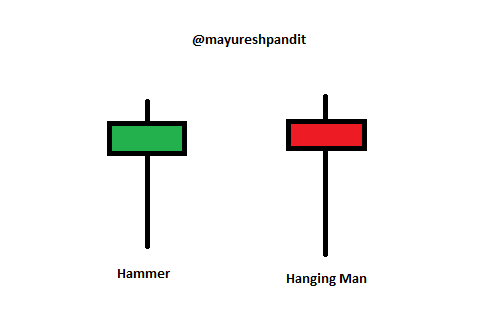
As you saw in the above image you will find both patterns are exactly the same but the difference between those is Hammer is always formed in the bottom of the chart and its signal as the downtrend will be changed to the uptrend and when this pattern found in the top of the chart that will be signal as uptrend will be changed into the downtrend. Colors is doesn't matter but in this position of the candle is matters. The formation of the body is smaller and lower shadow tf the body is approximately 3 times bigger than body.Let me explain you both the pattern in the live example.
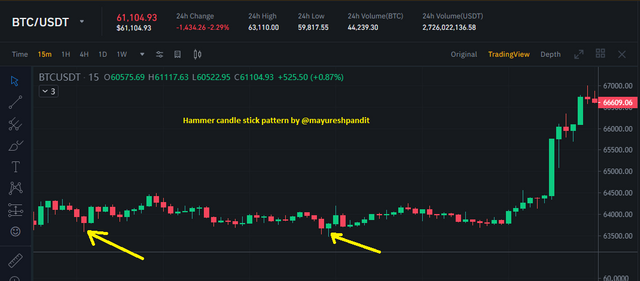
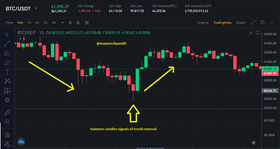
As you saw in the above charts of BTC/USDT you will found that Hammer is formed when price is in downtrend and when the hammer is formed from them it was the clear indication trend reversal. To confirm the trend reversal we have to wait for the next bullish candle. If we are doing actual trad than our stop loss will be the the lower band of hammer candle.

As you saw in the above image Hanging man candle is formed on the bullish trend and indicates us the trend reversal. To confirm the trend reversal we should wait till the next bearish candle and after that we can place the sell order for that particular financial asset.
2) Inverted Hammer and Shooting star
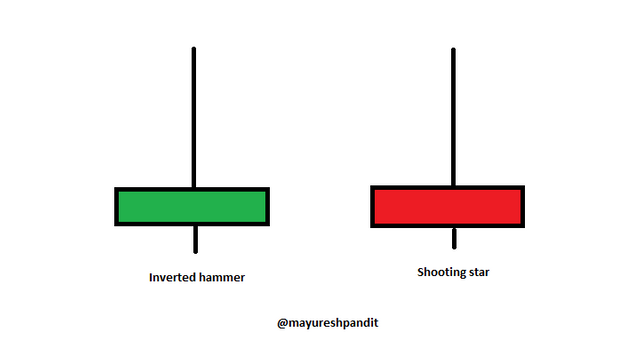
As you saw in the above image Inverted hammer and shooting star formation is same. As its body is smaller and upper shadow is almost 3 times bigger than body. But inverted hammer is the one of the bullish trend signal and shooting star is the bearish trend signal. Inverted hammer you will found always in the bearish trend and it indicates that trend will changed into the bullish trend and when you found this type of candle in the bullish trend than its called as shooting star and after the shooting star appear in the chart than bullish trend will be changed into the bearish trend. As I earlier said color of the candles doesn't matter but the position of the candles is matters the most.
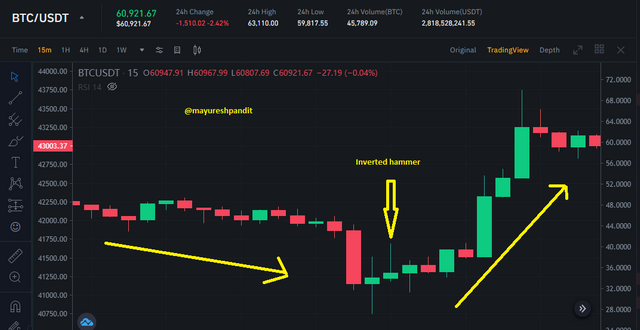
As you saw the above image you will observed that Inverted hammer is formed in the bearish trend and after inverted hammer formation trend is changed into the bullish trend. To confirm the trend reversal we have to wait until the next green candle if the green candle is the appeared on the chart than its confirm that we will witness a trend reversal and if we place the buy order than we will in the big profit.
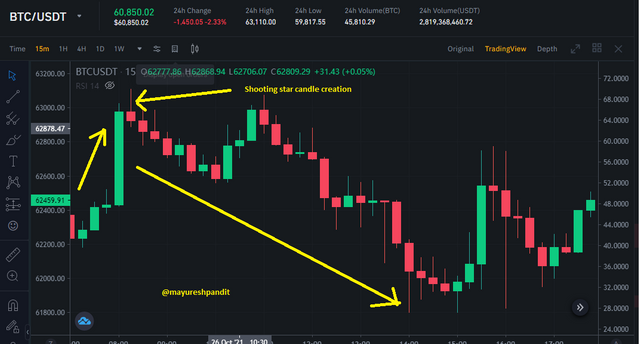
As you saw in the above chart you will observed that in the bullish trend shooting star is formed and after that trend is changed into the bearish trend. After we saw the shooting star in the chart we have to wait till the next candle if the next candle bearish candle than its confirm that trend is going to change and if we place the sell order than we will in the profits.
3) Dragonfly Dogi and Gravestone Doji
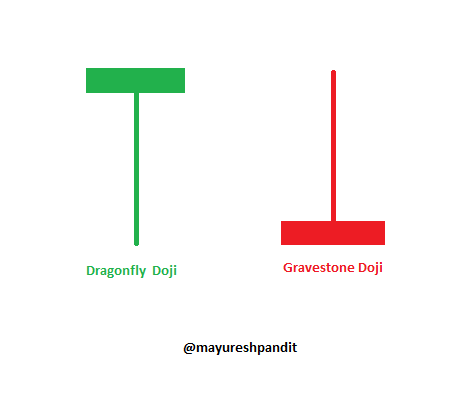
As you saw in the above image you will familiar with both dogi candles so you will think that is it really indicate us trend reversal? The answer is Yes. Let me explain the dragonfly dogi first. In the chart you will find the dreagonfly dogi in the bottom of the chart in the bullish trend. And meaning of the dragonfly dogi creation is sellers try to push the prize downside but the buyers are successful to make the closing price above the open price and because of this you will see the small body of the candle with the big shadow.
In the gravestone dogi candles you saw that body is formed smaller and with big upside shadow and it surely indicates that there is great fight between seller and buyer but in the end seller is able to keep the closing below the open price and that results into the red small body candle with big upper shadow. Typically you will find this candles in the top of the chart and its clear indication that trend will be changed.
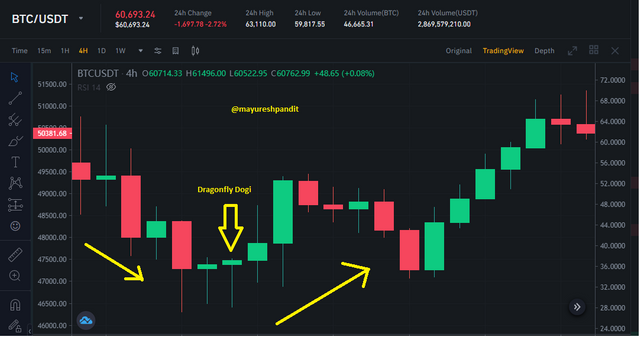
As you saw in the above image Dragonfly Dogi is formed in the bearish trend and it is indicates us the trend reversal. Once you saw the Dragonfly Dogi then to confirm the trend reversal you have to check the next candle. If the next candle is the bullish candle than its confirm trend will be changed from bearish to bullish.
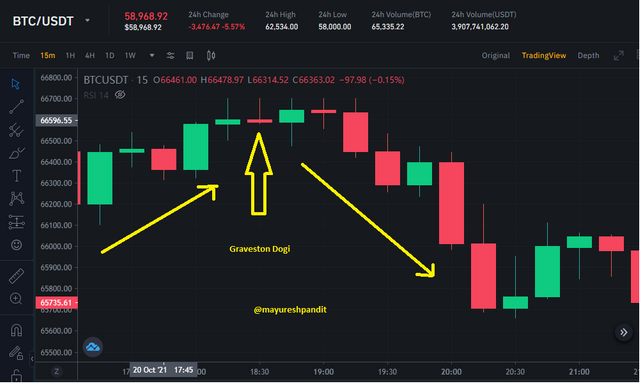
In the above image you observed that Gravestone dogi is formed in the chart when bullish trend is going on and after that trend is reversed to the bearish trend.
3) Bullish spinning top and Bearish spinning top
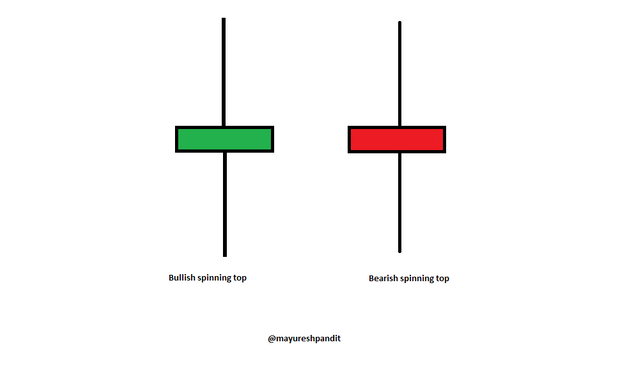
In the above image you observed that both the candle pattern are look same but when you saw this in the bottom of the chart it will be treated as the bullish spinning top and when you saw this formation in the top of the char than it will be called as the bearish spinning top. In the bullish spinning top upper and lower shadow must be 2 times bigger than body than it will consider as the bullish spinning top pattern. Similarly applicable for the bearish spinning top.
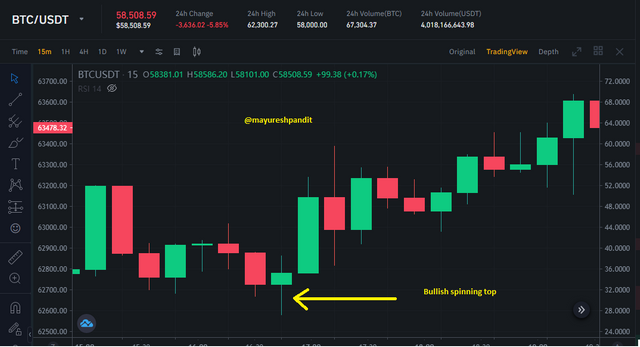
As I told you all bullish spinning top is found at the bottom of the chart and it will indicate the strong trend reversal.
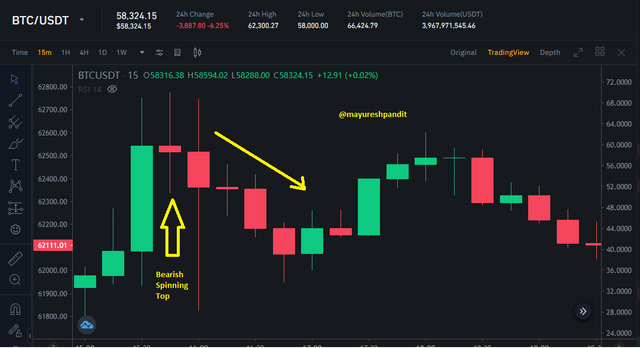
Bearish spinning top is found at the top of the chart and gives the signal of the trend reversal and it was very beneficial for us and help us to takes maximum returns from the financial assets.
Conclusion
In this chapter I tried to cover all the candlestic patterns but unfortunately there is so many various patterns and I did not shows that in my post. Marabozo,evening star,morning star, Bullish engulfing pattern and so on. From the all the lesson I just want to told you all we seen all the information on charts and also char will gives us the signal but for that we should have to read the properly. If we did a mistake to identify the pattern than it will be loss for us. So before investing the cryptocurrency we should have to read the charts,news and after that have to make decision of buy or sale.