Crypto Academy Week 12 - Homework Post for [@kouba01]
What is the Relative Strength Index - how is RSI calculated?
This RSI was developed in the 70s so that stockbrokers of those times could analyze the behavior of a selected asset, already with the new emerging technologies and the birth of cryptocurrencies adapts to these demands and now anyone with simple knowledge have access to this technical indicator, something that did not happen before since only stockbrokers could have access to that information.
how is it calculated?
When this scale from 0 to 100 increases it means that the asset is being highly bought, on the contrary if it decreases it means that people are exiting the asset and that it is clearly in a downward trend.
All these time periods can be modified to this day since there are digital tools that facilitate these technical analyzes, so it is very common to see 7-day periods and 5-minute periods and 1-minute periods, in the world of cryptocurrencies. It is the standard used in all technical analysis charts.
Can we trust the RSI in cryptocurrency trading and why?
Personally, I believe that since the RSI analysis is an analysis of moments, and the world of cryptocurrencies is governed by moments, good moments and bad moments, although the markets are unpredictable most of these moments if they are, since when there is calm or stability, the markets follow a pattern that always repeats itself, whether in an uptrend or a downtrend.
Another aspect to keep in mind is that this analysis has been used for a long time, which supports its usability to this day, thanks to its easy understanding and advantages that it can offer you when trading. That is why I recommend studying the principles of this Technical Analysis to get the most out of it.
How is the RSI indicator set on the chart and what does the length parameter mean? Why is it equal to 14 by default? Can we change it?
I personally use the Binance exchange, to configure this indicator we must follow the following steps.
1- We look for the pair that we are going to analyze. in my case STEEM / BTC, being in the pair we go to TRADING VIEW
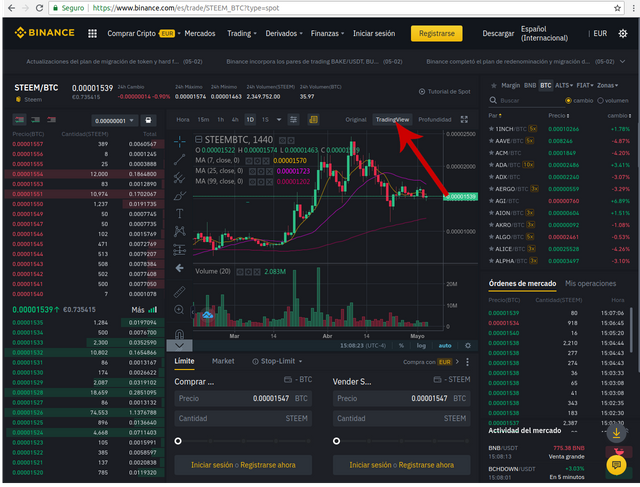
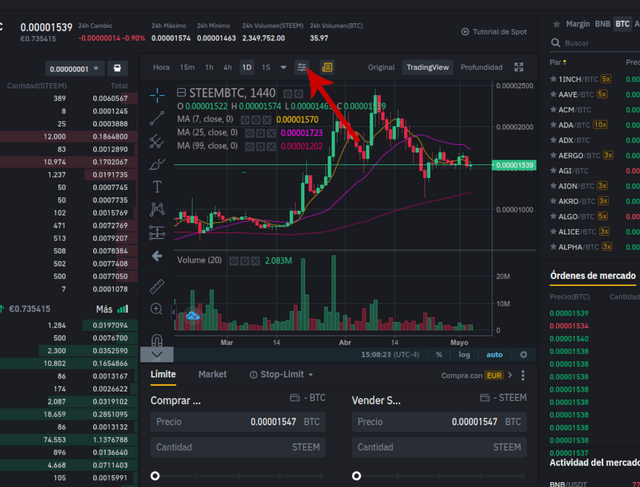
2- Let's go to the Technical Indicator Settings here.
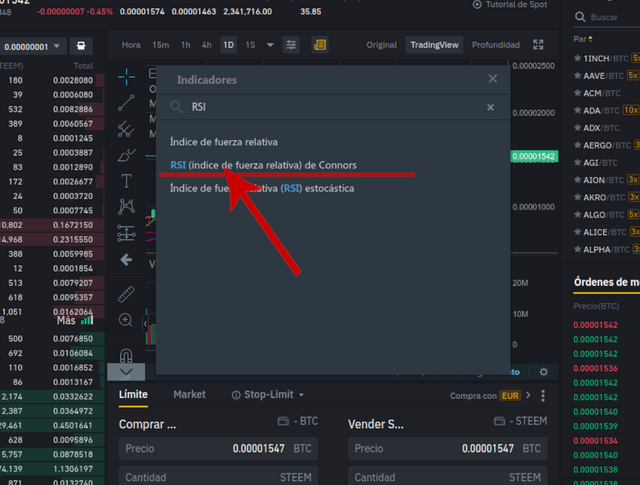
3- We look in the menu that displays RSI and we give a clip to the Obcion of RELATIVE FORCE INDEX
4- Already observing in the graph we give a clip in RSI Settings
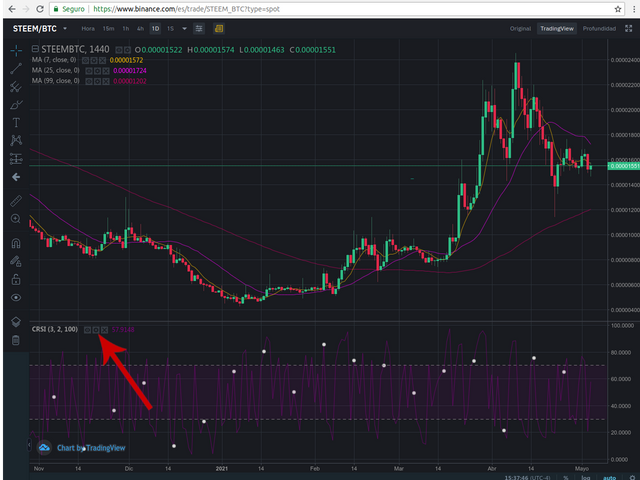
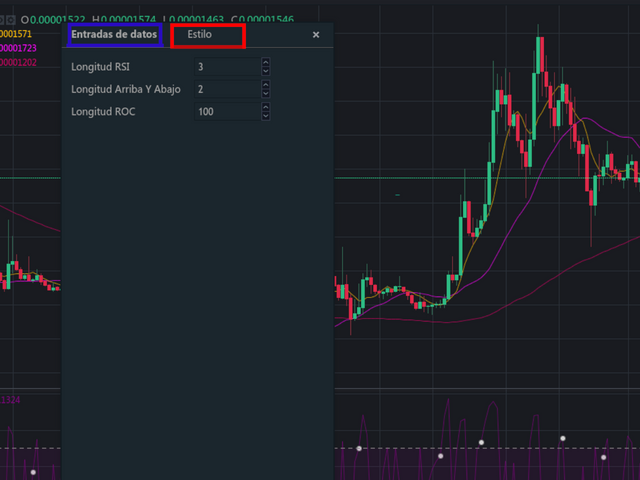
5- In the pop-up window we can configure both the data entry and the style of the graph.
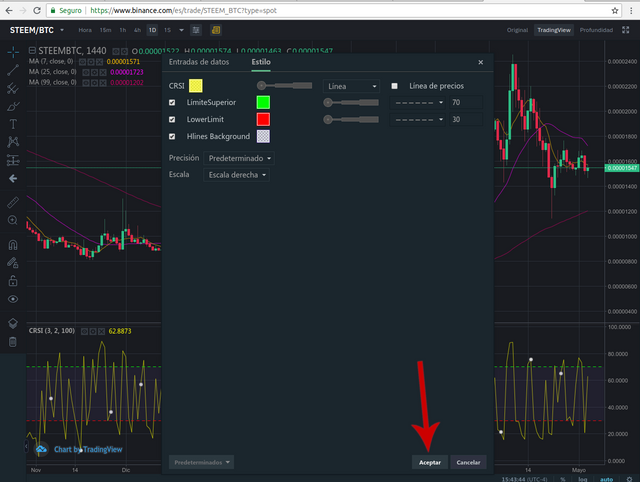
6- Edit the graphic style to your liking and click on accept.
Why is it equal to 14 by default?
As I mentioned before, this number is used by default because there are 14 periods to calculate between the average of the sales and the average of the support, this was thought this way by its creator welles wilder since it was the formula that worked for him and is the most effective until the moment.
Can we change it?
1- If it can be changed first let's zoom in to see the graph in more detail as you can see it in 1
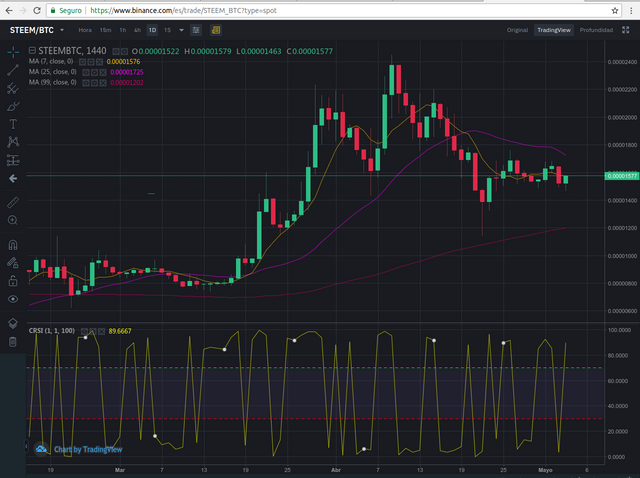
2- Now we are going to go to RSI settings
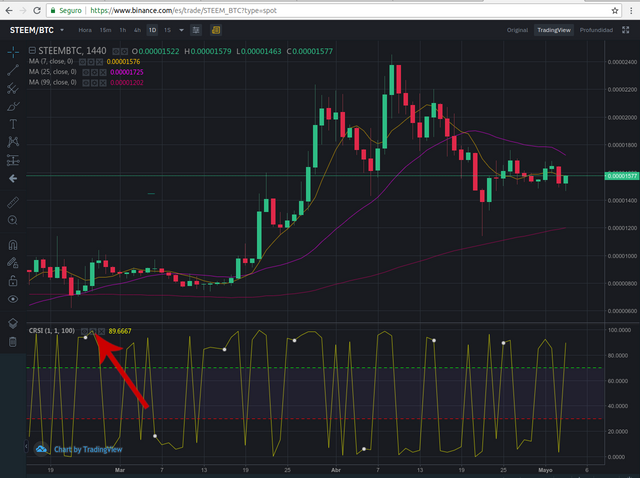
3 - We modify the parameters in my case I am going to set them by default in 14 since I had them set in 1
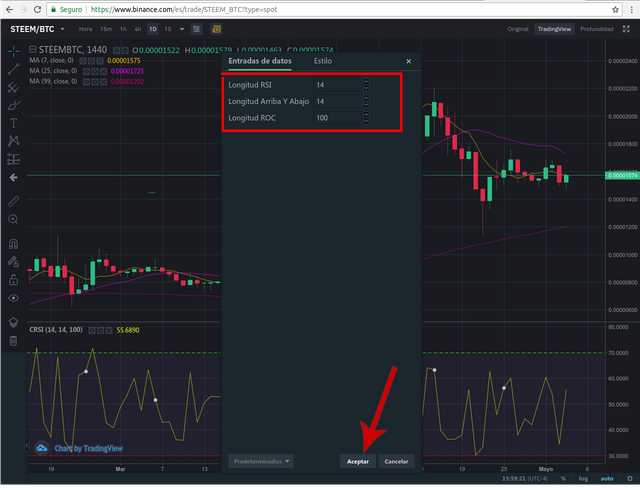
4- Here the result.

How do you interpret overbought and oversold signals when trading cryptocurrencies?
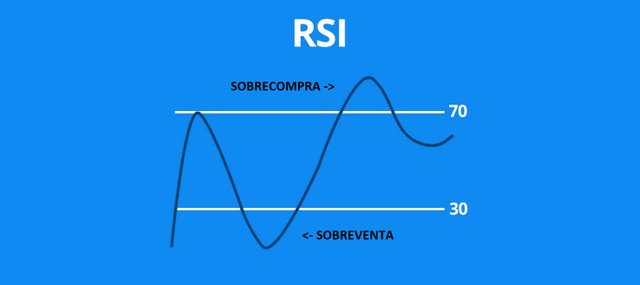
These overbought and oversold signals are peaks generated by one or another action, for example overbought causes the price to skyrocket in such a way that there is no one available to buy at such a high price that it causes the price to fall suddenly, the same happens with oversold but in reverse.
Understanding these principles we can analyze that there is an unnatural movement effected by the game of supply and demand. where there is no price equilibrium generating exaggerated price changes.
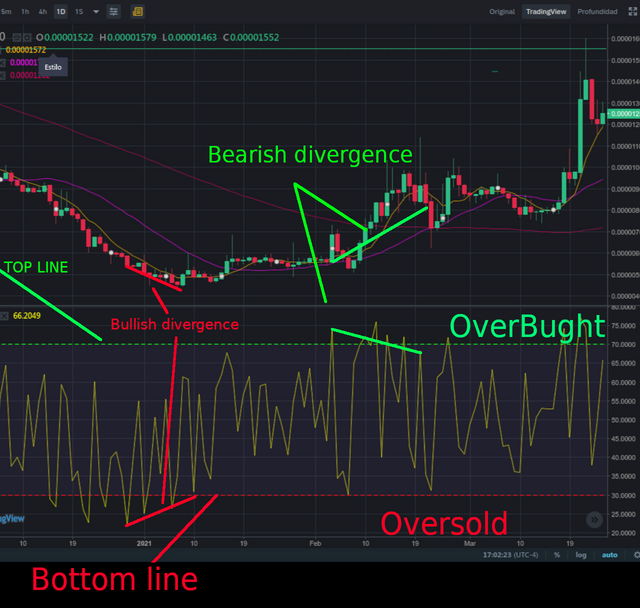
These signals are evidenced in the lines marked on the graph where 70 or more indicates that there is an over-purchase of assets and that of 30 an over-sale.
Let's see all this in the image.
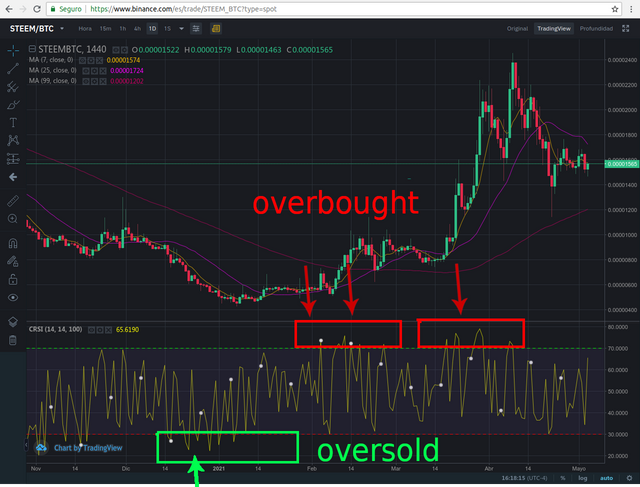
How do we filter RSI signals to distinguish and recognize true signals from false signals?
There are indicators that help us to distinguish these signals, and they are divergences, since when a market opts for a specific trend it is easy to detect such divergences and therefore we can predict future signals in the market. This is clearer to see with examples.
Bullish divergence
Existence of a price drop but the RSI marks a high low.
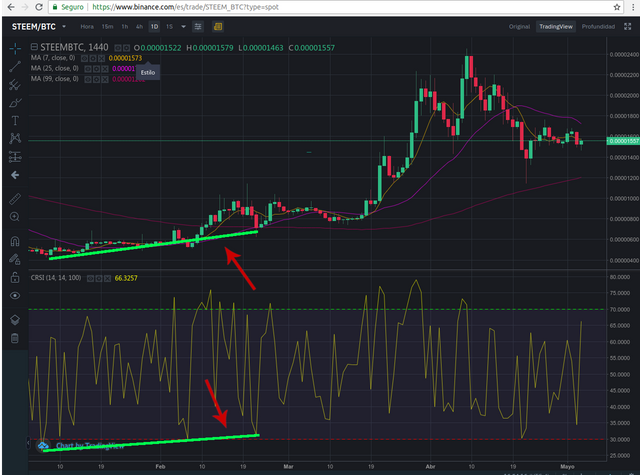
Bearish Divergence
Price tops high and RSI low.
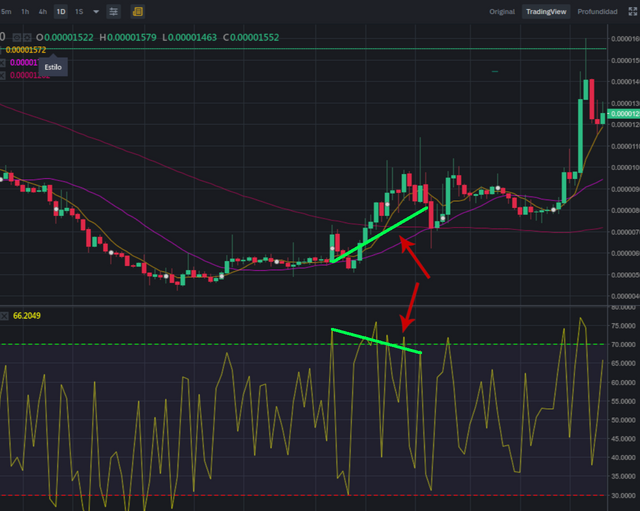
Review the chart of any pair (for example, TRX / USD) and present the various RSI signals.
Conclusion
RSI analysis is a tool used for years by asset market analysts, now it has been implemented in the cryptocurrency markets, personally I did not like the market analysis because I always thought that the market did not care about the analysis, it only exploded when I wanted to and that's it, but I have changed my mind this tool is very useful to learn about the changes to futures in the market and I finally see a utility in technical analysis.
CC:
@kouba01
@steemitblog
Hi @mayrelisvasquez
Thanks for your participation in the Steemit Crypto Academy
Feedback
This is just average work done. Kindly put more effort into your work.
Homework task
5
So impressive!