Steemit Crypto Academy | Course 2 By @stream4u| How To Read Ckit55andlestick Charts In Different Time Frame & Information about Buy-Sell(Support & Resistance) by @maykit55
Candlestick charting is the way to check prices, and this was invented in Japan years ago and this type of charting is the best way to analyze at different stages the movement of the currency and thus know where we can start the investment.
Why is the color of the candlesticks green and red?
We have all wondered why the color of these graphs, the answer is somewhat simple, the green ones are green when the close of the day is above the previous close and red when the close is lower than the previous close.
The fact that prices increase momentarily does not mean that the price opens the next day higher than the previous one, it is something that could happen but it is not always the case.
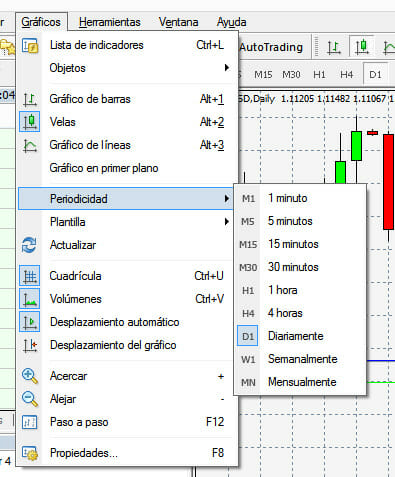
Explain with the candlestick chart, what are the available time frames we can set on the chart and why is it necessary to change the candlestick time frame?
The first thing to know is that we must know what is the time we want to identify as it can generally be from 1 minute to 1 month, for example these candlestick charts if we decide to work with 5-minute candles, every 5 minutes a candle is formed and so gives way to the next candle. The same as if you decide to work with candles of 1 week or 1 month, although this type of candles are not useful to make a short-term investment because they are not reliable to analyze what is happening, to work in the short term we recommend candles of 1 minute, 5 minutes or 30 minutes.
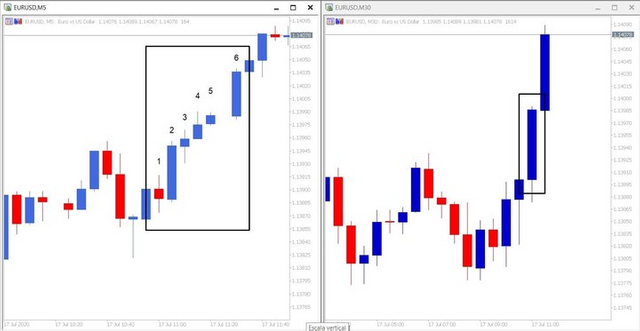
Show any particular asset candlestick chart on a different time frame and briefly explain what you see on the chart, such as what trend we see, what the price levels are.
This image explains two types of charts, a 30-minute chart and a 5-minute chart. The 30-minute chart shows the price action in a single candlestick, while the 5-minute chart shows 6 candlesticks to show the price evolution in the same period as the 30-minute chart.
What kind of traders are available in the market, explain how they work?
The different types of trading are:
Day Trading: this opens and closes trades on the same day they see it as short term investment as they do not leave any trades open for another day.
Scalping: works in very short periods during the course of the day on transactions that can last a matter of seconds.
Swing Trading: this is a long-term trader as its transactions can last for days.
Trend or directional trading: this trader only takes advantage of the moment and that's it.
When trading or investing in assets, what is the importance of support and resistance, explain how they work?
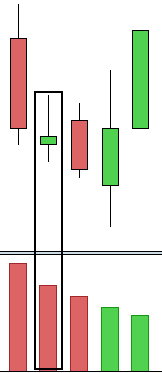
The support is the moment when the decline slows down to start going up.
Resistance is the moment when the price stops going up and starts going down.
How we can find support on the candlestick chart, explain with one of the asset candlestick charts with screenshot and point out the levels.
As we can see in the image, when more buyers than sellers coincide, this is the moment when the rebound occurs and the price rises.
