Steemit Crypto Academy – Season 4 - Week 2 - Post for Professor @kouba01 - Volume Indicator
Hi everyone and Assalam u Alaikum,
Q. 1. Explain the volume indicator in your own words.
Volume indicator is a very handy tool that helps the traders in analyzing the market trend. Volume indicator shows the number of assets traded in the market in the given period of time. Time frame can be different and similarly the volume indicator provides the result depending upon the time period chosen by the trader. When daily time frame will be used, Volume indicator will present the trading volume of that particular asset in 1 day.
Volume Indicator is usually used on charts in shape of columns at the bottom of the chart that presents the trading activity in the market. If the column is bigger, it means Higher activity in the market, if the column is smaller, it shows that there is very less activity in the market.

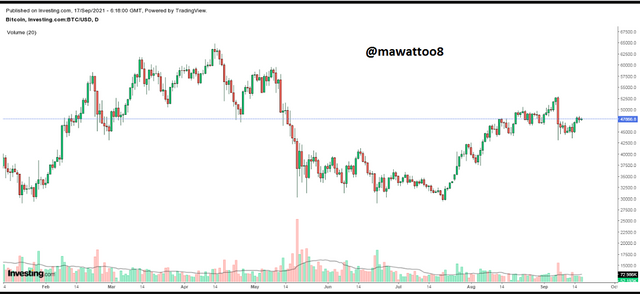
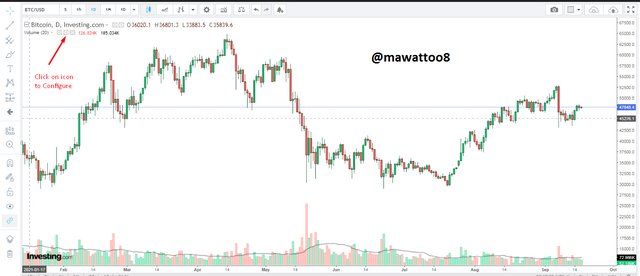
In the above screenshot, it can be seen that Volume is being shown at the bottom with bars. These bars are of 2 colors, Green and Red. When a Bullish candle is formed, the Green bar is created showing that there was Bullish or Buying activity in the market. On the other hand, when a Bearish candle is formed on the chart, Red bar is created in the Volume Indicator showing that there was Selling activity in the market. Moreover, size of the bar is also an indication of strength of activity. As I mentioned earlier that a long bar represents the strong activity in the market, can be both Selling or Buying, while a smaller bar presents a weak activity in the market.
Q. 2. Use a platform other than Tradingview to present the volume indicator on a chart and show how to configure its parameters by justifying your choices.
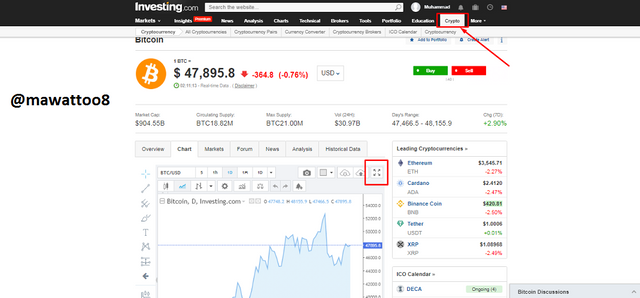
To present volume indicator on a chart other than Tradingview, I have used investing.com platform for this purpose and I opened the website and then choose crypto tab to search for crypto assets charts.
Then I clicked on the highlighted icon to expand the chart and the next appeared as given below.
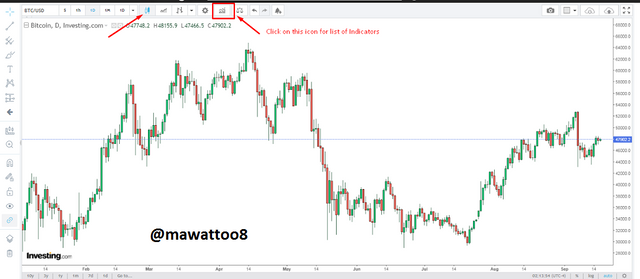
I selected Candlestick pattern and then clicked on the selected icon to apply the indicator on the chart. The next interface will be as follows.
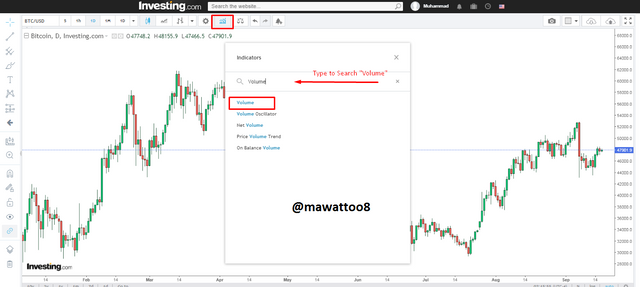
Now type "Volume" in search bar and click on Volume as shown in the screenshot and the Volume Indicator will be applied to the chart. It will be shown as given below.
In this way, Volume Indicator can be applied to the chart. Now we will learn how to configure or change the setting of Volume indicator.
Click on the Icon indicated in the below screenshot at the left of the chart.
By clicking on the icon, the next interface will be shown as given below.
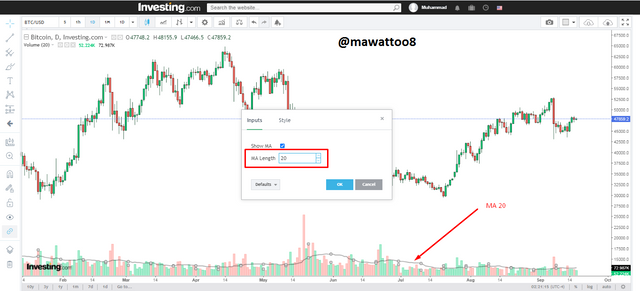
Under the Input tab, there is an option of MA Length that is length of Moving average and there is also box to show or not to show MA with volume indicator. If we want to show MA with Volume indicator, we will check the box, otherwise uncheck the box. MA Length can be changed and a trader can change it according to his trading strategy but I will use default value for myself.
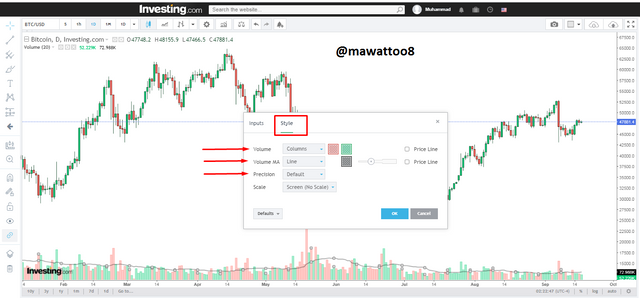
There is another tab of Style and by clicking on it, the colors of Bars and MA can be changed. The above screenshot illustrates how you can change it. Default settings can also be used and I am using default setting for it. After changing these setting, Click on Ok and it will be changed and applied to the indicator. This is the way to configure the Volume indicator on this platform.
Q. 3. What is the link between Volume and Trend and How to use volume to predict a trend reversal?
Market has mainly 3 movements that are 1. Uptrend, 2. Downtrend and 3. Sideways Movement. Price action to me is the basic of any analysis and along with Volume Indicator, it can produce very good results. In trending market, whether it is Bullish or Bearish, Volume will increase and it shows the strength of the trend. More people are interested in the asset and Increasing volume shows the interest of the people in that asset.
Uptrend Market and Volume.
When market is in Uptrend or there is Bullish trend in the market, Bullish candles will be formed and it will go upwards. Volume indicator should also show the increase in volume. If the market is going upwards and Volume indicator is also showing increase in the volume, it indicates the Buying pressure in the market and a strong uptrend is prevailing.
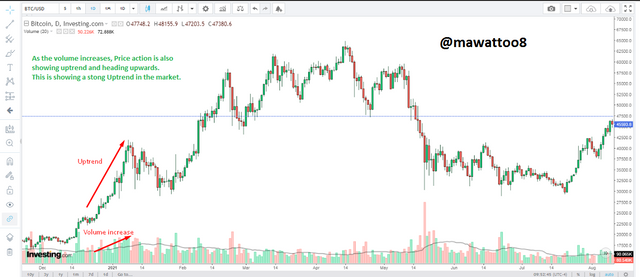
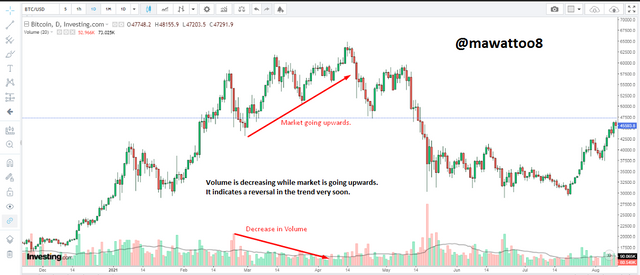
This above screenshot shows that when volume is increasing in an uptrending market, it shows a strong Bullish or Uptrend in the market. On the other hand, when market is moving upwards after a strong bullish trend and volume starts to decline or decrease, it shows weakness of trend and less interest of people in the asset. This indicates a possible reversal in the trend in the near future.
Downtrend Market and Volume.
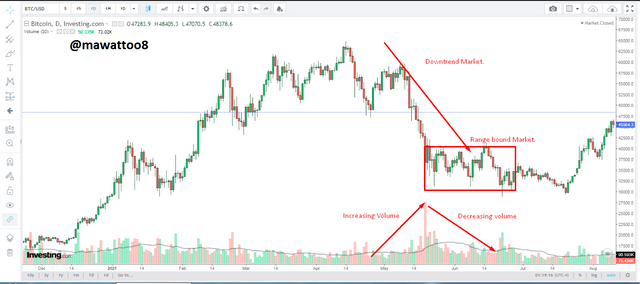
In Bearish of Downtrend market, if the volume in increasing and the price actions also shows downtrend in the market, it can be assumed that there is a strong Selling pressure in the market and market will move downwards. Downtrend market with increasing volume shows that people are very much interested in selling this asset, hence market will move downwards fastly.
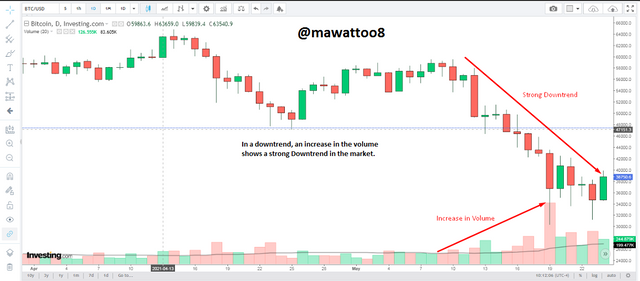
In the above screenshot, it can easily be seen that with increase in volume, the downtrend in the market gets strong and there is a strong selling pressure in the market.
After that, there is a decrease in the volume that shows lack of interest by the people and they are not willing to sell the asset any more below this price. This shows a weakness in the Downtrend and indicates about a possible reversal in the market or sideways movement of the price of that asset.
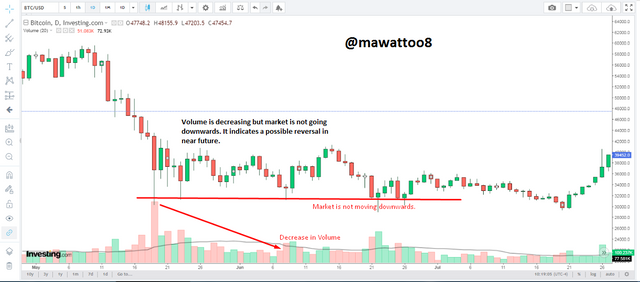
In this screenshot, a decrease in the volume can be seen that shows the weakness of the Downtrend and the market has turned into a sideways market for a considerable period of time. It also indicates that a reversal can happen in the market.
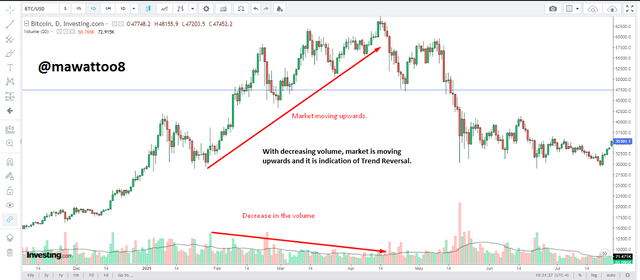
In this above screenshot, we can understand how a trend reversal can be detected using Volume indicator. As it can be seen that volume is decreasing and the market is still moving upwards, this shows weakness in the trend and a reversal in very near. So after some time, you can see that a reversal has took place and trader can exit the market in a very good time with the help of Volume indicator.
Q. 4. How to use the volume to have a signal confirmation?
There are two types of markets which are Treding market and Sideway market. We will discuss how volume indicator can be used to confirm a signal in the market.
Breakout of Sideway Market.
When the market is range-bound, it is called Sideway market. Price moves in between a range price and Support and Resistance lines are marked on the chart. When market breaks this range with increased volume to either side, a trader can take Buy/Sell position in the market.
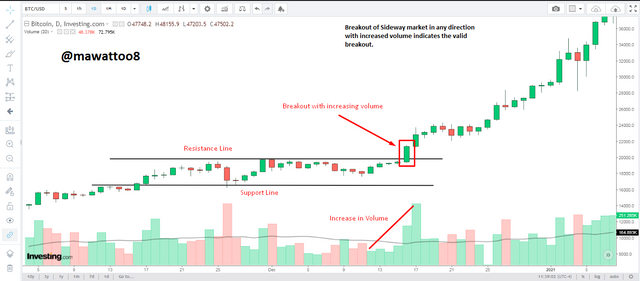
In the above screenshot, it can be seen that the market has remained range-bound for few days. Then the volume started to rise and the market price of the asset broke the Upper Range that has been marked as Resistance line with higher volume. This breakout was confirmed with the volume indicator and it shows that there is a buying pressure in the market. After the breakout of this upper range line, the market continues its up movement. Hence Volume indicator can help trader to locate and confirm such signals.
Breakout of Support/Resistance line in Trending Market.
In the trending market, Both Up and Down, Support and Resistance levels plays very important role. In an uptrending market, Resistance levels are considered the points, from where the market can make a reversal. While in Downtrend market, Support levels are considered to be the points from where market can make a reversal.
On these Support/Resistance levels, many fake signals are also created and most of the traders are trapped by these fake signals and they lose their investment. Volume indicator can help the traders to confirm the breakout as valid or fake.
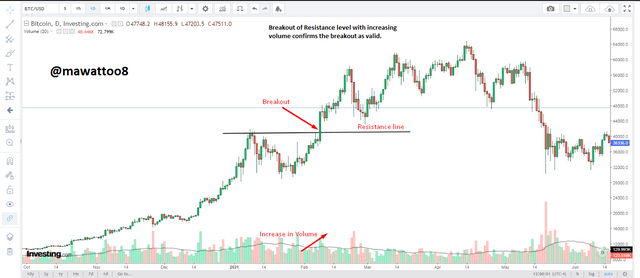
In the above screenshot, a breakout of Resistance level in uptrending market has happened with an increasing volume, that indicates the breakout a valid breakout and after that market has moved upwards. So Volume indicator can help the trader to confirm the breakout signal in a trending market and trader can go long on this signal.
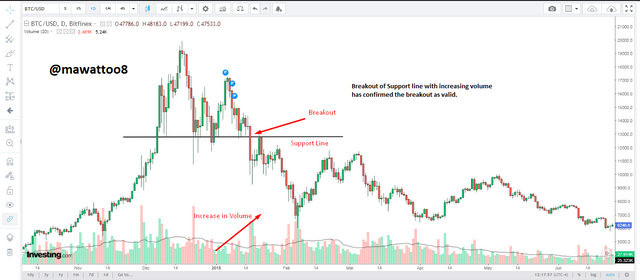
In this screenhsot, breakout of a Support line with increasing volume has been pointed out as a Valid breakout. In December 2017, after making a high of about $20,000, BTC made a reversal and then the breakout of the support level was confirmed and a Downtrend in the market prevailed afterwards. In this way, in trending market, Volume indicator can help the traders to locate and confirm the breakout signals.
Trend reversals can also be located with the help of Volume indicator which we have discussed in the previous question where divergence in price action and volume indicates the possible reversal in the market, So Volume Indicator can help the traders to be able to confirm the breakout signals as well as Trend reversal at an early stage.
Q. 5. How does the volume reflect the evolution of prices in the charts and why does the volume sometimes anticipate the price?
Volume indicator provides the indication with the price movement. Evolution of price is reflected by the volume indicator and it corresponds to the interest of people in any asset. When the price is moving upwards and there is an uptrend in the market of an asset, volume also increases and shows that people are more interested in buying the asset and there is a Buying pressure in the market. After the uptrend, when profit taking period starts, the volume starts to decrease that shows the disinterest of people in buying the asset rather than to sell the asset at this price. So volume indicator reflects the behavior of Buyers and Sellers in the market thus letting the trader know and act accordingly.
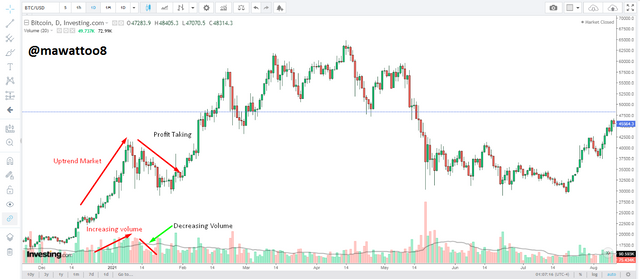
In the above screenshot, in uptrend market, when the volume increased, the price movement was very strong and it showed that more people are willing to buy this asset at this price. After an upward rally, then volume started to decrease that is an indication of disinterest of people and profit taking phase started. Hence volume indicator shows the behavior of the people and buying or selling pressure in the market.
In Downtrend market, when market moves downwards and the volume starts increasing, it shows that more people are interested in selling the asset at this price and trading volume increases. After the downtrend, volume started decreasing that shows that sellers are no more in the market and a reversal or Range-bound Market will start from here.
In the above screenshot, you can see that in Downtrend, when price was moving downwards fastly, the volume was increasing and market made a low. After that low price, volume started decreasing and market was unable to move more downwards as sellers are no more in the market and price action will show a range-bound market or a reversal can happen from this. This is how volume indicator reflects the price movement.
Why Volume sometimes anticipate price.
When market moves in an uptrend, volume also increases. Then a pullback happens as we all know that market moves in such a way that it makes higher highs and higher lows and thus moves upwards. In this pullback, sometimes volume started to increase that shows the interest of the people in buying the asset. This is the point where successful traders again buy at lower prices and some traders exit the market and lose their positions. Volume indicator anticipates the price and it shows that with increasing volume, there is still uptrend in the market and market will move upwards again after a pullback.
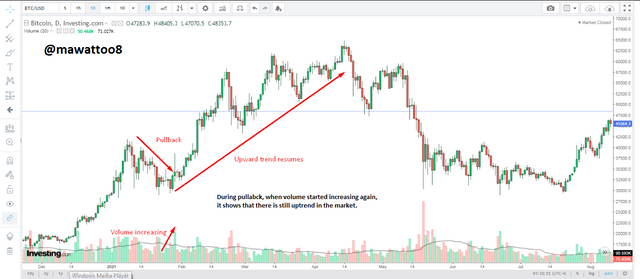
In the above screenshot, it can be seen that during a pullback volume started increasing and then an upward price movement started. Volume indicator anticipated price at this point and trader can benefit from it at large and it can be seen that market movement after this was very sharp and smooth.
Q. 6. Is it better to use the volume indicator alone or use it in parallel with another indicator when trading.
As we all know this fact that no indicator is 100% and same applies to Volume indicator. No indicator can solely be used for analyzing and trading purpose. Always use multiple indicators for better results. Volume Indicator should also be used along with some other indicators or trading strategy.
I will use Volume indicator with Moving Average 50 and we will see how good its results will be. I will also use BRB (Break Retest Break) strategy on the chart and apply volume indicator.
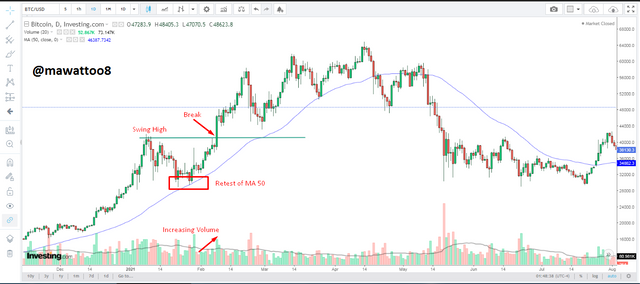
In the above screenshot, you can see that I have applied MA50 on the chart and also marked a Swing High on the chart. You can see that after a swing high, a pullback started and volume started to decrease. At the point where market has retested the MA50, Volume also started to increase and it indicates that pullback has ended and the uptrend will resume from this point.
On the point of Swing high, it also has broken the Swing high with increasing volume and it has validated this break as valid one and then uptrend resumed its upward movement. In this way, a trader can go Long on both of the points, 1) when MA50 was retested and volume started to increase, 2) when swing high was broken with increasing volume.
Q. 7. The volume indicators are multiple, choose one of them to briefly explain its usefulness in crypto trading.
There are many different volume strategies are available in indicators shape and their calculation is also different from each other. Their plotting and configuration differ from each other. Some of these indicators list is given below.
- On-Balance Indicator.
- Volume RSI.
- Volume Price Trend Indicator.
- Money Flow Index.
- Chaikin Money Flow Indicator.
- Accumulation/Distribution.
- Negative Volume Index.
- Klinger volume oscillator.
I will discuss Klinger Volume Oscillator in this section of the post. In this Oscillator, volume of inflow and outflow of the underlying asset is compared and opening and closing prices of a crypto assets are used to generate volume needed for the volume oscillator. Two moving averages are also used in it with one Slow moving average and other Fast moving average. It means that one is short period moving average and the other is long period moving average.
When applied on the chart, there are values on the indicator and center line is Zero while other values are below and above this zero line. There are two lines which are blue and green by default. Blue line is fast moving line and Green line is Slow moving line. Green line is also called Klinger line while Blue line is called Signal Line.
These lines move below and above Zero line and creates signals by intersecting each other. Now we will try to learn how these signals are created on chart with the help of screenshots.
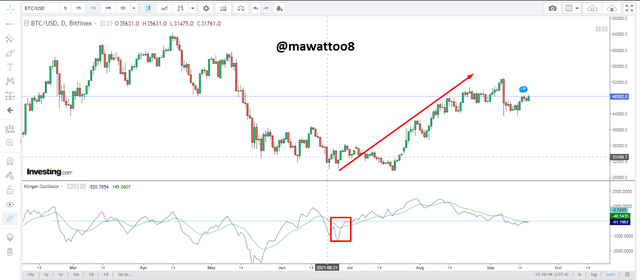
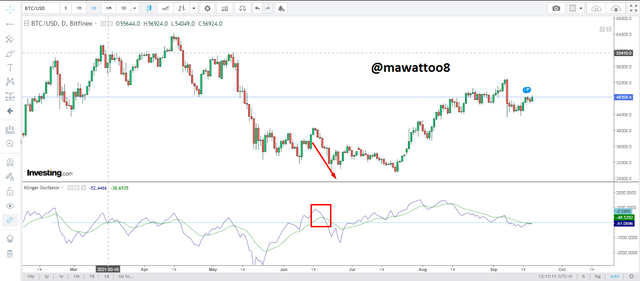
In this screenshot, it can be seen that Green line and Blue line both are below zero line. Then Signal line crossed Klinger line from below to upwards and it is a signal of Buy. Market has also reacted same and it has moved up.
In the above screenshot, it can be seen that the blue was above Green line and then it crossed the Klinger line from up to downwards above zero line. Market also reacted same and it moves downwards. This is how Klinger Volume Oscillator works.
Conclusion.
To conclude, it can be said that Indicator have their importance in analyzing the market but at the same time, these indicators should not be used alone. These indicators should be used along with other useful indicators to get better results.
In this lecture, we have discussed about Volume Indicator that is also very important indicator which shows the behavior of the people regarding a crypto asset. When more people are interested in Buying the asset, volume indicator will show increase in the volume and when people are not interested, less volume will be shown on the indicator. Same stands for selling of an asset, with increasing volume in downtrend it can be assumed that more people are interested in selling the asset while decreasing volume indicates about less selling pressure in the market.
Thanks in anticipation.
Hello @mawattoo8,
Thank you for participating in the 2nd Week Crypto Course in its 4th season and for your efforts to complete the suggested tasks, you deserve a Total|10/10 rating, according to the following scale:
My review :
Work with excellent content, because you have taken every question seriously, allowing you to get answers that are precise and in-depth in its analysis and clear in its methodology.
Thanks again for your effort, and we look forward to reading your next work.
Sincerely,@kouba01
Thanks Sir for your review and appreciation.