Crypto Academy / Season 3 / Week 8 - Homework Post for Professor @cryptokraze. Trading Sharkfin Pattern
Hi everyone and Assalam U Alaikum,
Q. 1. What is your understanding of Sharkfin Patterns. Give Examples (Clear Charts Needed)
Market moves by making patterns and swings. Sometimes market moves in a direction very quickly and makes a reverse move immediately. This quick move makes a shape of V or Invert ed V and this is called Sharkfin pattern.
When market is in downtrend and it moves quickly. Then it makes a quick reverse move to upwards. On this case V shape can be seen on the chart. On the other hand, when market is moving upwards and then it makes a quick reverse move to downwards, and an Invertered V shaped move can be seen on the chart. It is called Sharkfin Pattern.
Examples of Sharkfin Pattern.
Now I will show how a Sharkfin pattern can be seen on the chart.

In the above chart of BTCUSD with 15 minutes timeframe, it can be seen that market was moving downwards. Suddenly it makes a quick move upwards and started moving upwards. It is a quick reversal to upwards and a makes V shape.

In this above chart of BTCUSD, market movement was to upwards and then quickly it made a reverse move to downwards. It has formed an Inverted V shape on the chart. I have drawn an Invertered V on the chart and it is called Sharkfin pattern.
Q. 2.Implement RSI indicator to spot sharkfin patterns. (Clear Charts Needed)
A trader cannot analyze the market on a chart without any Indicator on it. There is always possibility of fake signals and patterns on the chart. In the same way, Sharkfin pattern can be a false signal sometimes and a trader can lose his capital. It is recommended to add some indicator on the chart and trader should first look for confirmation of the pattern and then enter the market.
RSI has been recommended by the Respected Professor and it should be taken as part of this strategy that will help the trader to confirm the pattern and then enter the market. Relevant Strength Index (RSI) should be applied with its default settings with values of 30 and 70. These values levels should be shown with a line on RSI indicator.
After applying RSI indicator on the chart, trader should look for Sharkfin pattern on the chart. I will show examples of Sharkfin Pattern with the help of RSI indicator for both Bullish and Bearish Reversals.
Bullish Reversal Sharkfin Pattern.
Bullish Reversal Sharkfin pattern happens at the end of downtrend market. When the market is in the downtrend and suddenly it makes a reverse move to upwards, the trader should look the RSI indicator and it should be below 30. If RSI is not below 30, there is a possibility of fake pattern.
After the reversal move, RSI should also move upwards and cross the 30 value line. In this case Bullish Reversal Sharkfin Pattern will be valid and the trader should enter the market by taking Long Position.

In the above screenshot, it can be seen that V shaped pattern has been formed and at the same point, RSI is also below 30. Then market started upward movement and RSI also follow it and move upwards. When RSI enters the area above 30, a trader can take Long Position in the market. Thus Bullish Reversal Sharkfin Pattern should be confirmed with the help of RSI.
Bearish Reversal Sharkfin Pattern.
Bearish Reversal Sharkfin Pattern is formed at the end of an Uptrending market. When market is moving upwards and suddenly it makes a quick reverse move to downwards, and Inverted V shaped pattern is formed, the trader should look at RSI value and it should be above 70 value line. If RSI is not above 70, it can be a false signal.
When an Invertered V pattern is formed on the chart and RSI is also above 70, it can be Bearish Reversal Sharkfin Pattern. Trader should wait for RSI to move below 70 and market should continue its reversal move to downwards. When RSI moves below 70 line, here a trader can take Short Position.

In this above screenshot, after a quick upward move, market suddenly made a reversal and moved quickly to downwards. At this point RSI is also above 70 line and then it moved downwards along with market downward move. When RSI moved down 70 value line, here the trader can go short and take Short Position. In this way, Bearish Reversal Sharkfin Pattern is confirmed with the help of RSI indicator.
Q. 3. Write the trade entry and exit criteria to trade sharkfin pattern (Clear Charts Needed)
In this section of the post, I will explain the criteria for entering a trade, Buy or Sell, which is very necessary to follow before taking any position in the market. On crypto exchanges, only Buy option is available for crypto assets trading while on Meta Trader 4 and margin trading platforms, Sell position can also be taken.
Entry Criteria for Buy Position.
RSI should be applied on the chart with its default settings. Lines for 30 and 70 values should be available on RSI indicator that shows Overbought or Oversold position of an asset.
Trader should wait for the market to make a quick move downwards and then a quick reversal move should be made to upwards to form a V shaped pattern.
Trader should confirm that RSI has gone below 30 value showing oversold and then it should move above 30 value and V shaped pattern should be formed on RSI indicator.
When RSI moves above 30 line, trader should enter the market by taking a Long Position or Buy trade should be entered. This move of RSI above 30 line should be very clear that will confirm that Sharkfin Pattern has been formed on the chart.

Entry Criteria for Sell Position.
RSI should be applied on the chart with its default values. Lines for both 30 and 70 values should be available on RSI indicator that indicate Overbought or Oversold position of crypto asset.
Trader should wait for a quick move upwards and a quick reverse move to downwards making an Invertered V shaped pattern on the chart.
At this point, trader should confirm the RSI line and it should be above 70 showing overbought and then it should move downwards below 70 value line to form an Invertered V shape.
When RSI moves below 70 clearly and market also continues its move downwards, trader should take Short Position. The move of RSI below 70 should be very clear.

Trade Exit Criteria
In this section, we will discuss about exit criteria of a trade, both Buy and Sell. Takeprofit and Stoploss should be used by the trader for every trade taken.
Exit Criteria for Buy Position.
After entering a trade, the first thing a trader should do, is to set Stoploss level. If the market goes in the opposite direction than expected, Stoploss level should be set to avoid huge loss.
In the Buy position, stoploss should be below the swing low of the Sharkfin Pattern.
In case, market moves in the opposite direction than expected, and stoploss level is hit, it means that the trade setup is invalid and trader should exit the market.
If the market moves in the direction as per expected, Takeprofit level should be set by the trader.
Takeprofit level should also be set at ratio 1:1 R:R (Risk:Reward) at least which means that it should be equal to Stoploss.
If market moves as per expected, then Takeprofit level will hit and trade will be closed with profit automatically. In this way, trader will book the profit and exit the market.

Exit Criteria for Sell Position.
If the market goes in the opposite direction than expected, Stoploss level should be set to avoid big loss.
In the Sell position, stoploss should be above the swing high of the Sharkfin Pattern.
In case, market moves in the opposite direction than expected, and stoploss level is hit, it means that the trade setup is invalid and trader should exit the market.
If the market moves in the direction as per expected, Takeprofit level should be set by the trader.
Takeprofit level should also be set at 1:1 R:R (Risk:Reward) at least which means it should be equal to Stoploss.
If market moves as per expectation, then Takeprofit level will be hit and trade will be closed with profit automatically. In this way, trader will book the profit and exit the market.

Q. 4. Place at least 2 trades based on sharkfin pattern strategy (Need to actually place trades along with Clear Charts)
In this section, I will show trades taken by me on the basis of Sharkfin Pattern strategy.
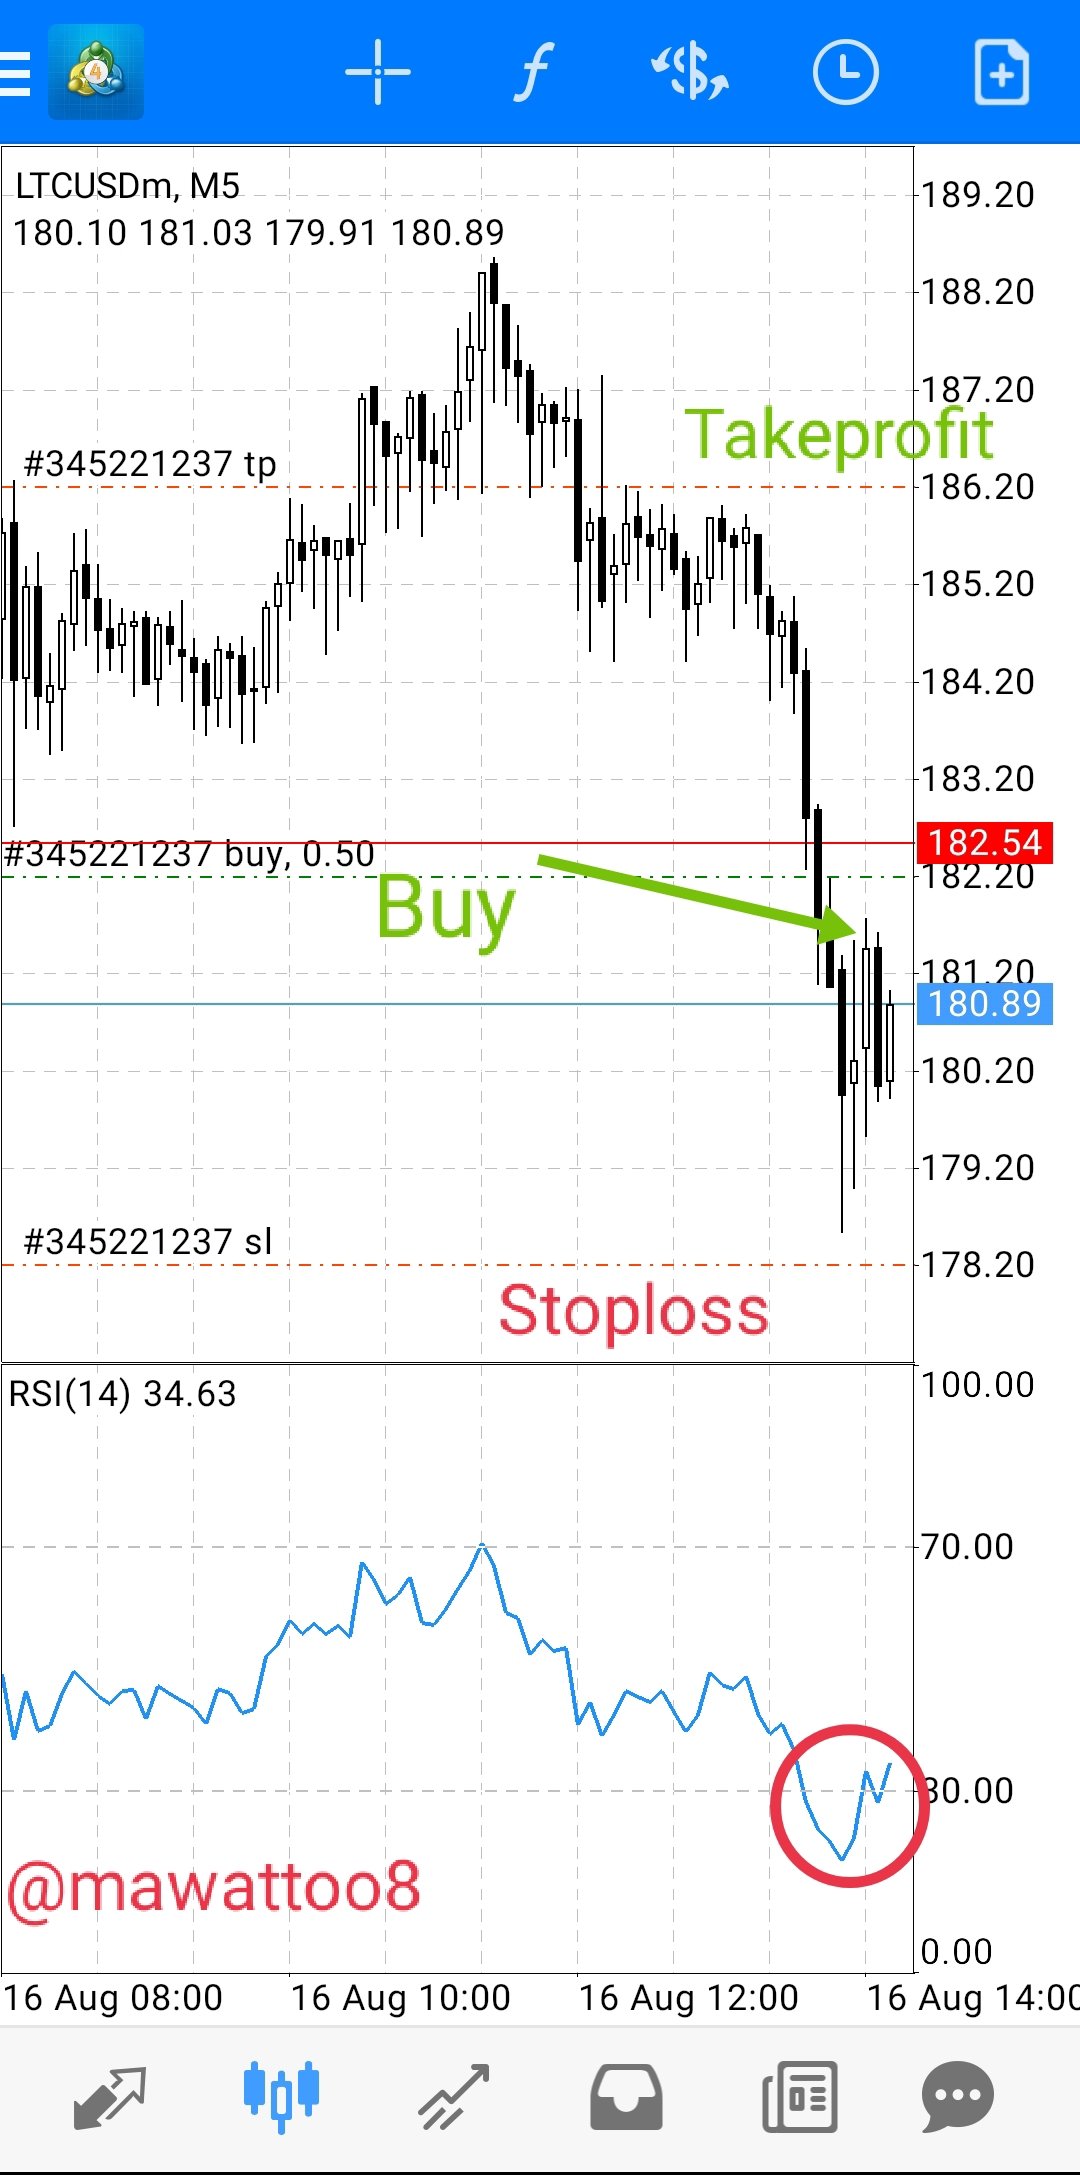
In the above screenshot, I have taken Long Position on LTCUSD in 5 mints timeframe. RSI was below 30 when this Bullish Reversal Sharkfin Pattern was formed. When RSI entered the area above 30, I have taken a Buy trade on it. Takeprofit and Stoploss has been with 1:1 R:R (Risk:Reward) ratio.

In the above screenshot, I have taken Long Position on ETHUSD in 15 mints timeframe. RSI was below 30 when this Bullish Reversal Sharkfin Pattern was formed on the chart. After that when RSI entered the area above 30, I have taken a Buy trade on it. Takeprofit and Stoploss has been with 1:1 R:R (Risk:Reward) ratio.

In the above screenshot, I have taken Long Position on BTCUSD in 30 mints timeframe. RSI was below 30 when this Bullish Reversal Sharkfin Pattern was formed on the chart. After that when RSI entered the area above 30, I have taken a Buy trade on it. Takeprofit and Stoploss has been with 1:1 R:R (Risk:Reward) ratio.

This is the chart of BCHUSD in 15 mins timeframe. RSI has formed V shaped pattern as it went below 30 value and then came back quickly above 30. Now it is clearly above 30 and moving upwards. I have set my Takeprofit and Stoploss with 1:1(Risk:Reward) ratio.
Conclusion.
In this lecture, we have learned about a new strategy and it is about trading Sharkfin Pattern. We discussed entry criteria as well as exit criteria for both Buy and Sell Positions. In the end, I have shared some screenshots of live trades that have been taken using Sharkfin Pattern strategy. This strategy is looking good and if a trader enters the market after confirmation of entry criteria, then it can produce very good results and trader can benefit from this strategy.
Thanks in anticipation.
Please add "Trading Sharkfin Pattern" in title of homework post.
Done sir.