Crypto Academy / Season 3 / Week 6 - Homework Post for Professor @cryptokraze
Hi everyone and Assalam U Alaikum,
Q. 1. What is your understanding of the Liquidity Level. Give Examples.
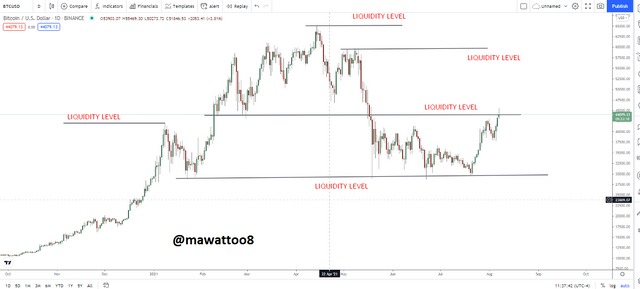
Liquidity levels in trading are the areas where many pending orders are placed. These orders can either be Buy & Sell orders, in order to enter the market, or Takeprofit & Stoploss orders, in order to exit the market. These levels are usually crowded and lot of orders are placed on these levels by the traders.
Liquidity is usually calculated by taking into consideration the volume of pending orders or trades at a certain level of an asset's price. When there is a significant amount of trading activity at a certain level, it shows high supply and demand of an asset and Liquidity is considered to be "High".
At High liquidity levels, due to sudden reaction of the traders, an aggressive movement can be seen in the market. Peaks of Highs and Lows are created on the chart at these levels and some small bodied candles with long wicks can also be seen. Price action candlestick pattern are created and sudden pullback can happen on such levels.
Q. 2. Explain the reasons why traders got trapped in Fakeouts. Provide at least 2 charts showing clear fakeout.
Liquidity levels are often placed above or below Support and Resistance Levels. When market breaks a Support or Resistance level, some traders think that this level has been broken and now market will continue its move. They enter the market by taking long or short position, depending on the trend of the market.
Liquidity levels are not known to small or retail traders and only smart money or whales are aware of these levels. Fake breakouts can happen at these levels and small traders can face loss. So these institutional traders or whales manipulate at these levels and they move the market in the opposite direction and Stoploss of the traders are hit. In this way, the Smart Money takes away the money from small traders.
Traders are trapped in such fakeouts because they think that a certain price level has been broken that has been working as Support or Resistance and the trend will continue. They take positions immediately and then market suddenly makes it move into opposite direction and stoploss of the traders are filled. In this way, traders got trapped in fakeouts.
To avoid being trapped in these fakeouts, trader must look any price action signal that confirms that trend will continue or market is taking a reversal. After the confirmation, a trader should take position in the market.
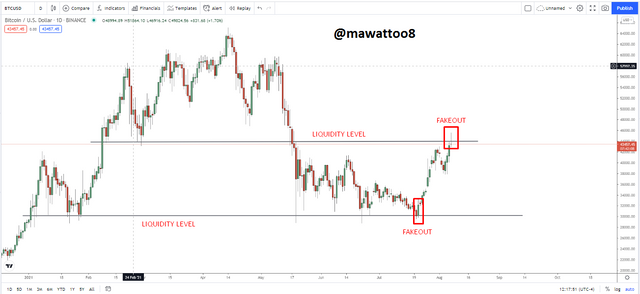
In this above chart of BTC/USD, you can two liquidity levels and on both levels, there are clear fakeouts. At 30,000 fakeout, you can see that market has gone through this level. A trader can expect that the market will continue its downtrend and can take short position. But the next candle was bullish and it has proven to be a fakeout. Hence the Stoploss will be hit and traders will face loss.
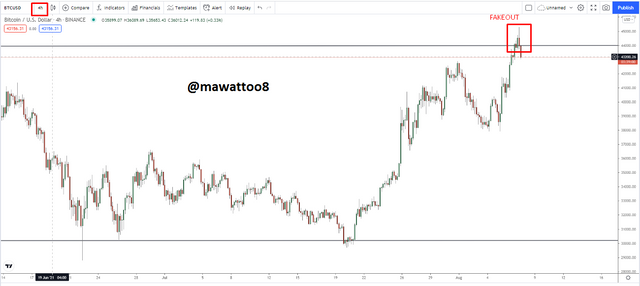
In this above chart of BTC/USD on 4h timeframe, 45000 level has also proven to be a fakeout. I have shown in the previous screenshot that it is a Liquidity level and here a candle crosses this level and then the next candle was bearing one and it has formed a fakeout at this level. Traders can go long on cross of this liquidity level and enter the market by placing Buy orders. But the next candle was bearish one and traders were trapped due to the fakeout and the Stoploss of the traders will be hit.
Q. 3.How you can trade the Liquidity Levels the right way? Write the trade criteria for Liquidity Levels Trading (Clear Charts Needed).
To trade these liquidity levels in the right way, a trader should wait for the trend confirmation. At these levels, look out for trend continuation or trend reversal confirmations.
In trend continuation confirmation, Break Retest Break (BRB) Strategy can be used. While trend reversal confirmation can be sought out using Market Structure Break (MSB) Strategy.
Break Retest Break - Trend Continuation
In this section, we will discuss about the method to look out confirmation for trend continuation using BRB strategy.
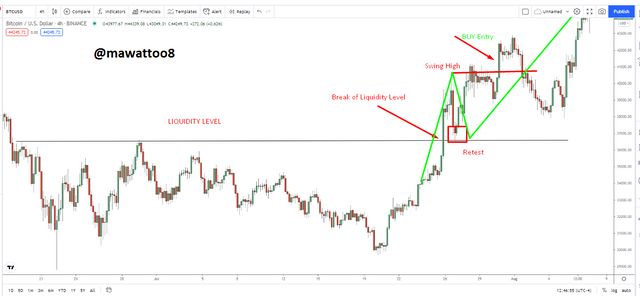
Confirmation Criteria in Bull Market.
The market should approach a liquidity level and break it upwards from below.
After breakout, a Swing high should be made by the market and correction starts afterwards.
Market should then approach the broken liquidity level and rebound from this level to upwards.
Then Market should break Swing high and here trader should enter the market by taking Long / Buy position.
Exit Criteria in this case shall be to set Stoploss below the Liquidity level broken and Takeprofit should be at ratio of 1:1. It means that Takeprofit should be equal to Stoploss.
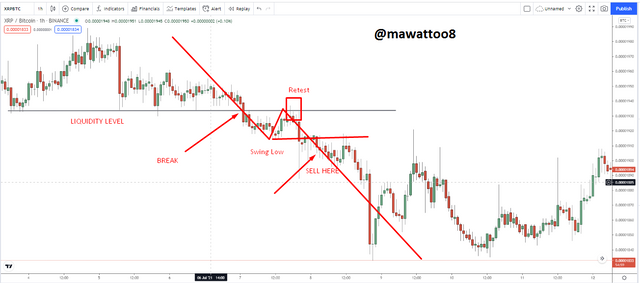
Confirmation Criteria in Bear Market.
Market should approach a liquidity level and break it downwards from above.
After breakout, there should be a Swing Low level and then market should go into correction phase.
Market should retest the liquidity level and rebound from this level and continue its move to downwards.
Market should break the Swing Low level and here the trader can place a sell order or take a Short Position in the market.
To exit from the market, trader should set Stoploss above the broken liquidity level and set Takeprofit with the ratio 1:1. It means Takeprofit should be equal to Stoploss.
Market Structure Break - Trend Reversal
With the help of Market Structure Break (MSB) Strategy, how a liquidity level can be traded and confirmation of reversal is confirmed.
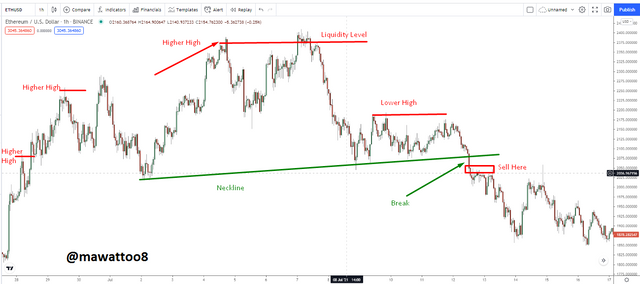
Confirmation Criteria of Reversal in Bull Market.
Market should be in a Bullish trend and market should approach the liquidity level.
Market should touch the liquidity level and rebound from this level or a fakeout should happen at this level.
A Lower High should be formed by the market price that indicates a trend reversal.
Trader should draw a neckline on the chart. Then there should be a breakout of Neckline drawn on chart from above to downwards.
Break of neckline is confirmation of trend reversal and trader should enter the market on this level.
Exit Criteria should be in this case by setting stoploss above the liquidity level and Takeprofit should be with the ratio of 1:1. It means Stoploss should be equal to Takeprofit.
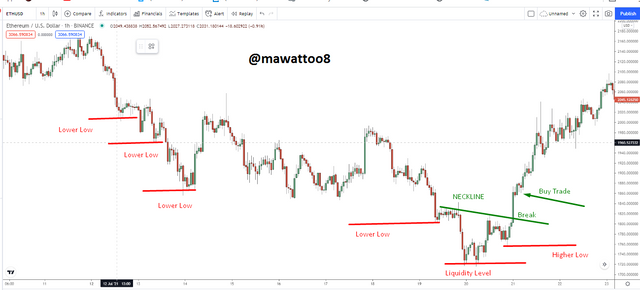
Confirmation Criteria of Reversal in Bear Market.
Market should be in a Bearish trend and market should approach the liquidity level.
Market should touch the liquidity level and rebound from this level or a fakeout should happen at this level.
A Higher Low should be formed by the market price that indicates a trend reversal.
Trader should draw a neckline on the chart. Then there should be a breakout of Neckline drawn on chart from below to upwards.
Break of neckline is confirmation of trend reversal and trader should enter the market on this level.
Exit Criteria should be in this case by setting stoploss below the liquidity level and Takeprofit should be with the ratio of 1:1. It means Stoploss should be equal to Takeprofit.
Q. 4. Draw Liquidity levels trade setups on 4 Crypto Assets (Clear Charts Needed).
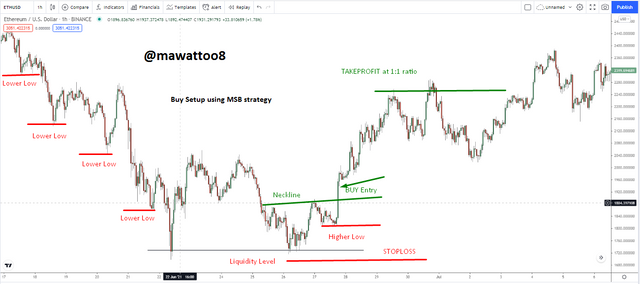
This is the first trade setup and I have found this Buy setup on ETHUSD with the help of Market Structure Break strategy. Takeprofit and Stoploss is set at 1:1 ratio.
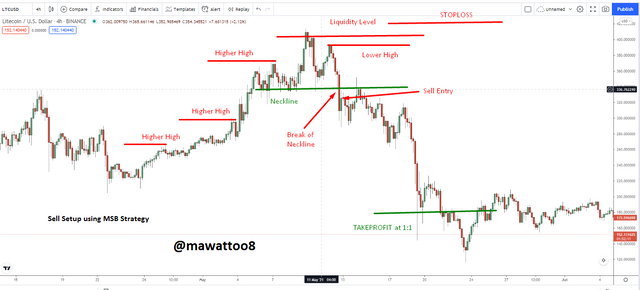
Above is a sell setup using Market Structure Break strategy and it was found on LTCUSD crypto pair. Takeprofit and Stoploss is set at 1:1 ratio.
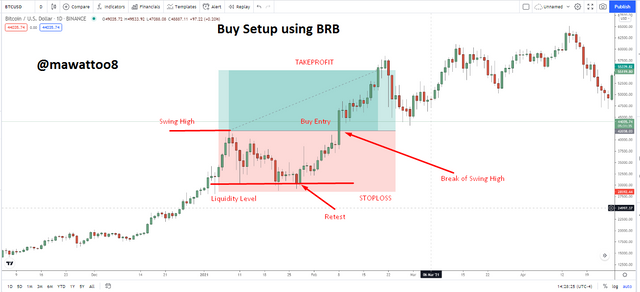
In this screenshot, you can see a Buy setup using Break Retest Break strategy found on BTCUSD. Takeprofit and Stoploss is set at 1:1 ratio.
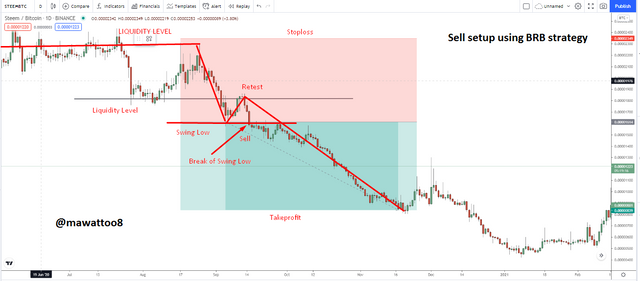
The above screenshot shows a sell setup using Break Retest Break strategy and it was found on STEEMBTC crypto pair. Takeprofit and Stoploss is set at 1:1 ratio.
Conclusion.
It is very difficult to trade liquidity levels but using these two strategies, Break Retest Break and Market Structure Break will help the trader to trade successfully at these levels. These liquidity levels are heavily crowded and smart money or Institutions manipulate prices at these levels to hit the Stoploss of retail traders and take their profit.
With the help of above discussed strategies, a trader should wait for confirmation signals and then enter the market and take position accordingly.
Thanks in anticipation.