Crypto Academy Season 3 week 5 || Homework post for Professor @kouba01 ||
Hi everyone and Assalam u Alaikum,
Q. 1. Discuss your understanding of Kumo, as well as its two lines. (Screenshot required)
Kumo is also known as cloud and it is the area between two lines which are Senkou Span A and Senkou Span B. These lines are also called SSA and SSB in short term. The area between SSA and SSB is always colored and it shows the trader trend of market.
Here I will explain a little about Senkou Span A and Senkou Span B and how these are calculated.
Senkou Span A.
As we have learned in the first part of this post that Senkou Span A is calculated by this formula (Tenkan + Kijun) / 2. It means it is the average of these two lines which are Tenkan Sen and Kijun Sen and it is projected 26 periods ahead in the future.
Senkou Span B.
SSB is calculated through this formula "(Highest + Lowest) / 2" and it is calculated over 52 previous periods and projected 26 periods ahead in the future.
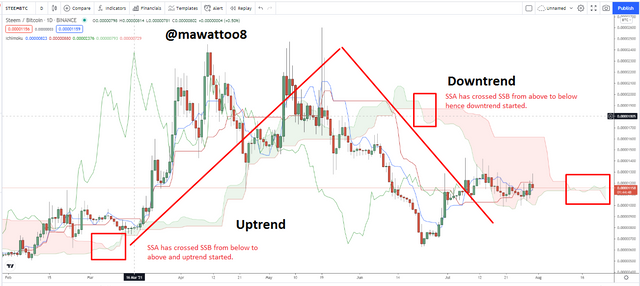
When Senkou Span A is above the Senkou Span B, it shows that there is bullish trend in the market. On the other hand, when SSB is above SSA, it shows that there is a Bearish trend in the market. When SSA and SSB are mostly flat lines, then it shows that there is a ranging market and there is no trend in the market. It is also called that market is moving sideways. Now I will show these conditions of the market with the help of screenshots.
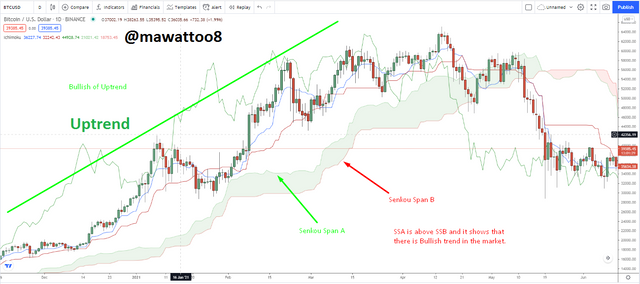
When there is uptrend in the market, SSA will be above SSB and it will move upwards as shown in the screenshot above.
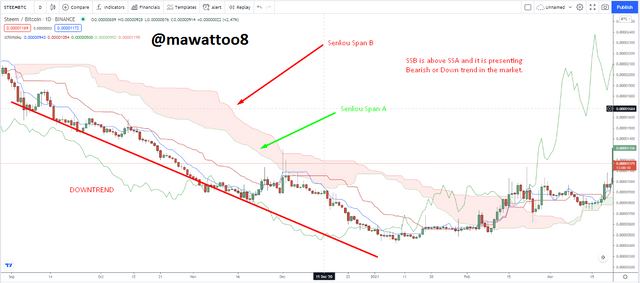
When the market is in Down trend, SSB will be above SSA and it will move downwards. I have shown it in the above screenshot.
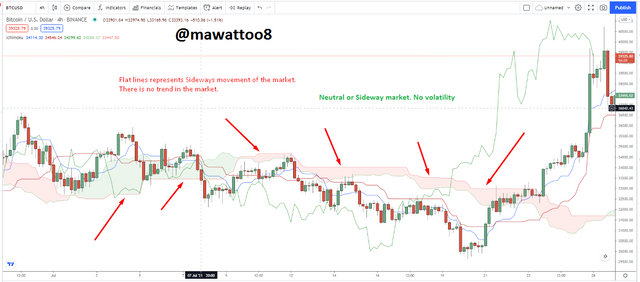
When there is no trend in the market, you will see flat lines of SSA or SSB and I have mentioned these flat lines in the above screenshot to better understand it.
Q. 2. What is the relationship between this cloud and the price movement? And how do you determine resistance and support levels using Kumo?
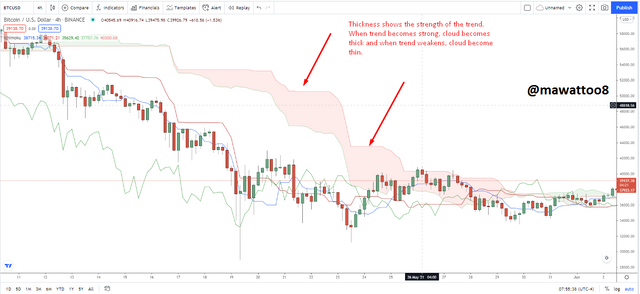
In this section of the post, we will discuss the relationship of cloud and price movement. In this indicator cloud tells about the trend of the market. At times, this cloud becomes thick and afterwards it can be seen that the Cloud has turned thin. Thickness and thinness of the cloud represent the strength and weakness of the trend in both uptrend and downtrend.
Thick Cloud.
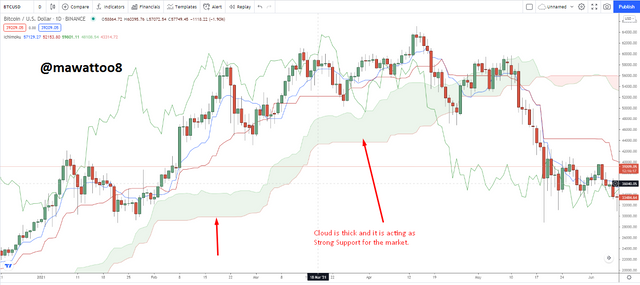
Whether the market is in uptrend or it is in downtrend, thickness of the cloud matters. When there is strong trend in the market, cloud will become thick and it will also work as Strong Support or Resistance level depending upon the market trend. I will try to explain it with the help of screenshots to better understand its relationship with the price movement.
Thin Cloud.
When a market shows some weakness in the trend and price moves against the trend of the market, then cloud becomes thin at that time. So, it can be said that in the time of correction or in case of reversal of the trend, the cloud will become thin and it represents weakness in the trend. The trend may be Bullish or Bearish and it will represent same weakness of the trend.
In case of reversal, cloud will become thin at first and then twist will occur in the market and a new trend may start in the market. Now I will try to explain it with the help of screenshots.
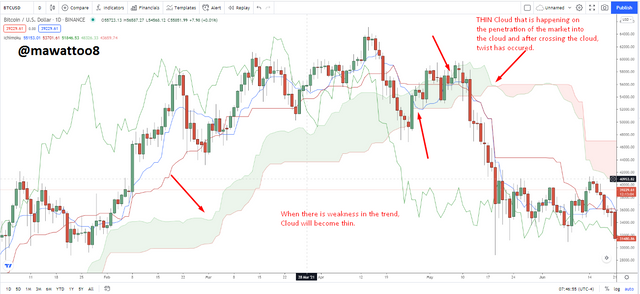
In this above chart, Whenever there is weakness in the trend and price has moves against the trend, or correction has happened, Cloud has become thin. This chart is showing uptrend and when there is downward price movement, cloud becomes thin. When there is reversal in the trend, cloud also becomes thin and there is a chance of twist.
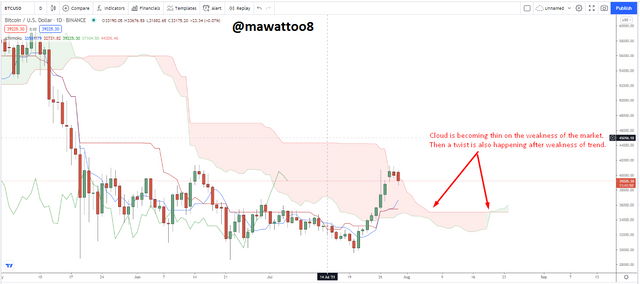
In this above screenshot, it can be seen that after a strong downtrend, sideways movement started and the cloud started to become thin and after a possible reversal of trend, a twist has happened that has been mentioned in the screenshot.
Acting as Support and Resistance.
There is another scenario where SSA and SSB act as Support and Resistance levels. When market price moves into the cloud then these lines also act as support and resistance.
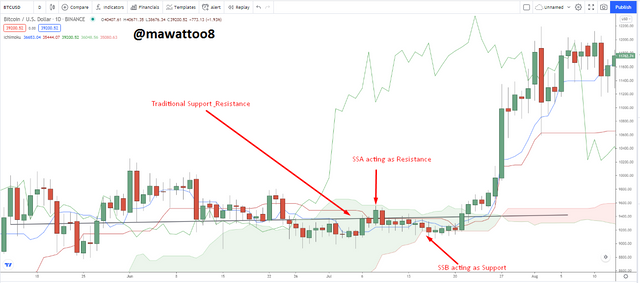
In this above screenshot, it can be seen that price has penetrated into the cloud. There is also a traditional Support and Resistance line. When this traditional was broken, a user could go short because support level has been broken and it is now a resistance line. But he is not aware that there is also support level that is being given by SSB of this indicator and the market has given respect to it and has gone up again. In this screenshot, SSA has also act as Resistance level that has been mentioned in the chart. So, when price enters the cloud, then SSA and SSB also work as Support and Resistance.
Q. 3. How and why is the twist formed? And once we've "seen" the twist, how do we use it in our trading?
As we all know that SSA is calculated over last 26 periods and SSB is calculated over last 52 periods, so it is my opinion that SSA moves fast and remains close to the candlesticks as we have seen that Short Moving Average remains closer to the candlesticks as compared to Long Moving Average.
When a market shows some weakness in the trend, the cloud starts to become thin which means that SSA and SSB gets closer to each other. At a point where both lines intersect each other, a twist is created and it is considered an indication of a possible trend reversal.
In uptrend, SSA will be above SSB and it will move upwards while SSB will be below and SSA will remain closer to the market price. On the other hand, in downtrend, SSA will be below SSB and it will move downwards. It means SSA will be closer to the market price as compared to SSB. In downtrend, both SSA and SSB will move downwards. Now we will discuss about Twist.
Twist is the point where SSA crosses over SSB whether to upwards or to downwards. When SSA will cross SSB from below to upwards, it will show an uptrend indication. It indicates the user that a Bullish rally is about to start. A user can take full advantage of a bullish rally from starting of that rally with the help of twist. On the other hand, when SSA crosses SSB from above to downwards, it indicates that a possible Bearish rally is about to start.
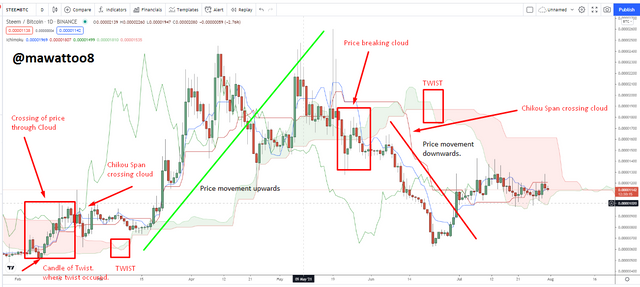
In the above screenshot, I have mentioned the twist and after the formation of Twist, how the market has responded. First SSA crosses SSB from below to upwards, and then a Bullish rally started. After a strong uptrend rally, then market showed some weakness and price crosses the cloud to downwards and a twist was formed there. Then a strong Bearish rally started. I have mentioned that twist in the screenshot.
Now there is another twist has been created currently and it is indicating that market is about to go upwards.
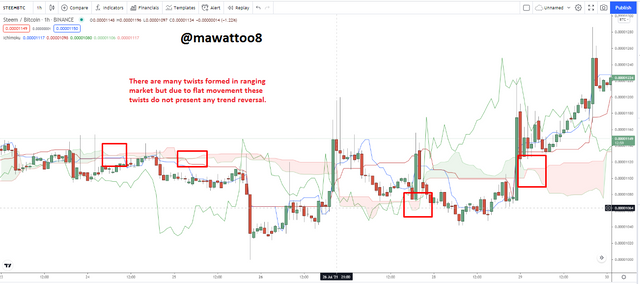
There is also another scenario where market goes sideways and twist can happen in such conditions. But due to flat movement of the lines, there is no trend in the market and it shows that there is no volatility in the market and price will remain in a ranging price.
Trading the Twist.
When a twist happens, usually the market price moves into the cloud and remains in the cloud for some time, on that SSA and SSB work as Support and Resistance and a user can buy at low prices and sell at higher prices.
When price crosses the cloud, then a new trend is considered to be confirmed and a user can go long or short as per the trend. Twist is considered a possible trend reversal and a user can go as per new trend and can enjoy the full rally and benefit from it.
As SSA and SSB are project 26 periods ahead, it indicates the possible reversal at very early stage. Thus enabling user to go according to the new possible trend and benefit from the whole rally. A user can buy at the lowest price and can go short at the highest price with the help of twist.
Q. 4. What is the Ichimoku trend confirmation strategy with the cloud (Kumo)? And what are the signals that detect a trend reversal?
As discussed above, now we can easily understand that when SSA is above SSB and it is moving upwards, cloud color is also green, and cloud is below the candlesticks on the chart, there is a Bullish trend in the market. Similarly, when SSA moves below SSB and it is movement is to downwards, cloud color is also red and candlesticks are being formed below this cloud, it shows that there is a Bearish trend in the market.
When SSA and SSB are mostly moving flat and crossing each other every now and then, it is said to be the Sideway movement of the market. There is no trend in the market and it is moving range bound. So, with the help of cloud (Kumo), a trader can easily know the trend of the market in very short time. In trending market, this cloud also works as Strong Support or Resistance thus helping the traders to enter the market during a trend.
Trend Reversal Signals.
Now we will discuss about the signals that are used to detect and confirm the trend reversal in the market.
Twist.
For trend reversal detection, a user should look for the Twist on the chart. Twist serves as an early indication of possible trend reversal. In this way, when a twist is found on the chart, a trader should get ready for a trend reversal. On the happening of twist, a trader can also exit the market as it can be a trend reversal.
Break of Cloud.
After the twist has happened, then the price should also cross the cloud against the tend. In trending market, candlesticks are formed away from the cloud and to confirm the trend reversal, price should cross the cloud to the opposite side of the trend. So when price breaks the cloud, it also indicates a trend reversal.
Chikou Span line.
Chikou span line should also break through the cloud to confirm the trend reversal. Chikou span should cross the cloud in the direction of the new trend that is about to be a reversal of trend.
Direction of the Cloud.
Cloud should also move in the direction of the new trend to confirm the trend reversal. A trader should also take into consideration the direction of the cloud that is an essential element for confirmation of trend reversal.
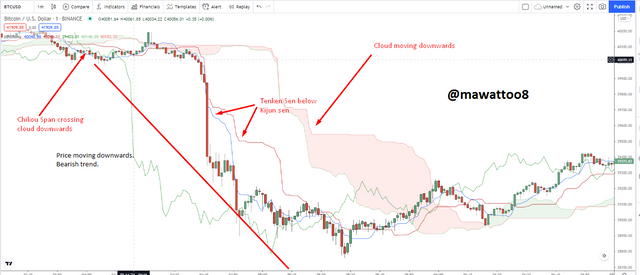
In the above screenshot, I have pointed out required signals for the detection and confirmation of trend reversal. In this screenshot, Both Bullish and Bearish Trend reversal signals have been mentioned. Keeping in view all these signals, a user can easily detect a trend reversal.
Q. 5. Explain the trading strategy using the cloud and the chikou span together.
This combination of Chikou span and cloud is very interesting and it provides high level of success to the trader. When both are heading towards the same direction, a user can go with that direction.
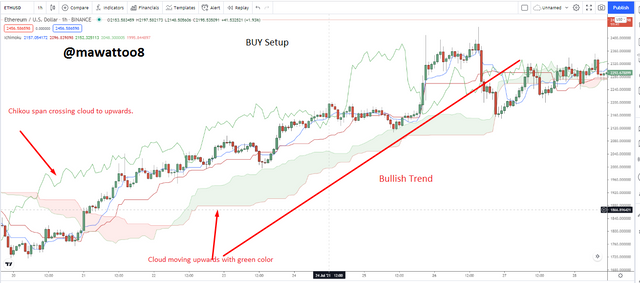
When the Chikou span line crosses the cloud from below to upwards, and cloud is also going upwards with SSA above the SSB line with green color cloud, it shows that there is a strong bullish trend in the market. Market price should also move upwards thus enabling trader to go Long or enter a buy trade.
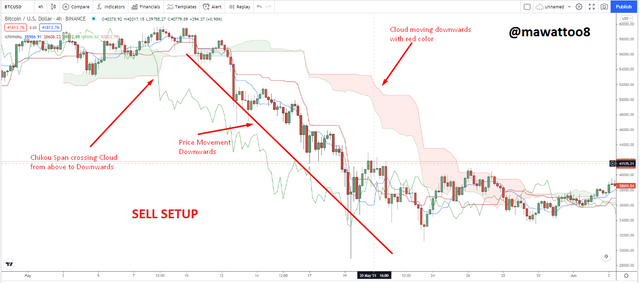
On the other hand, when Chikou span line crosses the cloud from above to downwards and cloud is also moving downwards with red color in it while SSA is below SSB, then there is a Bearish trend in the market. Market Price movement should also be to the downward and a user can go short or enter Sell order, if possible, with the help of trading strategy using Chikou span and Cloud together.
So, with the help of these screenshots, one can understand how a trading strategy can be made using Chikou span and Cloud together.
Q. 6. Explain the use of the Ichimoku indicator for the scalping trading strategy.
Scalp trading term is used for a trading style in which a trader enters the market for few seconds or a minute and exit the market. Time frames that are used in scalp trading are very short. For example 1 min, 2 min, 5 min. On tradingview, a trader can also use time frame in seconds. So in scalping trading strategy, a user enters the market and then exit the trade in seconds or few minutes.
So when using Ichimoku indicator in scalping, the rules remains the same as in long term trading because without confirmation of the trend, a trader cannot enter the market. So here are the points that have to be followed by the trader in scalping trading strategy.
In Bullish or Uptrending Market.
Chikou span should cross the cross the cloud from below to upwards and moving upwards.
SSA should be above SSB and price movement should also be in upward direction.
Tenken sen line should also above the Kijun sen showing upward trend.
Formation of candlesticks should be above cloud.
Time frame must be small in order to do scalping.
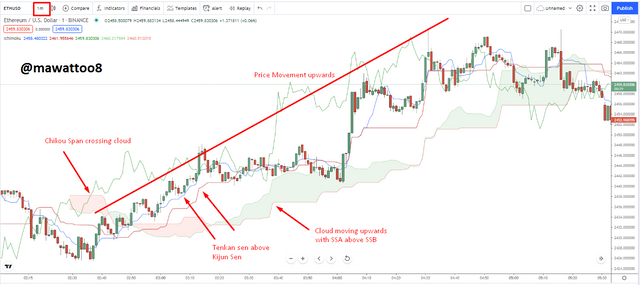
In this chart, all parameters of a buy trade are complete so a trader can go long or enter buy trade on smaller time frame. In this way, Ichimoku can be used for scalping trading style.
In Bearish or Downtrending Market.
Chikou span should cross the cloud from above to downwards.
SSA should be below SSB for valid sell setup.
There should be Bearish trend in the market. So, candlesticks on the chart must be formed below the cloud.
Tenken sen line should be below the Kijun sen showing downtrend.
Time frame must be small in order to do scalping.
In the above chart, I have mentioned all the parameters that are considered essential for a Sell trade. So, a trader can use Ichimoku indicator for scapling trading and benefit from it.
Conclusion.
We have discussed about kumo cloud which is very important element of Ichimoku kinko hyo indicator. We also discussed about trading strategy using Chikou span and cloud together. Scapling trading strategy has also been discussed and how a trader can benefit from this indicator in scalping. In the end, it can be said that this indicator is very strong and it provides signals about current trend, trend reversal, sideways or ranging market. A trader can benefit from this indicator at large and as we discussed in the post that trader can detect a trend reversal very early with the help of this indicator.
Thanks in anticipation.
Hello @mawattoo8,
Thank you for participating in the 5th Week Crypto Course in its third season and for your efforts to complete the suggested tasks, you deserve an 8/10 rating, according to the following scale:
My review :
Good content, through which you were able to cover all aspects of the topic clearly, based on a set of accurate information. However, I have some notes:
Your interpretation of the cloud and its lines was brief and lacked some depth in the analysis.
As for determining the levels of support and resistance based on the Ichimoku cloud, it differs from the traditional method, and this is what you are asked to interpret.
Your explanation of the rest of the questions was excellent and you delved well into analyzing what was required.
Thanks again for your effort, and we look forward to reading your next work.
Sincerely,@kouba01