Crypto Academy Season 3: Week 2 || Homework post for @cryptokraze||
Hi everyone and Assalam U Alaikum,
Welcome to my homework post for newly appointed Professor @cryptokraze who is from my country, Pakistan, and a wonderful lecture has been delivered by him about Market Structure Breakout Strategy. I will try my level best to answer the questions asked for homework post.
Q. 1. What do you understand about Market Structure?
Everything in the universe has a structure which is followed by that particular thing and if we talk about trading world, this market also moves in a pattern. This movement of the market in a pattern is called the structure of the market. Whether market is in uptrend or it is in downtrend, it follows a structure and it makes its moves according to its structure.
Market has three phases which are Uptrend, Downtrend and Sideway. When market is uptrend or downtrend, it moves by making swings. In sideway, there is not much fluctuation in the market and it remains flat most of the times. Market makes its Support and Resistance Levels and moves respecting these levels. When a Support or Resistance level is broken, then it makes new levels and in this way highs and lows are created in the chart.
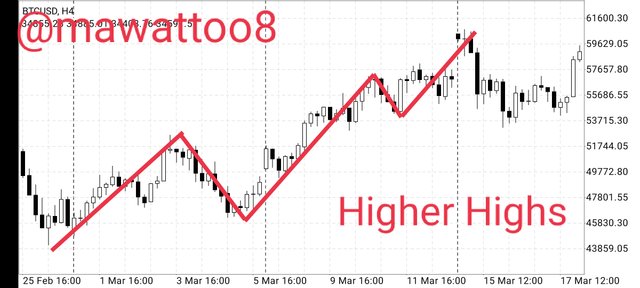
In the uptrending market, higher highs and higher lows are created by the market movement. As we all know, an uptrend is followed by downtrend, and a market cannot remain in one trend for good, so there is always a reversal and whenever a lower high is created in the chart pattern in an Uptrending market, it can be an indication for the reversal of the trend.
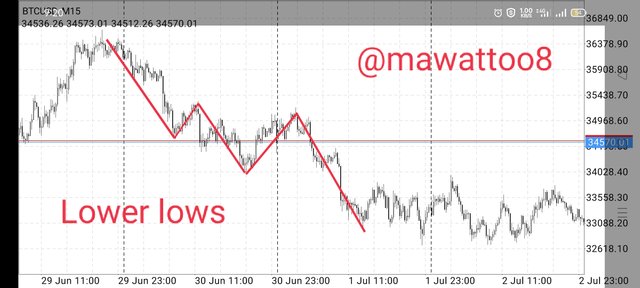
Similarly, when the market is in downtrend, it creates lower lows and higher lows and it moves downwards in this pattern. When Higher low is created in the downtrending market, it is an indication of trend reversal and an uptrend can start after that.
Q. 2. What do you understand about Lower High and Higher Low? Give Chart Examples from Crypto Assets.
As we have discussed above in first question that market moves in zig zag pattern. In an Uptrending market, it moves by making higher highs and higher lows and moves upwards.
On the other hand, in downtrend, market moves by making lower lows and higher lows and thus moves downwards in this way.
Lower High.
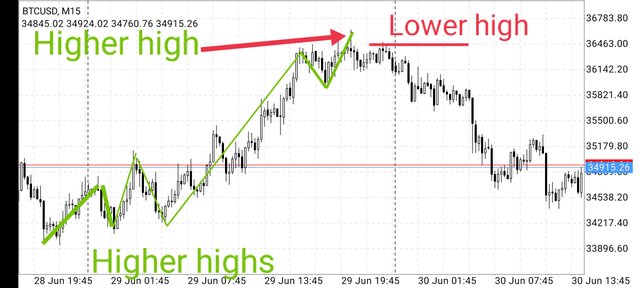
Lower high is an indication of trend reversal and it is created at end of an uptrend market. In uptrend when the market is unable to create new higher high and returns downwards by making a Lower high. This lower high is a price that is lower than the previous high. It gives a signal to the traders that the market is ready to go in opposite direction of the uptrend and it is a start of downtrend.
There are also 3 conditions to be fulfilled to confirm the trend reversal and these are listed below.
1 - Lower high should be formed at top of an uptrend.
2 - Neckline of Market Structure should also be marked on the chart pattern.
3 - Then trader should wait for the clear breakout of Neckline.
If these conditions are not met, then reversal of trend is not confirmed. In this way Market Structure Breakout Strategy can help traders to early identify the trend reversal.
Higher Low.
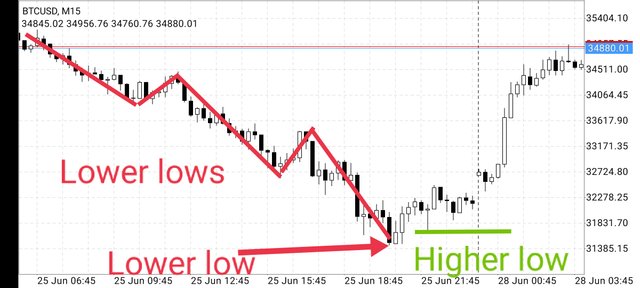
This is also an indication of trend reversal and this price action is formed at the bottom of the downtrend. When market is in downtrend, it forms Lower Lows and moves downwards. But at the bottom of the downtrend, market is unable to form another Lower Low and a Higher low is formed and the trend reversal is started.
There are also 3 conditions to be met to confirm a Higher low and trend reversal. These conditions are listed below.
1 - Higher Low should be formed at the bottom of downtrend.
2 - Neckline of Market Structure should also be marked on the chart pattern for confirmation of trend reversal
3 - Then trader should wait for the clear breakout of this Neckline that has been marked on the chart pattern.
On the fulfillment of these above mentioned conditions, a trend reversal is confirmed and it is an end to the downtrend. Uptrend starts from this point and it can help traders to take advantage by identifying the trend reversal at an early stage.
Q. 3. How will you identify Trend Reversal early using Market Structure Break? (Screenshots Needed)
Market Structure Break is a tool that is used to identify the trend reversal at an early stage. It is quite similar in both uptrend or downtrend to identify the trend reversal this MSB and I will explain it through screenshot.
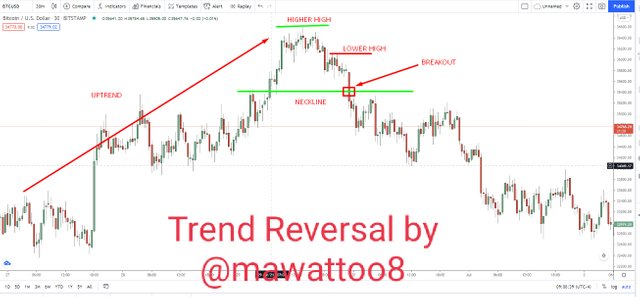
Trend Reversal at the end of Uptrend.
During the Uptrending market where a series of higher highs is formed and at the top of the market, a Lower High is formed, this is an indication of trend reversal and downtrend is expected to start after this.
To identify the trend reversal, following conditions are required to be met.
1 - Lower high should be formed at top of uptrend.
2 - Neckline of Market Structure should also be marked.
3 - Then trader should wait for the clear breakout of Neckline and then go for the trade.
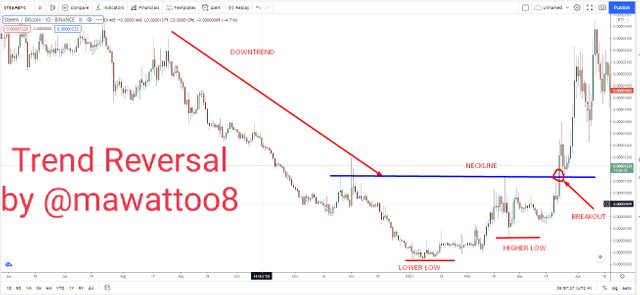
Trend Reversal at the end of Downtrend.
To identify the trend reversal early during a downtrend, MSB strategy can be very helpful to the traders. At the bottom of the downtrending market where a series of Lower lows has been formed, a Higher low is formed and it is deemed as an indication for trend reversal. It jas also some conditions that are to be fulfilled for a valid trend reversal and these are as follows.
1 - Higher Low must be at the bottom of downtrend.
2 - Neckline of Market Structure should also be drawn on the chart pattern.
3 - There should also be a clear breakout of this Neckline that has been marked on the chart pattern.
Q. 4. Explain Trade Entry and Exit Criteria on any Crypto Asset using any time frame of your choice (Screenshots Needed)
Now in this part of the homework post, we will discuss about the method how to enter the market by buying or selling the crypto asset. After that when to exit rhe market in profit or loss.
The main thing is to find out the early trend reversal with the help of MSB strategy and then take advantage of it. Whenever an opportunity is there and trader has find out trend reversal early, then look out for clear breakout of the neckline. After the break of neckline, this should also be confirmed by watching next 2 or 3 candles close and then enter the market. Sometimes fake breakouts also happen in the market, that's why trader should wait for confirmation of the breakout and enter the market.
After the successful entrance in the market by buying or selling any crypto asset, next is the exit point. This is also very important point and it should also be considered equally as entrance in the market. The exit of a trade can be in two forms. It can be in profit or it can be in loss.
When a trade goes against the expectations of the trader and trade is in loss, trader should be ready to exit the market with small loss and here comes the Stoploss which is very important to save the trader from huge loss. Stoploss should be set around Lower High or Higher Low and it will be shown with the help screenshot.
On the other hand, if the trade is moving according to the expectations of the trader, and it is in profit, there should also a Takeprofit point that can be 1:1 with stoploss or 2:1 with stoploss. This 1:1 ratio means Takeprofit should be equal to Stoploss. And in 2:1 ratio, Takeprofit is double than Stoploss. This ratio is decided by the traders and I personally think 2:1 fit for trading myself.
Now I will explain entry and exit points with the help of screenshot below.
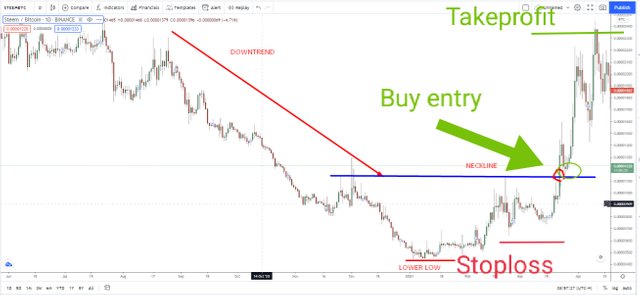
In the above screenshot, I have pointed out the buy level where trader should enter the market by buying and Stoploss is set below the Higher Low and Takeprofit has been set almost with the ratio 2:1. This is how a trade should be executed with the help of Market Structure Breakout Strategy.
Same is the case with the sell entry and Stoploss should be above Lower High and Takeprofit should set with the ratio as per the traders strategy.
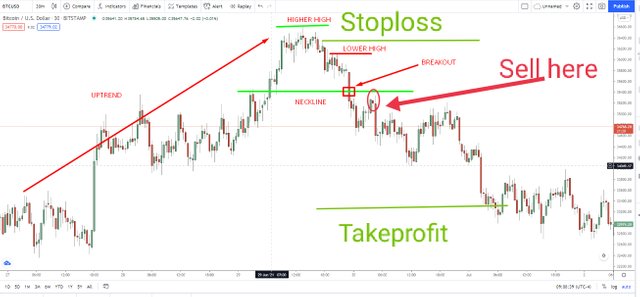
In the above screenshot, I have mentioned the sell entry and set the Stoploss above Lower High while Takeprofit has been set approximately at 2:1 ratio.
Q. 5. Place 2 demo trades on crypto assets using Market Structure Break Strategy. You can use lower timeframe for these demo trades (Screenshots Needed)
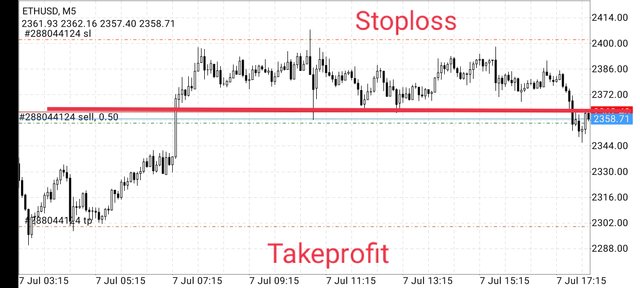
In this section, I will show 2 demo trades taken on the basis of Market Structure Break Strategy. Below is the sell trade taken by me. In this trade, Lower High has been formed and the neckline has also been broken. So after 3 , 4 candles, I have taken this entry and set the Stoploss above Lower High and Takeprofit at 1:1 ratio approximately.
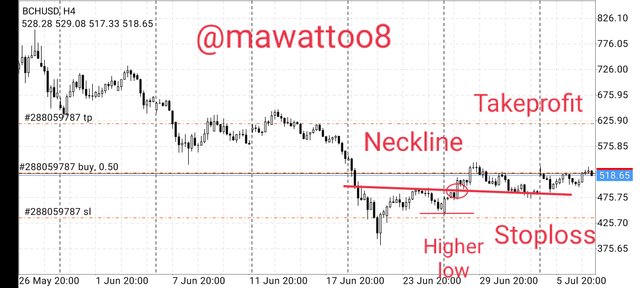
Below is the 2nd demo trade that has been a Buy trade. I have pointed out the Breakout of Neckline and set the Stoploss below Higher Low and Takeprofit has been set at 1:1 ratio. I hope these are according to the strategy and will give good results.
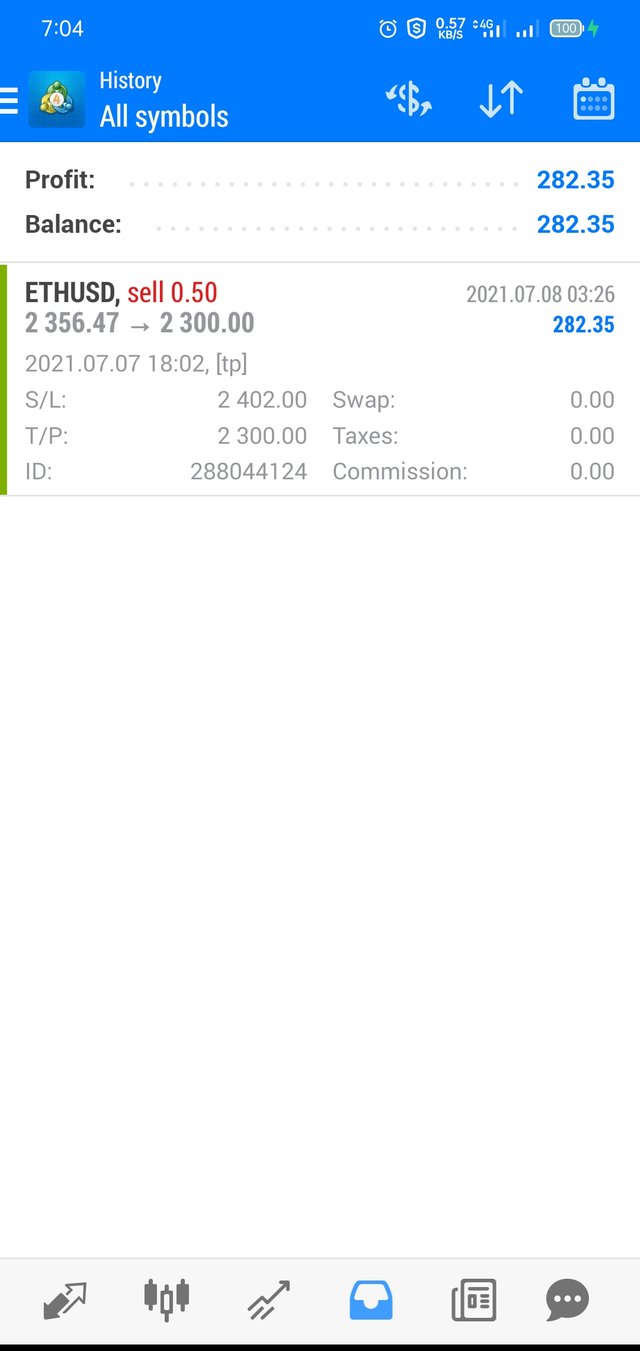
One of my trades has hit Takeprofit and I am uploading screenshot of the closed trade here.
Conclusion.
Price action strategies are very popular due to their good performance and too many traders have adopted Price Action strategies for analysis purposes. Market Structure Break Strategy is one of them and I have learned about it from this lecture and it is a wonderful strategy for me to follow for trading purposes.
If a trader is able to find out trend reversal at early stage, he can take full advantage of it with very small amount of risk and it can be obtained by following this MSB strategy. Moreover, this strategy works on all time frames and all traders can adopt this strategy according to their trading styles.
Thanks in anticipation.
Regards,
Muhammad Ahmad Wattoo
@mawattoo8
Good