Crypto Academy Season 3: Week 1 || Homework post for @kouba01||
Hi everyone and welcome to my homework post of week 1 season 3 for Respected Professor @kouba01. I have learned about a new indicator Ichimoku-kinko-hyo and it is a quite amazing lecture about this new indicator.
Q 1. What is the Ichimoku Kinko Hyo indicator? What are the different lines that make it up? (screenshots required)
This indicator is an invention of a Japanese Journalist Hosoda Goichi and it was firstly used only in Japan and Asia and after twenty years, it was also introduced in Europe and traders started using this indicator. It s name is in Japanese language and it means The Balance chart from one look.
This indicator is about a concept of Balance and the inventor of this indicator was of the belief that everything in this universe has a balance and it tends to move around its balance. At one time, it can move away from its balance but it will return to its balance after some time. This indicator has also been based on this concept of balance and it is believed that the market can go upwards or downwards very sharply, but it will return to its balance after some time.
I have also another understanding about the name of this indicator and I want to share with all of you, although it can be different or in other words may be wrong. I believe that this also expresses an understanding of the chart from one look. As we have discussed and learned about other indicators in the past and there is always been space for other indicators alongwith a major indicator to better understand the market situation and more than one indicators were advised to be applied on the chart. But this chart gives a very good view about the market without any other indicator being applied to the chart and this alone chart can help trader to better analyze the market. That’s why, its name is The Balance chart from one look.
Components of the Indicator.
There are five components of this indicator and each component has its own formula having different properties. These five components or lines can be divided into three groups and these are discussed in detail below.
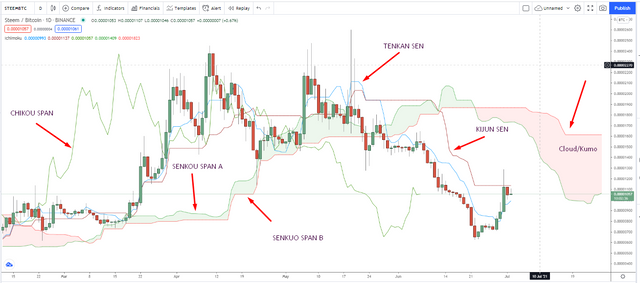
The Tenkan- Sen Line and Kijun- Sen Line.
The Tenkan-Sen line is calculated over 9 periods. It can be termed as a mid point that is calculated by adding high and low of the period and then divided by 2. This division is different from moving average calculation. Based on this calculation, Tenkan-Sen line is calculated.
While on the the other hand, Kijun-Sen line is calculated over 26 periods. This line is created by adding high and low of certain period that is 26 and then divided by 2. In other words, one can say that the Kijun-Sen line is more accurate line as it is calculated by taking into consideration more period than Tenkan-Sen line period.
The Senkou Span A and Senkou Span B.
These two lines are also very important part of this indicator and these lines are projected in the future. These two lines, when combined and applied on chart, form a shaded area which is called Ichimoku Cloud (Kumo). These lines area is considered to be Support and Resistance. When this cloud is above the market, it works as Resistance level and when it is below the candlesticks on the chart, it acts as Support level.
Senkou Span A is calculated by using Tenkan and Kijun lines. Average of these lines is calculated by dividing Tenkan and Kijun by 2 and it is projected 26 perieods ahead.
Senkou Span B is calculated by using values of highest and lowest of last 52 periods like Tenkan and Kijun is calculated and it is also projected 26 periods ahead. The formula for Senkou Span B is (Highest + lowest) / 2.
The Chikou Span.
This is often ignored by the traders as it is obtained by the closing price of 26 periods back from the current price and it shows the past behavior. From this the trend can be determined. Normally if the Chikou Span is above the current price back 26 periods, it is considered to be bullish and if it is below the market back 26 periods, then the trend is considered to be bearish.
Q. 2. How to add the Ichimoku indicator to the chart? What are its default settings? And should it be changed or not? (screenshots required)
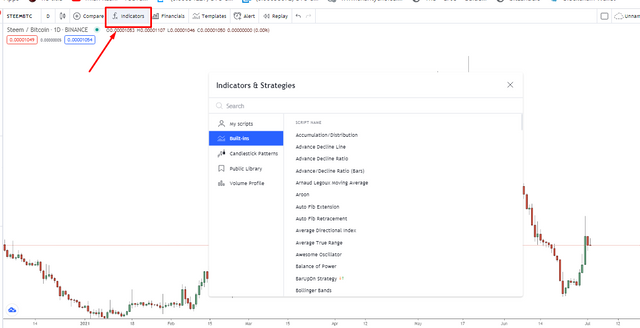
To apply Ichimoku Indicator on https://www.tradingview.com/, go to the website and open any cryptocurrency chart. I have chosen Steem/Btc for this purpose. Then Click on the sign I have mentioned in the below picture and a list of indicators will appear on the screen.
Now type the name of the indicator in the search bar. I have written Ichimoku and it has given results. Then click on the first result.
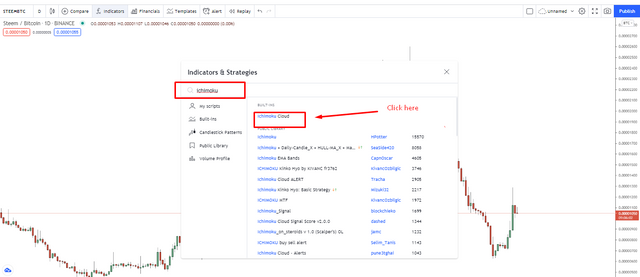
By clicking on the mentioned name, Ichimoku Indicator will be applied to the chart.
Now we will discuss about the settings of this indicator. Right click on any line of the indicator and then click on Settings as mentioned in the picture below.
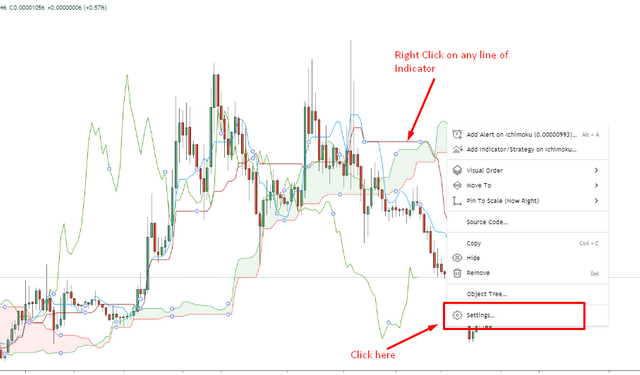
Now the settings option will appear on the screen. There are two options available for settings. One is Input and other is Style. Firstly I have chosen Input and its options as given below.
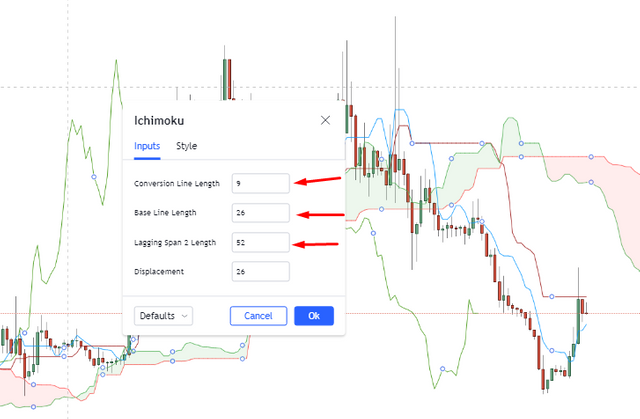
In the above picture, these are the default values of this indicator and these can be changed by the user according to the trading style of the trader.
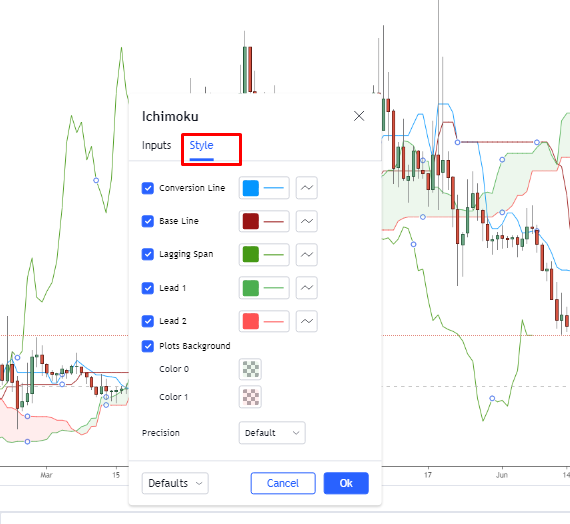
This setting is about the style of the lines. Line colors and other parameters can be changed on this setting option.
Q. 3. How to use the Tenkan Sen line? How to use the Kijun Sen line? And How to use them simultaneously?(screenshots required)
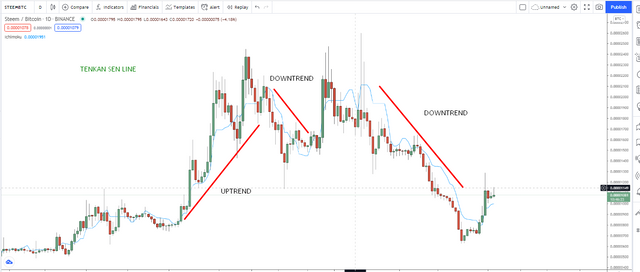
Tenkan sen line is obtained by adding the high price and low price of 9 periods and then divide the sum by 2. It means it is a median not average of the price as it is divided by 2 and not by 9. If it has been divided by 9, it would have been average. So it is a median line that acts as support and resistance on the chart. When the market is above this Tenkan sen line and tenkan sen line also moving upwards, it means there is a buying trend in the market. On the other hand, when market is below tenkan sen line and it is also moving downwards, it means market is in the bearish trend. When tenkan sen line is flat, it shows there is no trend in the market and not much fluctuation can be expected in the market.
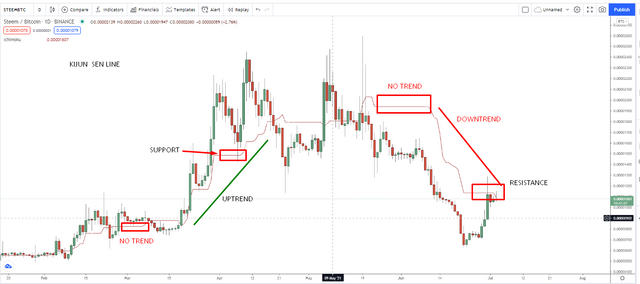
Kijun sen line is calculated in the same way as Tenkan sen line, but period is different and it is calculated on 26 periods. Highest price and lowest price of 26 periods is added and then it is divided by 2 and Kijun Sen line is obtained in this way. This line is considered to be more meaningful as it works on larger period as compared to Tenkan sen line. It also works in the same way and when it is moving upward and market is also above this line, it shows a bullish trend in the market and when market is below this line and line is heading downwards, it signals a bearish market. Flat line represents no trend and market has not much fluctuations in it.
Simultaneous use of these two lines is very interesting and helpful for the traders. Both lines also act as support or resistance levels. Whenever market is on correction phase and it touches these lines, there is always a chance for the market to rebound and go with the trend. In uptrend, these lines will work as Support level and in downtrend, these lines will work as Resistance level. Wait for any price action signal near these lines and then go with the trend.
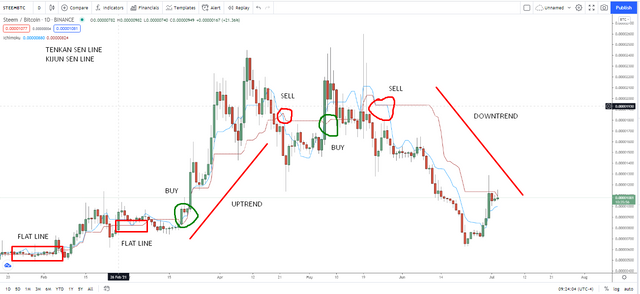
Another aspect of working with these lines is when Tenkan sen line crosses Kijun sen line, there is an opportunity for trading. When the shorter period line (Tenkan Sen) crosses longer period line(Kijun Sen) upwards, it means there is a buying opportunity. On the contrary, when Tenkan sen crosses Kijun sen downwards, trader can gor for sell opportunity. This is how these lines can help traders in finding opportunities in the market.
Q. 4. What is the chikou span line? And how to use it? And Why is it often neglected? (screenshots required)
Chikou Span line is very important component of this indicator as it is necessary for decision making to enter or exit the market. It is obtained from 26 periods and it is retracted 26 periods back. This line is placed 26 periods back and the closing price of the 26th candle back is compared with the closing price of the current candle and the future trend is decided on this available data. If the current closing price is higher than 26th candle closing price, then it is assumed that the market will move upwards and if the current closing price is lower than the closing price of 26th candle back, then a bearing trend is assumed. So it helps in this way to determine and decide the future trend of the market.
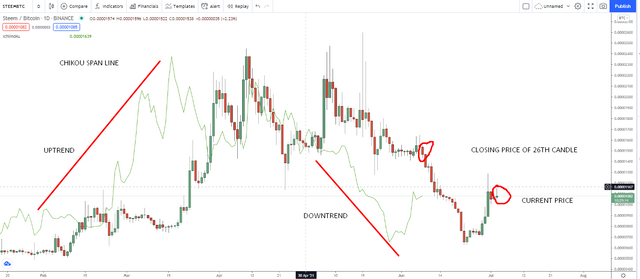
This Chikou Span line is often neglected by the traders as they deem this line unnecessary due to the fact that it is about the past of the market and they think that it cannot help anymore in the future. But it is very important for decision making for the future trend of the market and it can help the traders to make decisions for entering or exiting the market.
Q. 5. What's the best time frame to use Ichimoku? And what is the best indicator to use with it? (screenshots required)
Use of any time frame with Indicators is dependent upon the trading style of the trader. If the trader is a short term trader, then he will surely use 15 mins, 30 mins or hourly time frame for its analyzing and trading needs.
On the other hand, long term traders will use 4 hours, daily or weekly time frame for trading purpose. Indicators are used to help the traders better analyze the market and benefit from the opportunities being offered by the market. So, Ichimoku Indicator can also be used with any time frame and in my view, larger time frames give more accurate data than shorter time frames. I am a long term trader and I will surely use bigger time frames.
This indicator is supposed to help traders in analyzing market alone and it can solely give good results. But after all it is an indicator and no indicator can give 100% accurate results, so some other indicator can also be used with Ichimoku Indicator and I think RSI is the best indicator to be used alongwith this indicator.
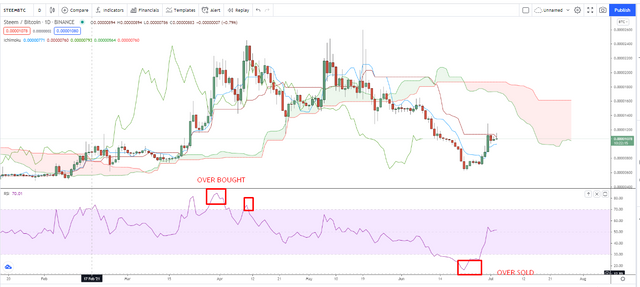
RSI gives idea about oversold or overbought condition of the market and it can be used alongwith Ichimoku Indicator. So whenever RSI indicates oversold or overbought signal, trader can take help from both indicators and act accordingly. In this screenshot, I have mentioned overbought and Oversold signals of RSI and you can see that it has given an early signal to the traders. So in this way, it can help traders alongwith Ichimoku Indicator.
Conclusion.
Ichimoku Indicator has many components and all of them have different properties and these give signals differently. When all of these give a combined signal, it is always a strong signal to buy or sell.
Due to its versatility, it is more accurate than other indicators and it can help the traders in a better way. So far, what we have learned from this lecture, it can be said that it is an interesting indicator and it can produce good results.
Ichimoku can minimize the risk factor by giving effective signals and alongwith other indicators, it can produce more accurate signals and it is recommended to use this indicator while analyzing the market.
Regards,
hi dear!
how much pnut you send for 26$ upvote? I wanna to know..!
2900
so, it is loss for you! ????
Please let me know, how?
Hello @mawattoo8,
Thank you for participating in the 1st Week Crypto Course in its third season and for your efforts to complete the suggested tasks, you deserve a 9/10 rating, according to the following scale:
My review :
An article with excellent content in which you addressed the subject in all its aspects by answering the questions accurately and through a clear methodology.
Thanks again for your effort, and we look forward to reading your next work.
Sincerely,@kouba01
Thanks sir for appreciation. I will try my best to better answer the asked questions in future.