Crypto Academy Season 2: Week 4 || Homework post for @kouba01||
Hi everyone and welcome to my homework post for Professor @kouba01. This is an outstanding lecturer on RSI and I have learned many new things about this Indicator.
Question 1.
Relative Strength Index (RSI) is a Technical Indicator just like many other indicators available in the market. The main purpose of any indicator is to help traders to find good entry points and exit points. RSI is an indicator that has been developed by Willis Wilder to help traders to find entry and exit points while trading an asset.
RSI helps in finding whether an asset is Oversold and Overbought and thus helping traders to find good entry points and exit points. Its values range from 0 to 100 with median of 50. There are also two other values which are 30 and 70. All these values indicate some kind of momentum. If RSI line is below 50, it shows Bearish trend and if it is above 50, then it shows Bullish trend.
Values of 30 and 70 correspond to Oversold and Overbought respectively. When RSI is below 30, it shows that the asset is oversold and it can move higher to the upwards.
When RSI moves above 70 value, it shows that the asset value is overbought and a correction is imminent. In this way, it can help traders to exit the market at right time and at a very good value.
How RSI is calculated?
RSI is calculated using this below formula.
Average is taken from the gains and losses during the period. Default period is 14 in RSI and gains and losses are taken from this period. For example, an asset gained profit for 7 days, so profit will be calculated from these days and an average will be taken from it. On the other hand, this asset didn't performed well for rest of the seven days and it closed in loss for these days. Then average of these will be taken and all these values will be put in the above given formula. In this way, RSI value is calculated and it is put in the graph. If it is above 50, the asset is in uptrend and if value is under 50 then it is assumed that the asset is in downtrend.
Can RSI be trusted in Crypto Trading?
As we have learned from many lectures in this academy that there is no Indicator that can perform 100% accurately. So, RSI is also an indicator and it cannot be 100% accurate but it can be used with some other indicator to get better results. These Indicators are tools to help understand the market trend and find better entry and exit points. No Indicator can be used solely and it must be used with combination to another indicator like MACD. It can help in setting Take profit and Stoploss. RSI is a very commonly used Indicator and it is trusted indicator. So, we can trust RSI while trading crypto assets.
How do you configure the RSI indicator on the chart and what does the length parameter mean? Why is it equal to 14 by default? Can we change it? (Screen capture required)
First of all, I will apply RSI indicator on the chart. I will have to open https://www.tradingview.com/ and open the chart. I have opened SteemBtc chart and applied RSI indicator on it.
Click on Fx Indicators as mentioned in the screenshot below. The next interface will open that is given next.
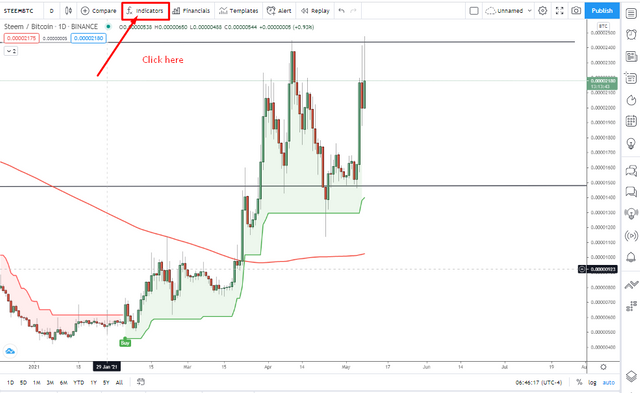
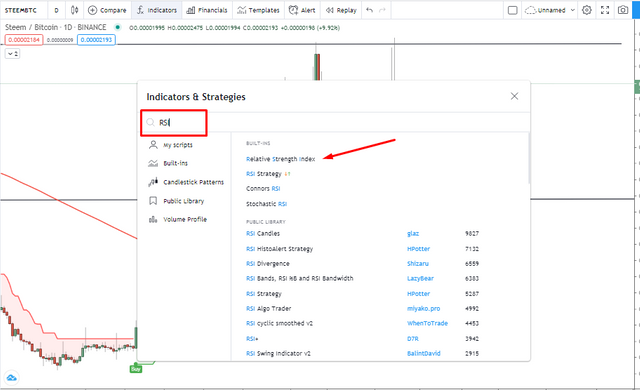
When I clicked on Fx Indicators, the next interface opened as below. Then I searched RSI by typing in the mentioned place and then click on Relevant Strength Index. By Clicking in Relevant Strength Index, It has been applied on the chart.
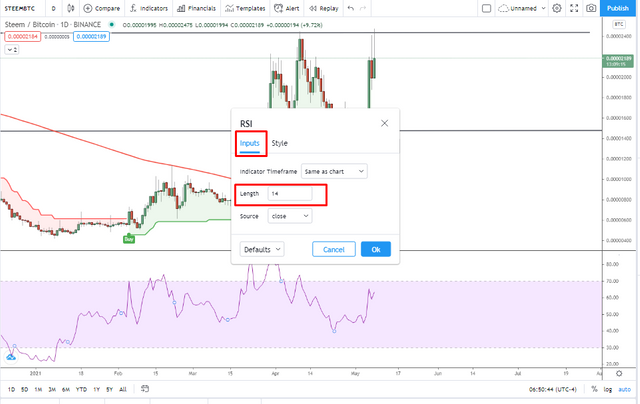
Then I opened setting of RSI by Double Clicking on RSI indicator and tried to make changes. In Input tab, there is length and Source. Length value is 14 by default tha means it counts 14 last candles.
Now, to change color of Lines and add any line, I clicked on Styles and then changed the color and style of the line. I also added 50 value Line that will work as median.
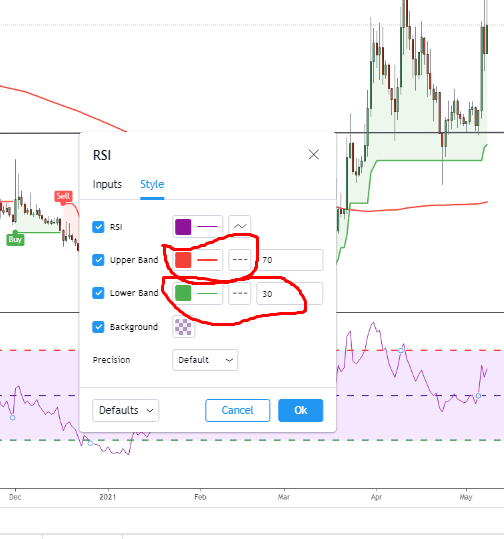
Below interface tells all about RSI working. When the RSI line is below the line of 30, it is Oversold as mentioned in the picture below, and when it goes upwards and above the line of 70, it indicates the Overbought situation of an asset.
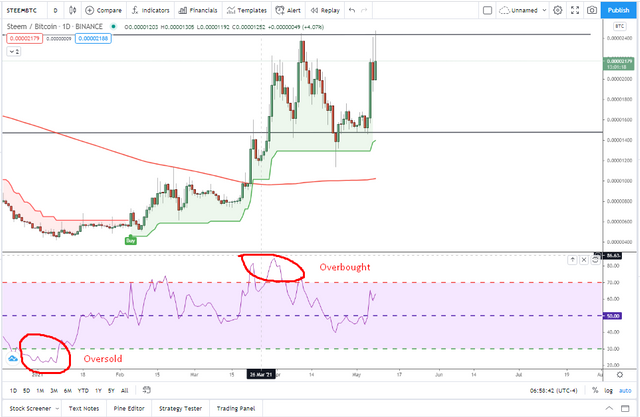
Now, let us see whether the Length can be changed or not. But before doing that, I want to explain that 14 value of Length is by default set. It can be changed according the needs of the trader. This length value is the number of Last 14 candles. These candles can be of any time frame. If your chart is in hourly time frame, RSI will be calculated on last 14 hours candles. If time frame is daily, then it will be calculated by 14 daily candles and source is Closing of the Candle. It can also be changed but most of the time, closing price is taken into consideration.
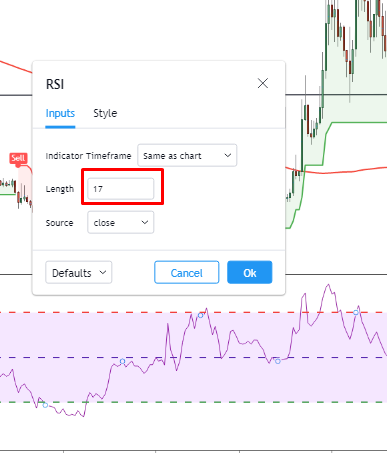
In the above screenshot, It can easily be seen that the Length value can be altered and it can be changed according to the needs of traders.
Overbought and Oversold.
In this part of the post, We will learn how to indicate Overbought and Oversold with the help of RSI.

In this above screenshot, I have identified the Overbought and Oversold. When RSI line is below 30 line then it is said to be Oversold. When RSI line go above the 70 line, then it is said to be Overbought.
In case of Oversold, there is a chance that the market will go upwards and similarly, when there is Overbought situation, then it is expected that the market will go down. So traders look for these signals and enter the market or exit the market.
How do we filter RSI signals to distinguish and recognize true signals from false signals. (Screen capture required)
It is upto the trader how he filters and recognized true signals. As I mentioned earlier that no indicator is 100% accurate, so there can be false indications in this indicator too. But with the help of Divergence, true signals can be identified with the help of RSI.
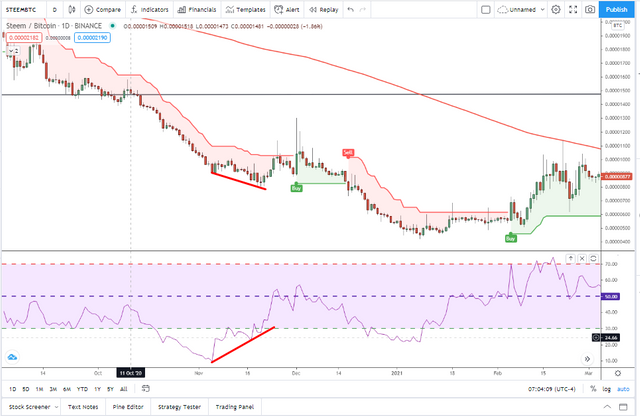
In the above screenshot, I have given example of Bullish Divergence. In this case, the price of Steem keep on falling while the RSI is indicating a change in the RSI. This shows that there is a gap and it is identified as Bullish Divergence. Here a trader can enter the market and you can see, after that market goes upwards.
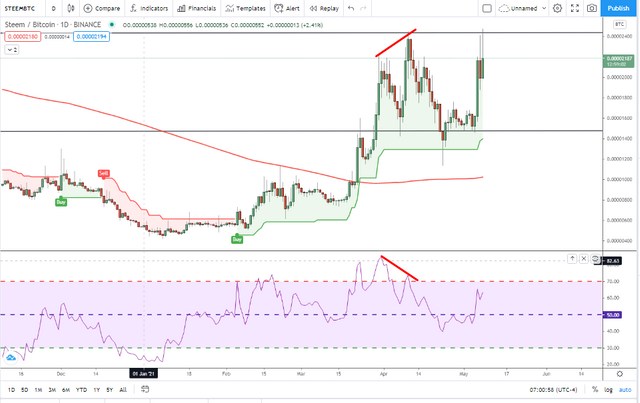
This above screenshot represents Bearish Divergence, where the price of Steem kept on moving Upwards, while the RSI is indicating a fall. This is Bearish Divergence and an imminent fall in price of steem can be expected. So the price goes down from that point and a trader can exit the market while trading steem.
Review the chart of any pair (eg TRX / USD) and present the various signals from the RSI. (Screen capture required)

In the above screenshot, first entry is the Bullish Divergence and that has been a good entry point. I have identified another entry point where RSI is oversold but without any divergence. If taken this entry, it would have proved to be a very good entry point. Oversold indicates a reversal in the price and hence it has reversed big time.

In this screenshot, when RSI enters the Overbought zone, there has been an opportunity to go short or exit the market. There is also a Bearish Divergence and it has also been a true signal for traders to identify.
RSI is being used at large by the traders and with combination of other indicators, it can help the traders in identifying the true and best signals to enter and exit the market. It is also used in Forex and other tradings. It can also be used in Crypto Trading and it can be very successful indicator if used with proper knowledge and other money management strategies are also applied in trading.
Thanks in anticipation.
Regards,

Hi @mawattoo8
Thanks for your participation in the Steemit Crypto Academy
Feedback
This is fairly done. Kindly put more effort into your work.
Homework task
6