Crypto Academy Season 2: Week 2 || Homework post for @stream4u||
Hello all, and welcome to Week 2 of Season 2 of my homework update. Respected Professor @stream4u delivered an extremely thorough and well-explained lecture. Let's get this party started, shall we?
Question 1 -2.
What is price forecasting and why is it so important?
To put it another way, price forecasting is a technique that allows a user to predict the future price of an asset.
Trading is done on the basis of price forecasting, which is done with the help of the user's analysis. Technical, Fundamental, and Sentimental methods are used to carry out these analyses. These techniques will be discussed in more detail later in this article. Price forecasting is a technique that allows a trader to get a clear picture of the market trend. It facilitates a clear understanding of where to enter and exit the market.
Price forecasting is critical in the world of trading. Trading is nearly impossible without forecasting, and it can result in a significant loss for the trader. One cannot enter the market or exit any position taken without first determining the market's direction. Whether trading cryptocurrency or other assets, the trader must first analyse the market before entering it by purchasing an asset. Price forecasting is required for proper trading; otherwise, it is akin to gambling.
Question 3.
Forecasting is done in a variety of ways.
To analyse the market, three different methods are employed. These procedures are outlined in the following sections.
- An examination of technical issues.
The user uses technical indicators to analyse the market in this method. Support and resistance, moving averages, chart analysis, price action signals, trend changing indicators, and so on are examples of such indicators. All of this information came from previous classes.
A trader might enter the market by purchasing an asset at a support level and exit the market by selling the asset at a resistance level, for example. This is referred to as technical analysis.
- Analysis of the fundamentals
The trader does not look at chart patterns in this method; instead, he evaluates the market based on the factors that can affect the value of an asset. These analyses are typically conducted on the basis of the asset's financial statements as well as other external factors that may influence the asset's future price. Any changes in management have the potential to affect the asset's future price.
When a company announces that it will affiliate with or adopt a blockchain, for example, it is likely that the value of that crypto asset will increase. Fundamental analysis is the term for this type of analysis. Such a statement will prompt fundamental traders to enter the market.
Another example is when Elon Musk tweets about Dogecoin, and you can see that it has progressed since then.
- Sentimental Analysis.
In this type of study, a trader examines the market using news, media, and other forum discussions. Such news creates a panic situation, and these traders try to take advantage of it. In such circumstances, there is far too much volatility, which can have both positive and negative consequences. In these circumstances, the market moves very quickly, and traders earn or lose money in a very short period of time.
A trader uses this method of analysis to try to understand the general sentiment of traders, whether it is positive or negative. The value of an asset can also be affected by unexpected good or bad news. This method is often used in conjunction with technical or fundamental analysis, and it can be extremely useful in market analysis.
Which method is better?
The two most popular approaches for analysing the market are technical and fundamental analysis. Both are crucial, and they are extremely beneficial when trading any asset.
Technical Analysis, in my opinion, is superior to all other types of analysis because it has proven to be extremely reliable and has been used by traders for many years. When such a situation arises, fundamental analysis will come in handy; otherwise, technical analysis is best for day-to-day trading.
Question 4.
In this part, I'll try to illustrate how to use Technical Analysis and various tools on chart patterns to forecast prices.
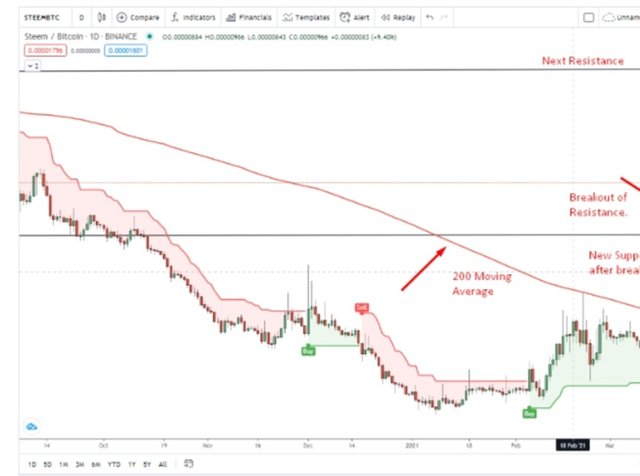
Breakout of Resistance
I listed the 200 Moving Average and the new support level in the previous screenshot. It is now acting as Support following the breakout of this resistance. I also used the SuperTrend Indicator, which predicts that steem will increase in value. The Moving Average has also been broken to the upside, indicating an upward trend. After a breakout, the market usually returns to the new support level to test it. If it succeeds in providing support, the market will resume its upward movement to the next Resistance Level.
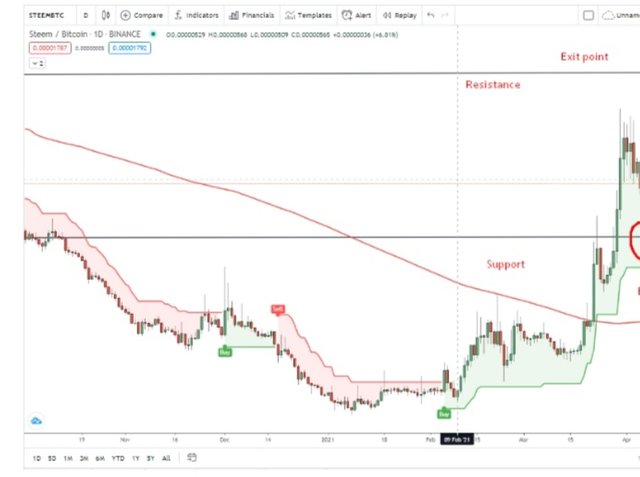
Entry & Exit Points
The entry point, as seen in the diagram, is the point at which a trader must enter the market by purchasing the asset. The support line is frequently used as a point at which the market is rejected and moves upward. It has acted exactly as I predicted in this picture, and it has returned to the next level, which is the resistance line.
When the market reaches the resistance line, the trader should exit because the market could return to the support level from this point. On the basis of the chart, I predict that the market will retest the support level before moving upwards to the resistance level.
In this way, I attempted price forecasting, with the hope that my predictions will come true.
I'd like to provide the source of my post from 06-04-2021, which was about my steem prediction and how the market reacted in the same way. You are also welcome to look at my article.
At the end of the day,
Technical and fundamental analysis are both very important, and traders use these methods to analyse the market. Market price forecasting is done on the basis of these analyses, and traders enter the market after that. These are extremely beneficial methods, and trading without them is a waste of time.
Thanks in anticipation.
@stream4u
Regards,
@mawaisr