Crypto Academy / Season 3 / Week 7 - Homework Post for [@yousafharoonkhan] ― How to create an account on TradingView, how to use indicators,tools, features of tradingview
Hello! Steemians, I am @masumrbd. In Steemit Crypto Academy Season-3, Week-7 is running. Now, I am writing my homework task about "How to create an account on TradingView, how to use indicators, tools, features of Tradingview" for professor @yousafharoonkhan. Let's get started:

Question no 1:
Defining the TradingView site and how to register an account in tradingview? what are the different registration plan?(screenshot necessary)
Tradingview
Tradingview site is a platform that is used by most of the traders. Traders use this site for their technical analysis. The cryptocurrency market is the largest in the world. Tradingview also covers forex, currencies, and stock markets. This site was created in 2011 and now it became popular around the world.
Tradingview site is also a social network for traders. Traders can share their own charts with other traders. This is a great feature. Traders can use this site for price prediction. There are lots of options available to do technical analysis such as built-in indicators are very helpful for all the traders.
Registration process of an account in Tradingview
Tradingview site has both free and pro package options. I will open my account in Free basic plan. Let's get started:
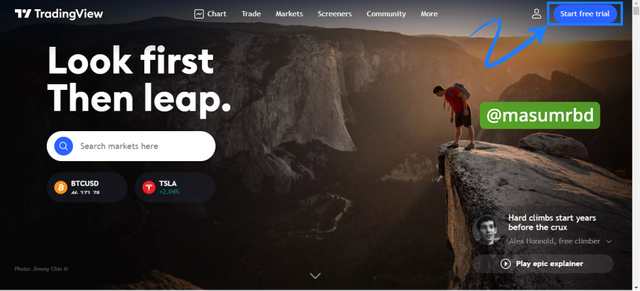
- First, go to the Tradingview official website you will get the following interface. You have to click on the top right Start free trial.
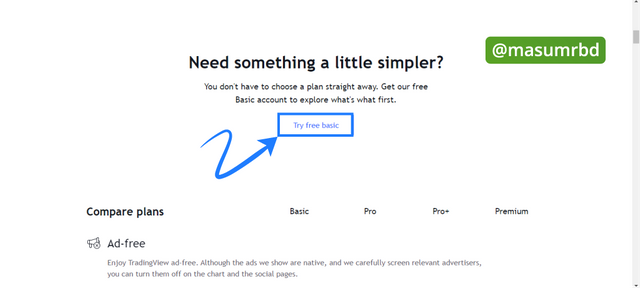
- Scroll down a bit and you will see Try free basic.
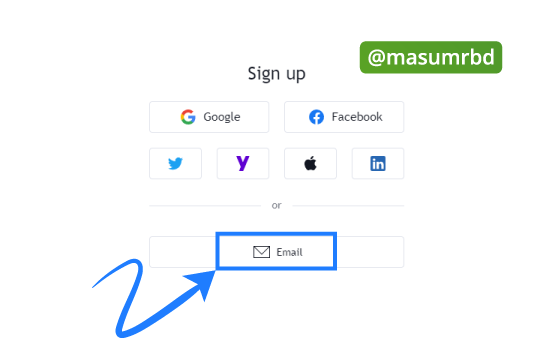
- There are a lot of options that will be available in front of you, you may choose yours. I choose Email.
- Then I put my username, email, password and tick both marks also pass the I'm not a robot then click Create account.
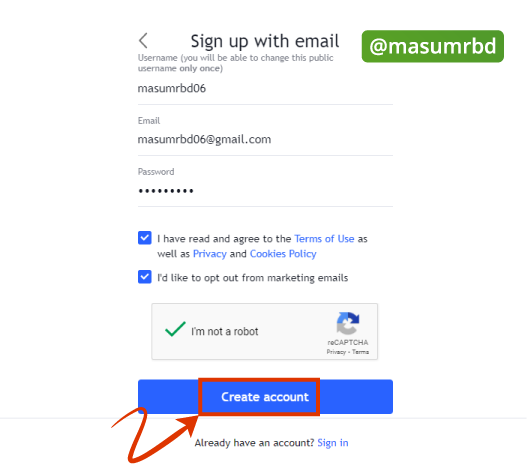
- I got this message. To active my account I visit my email.
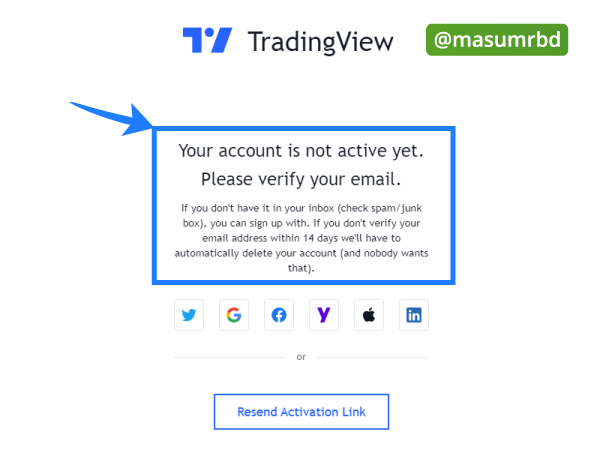
- Then I click Activate account to activate my account.
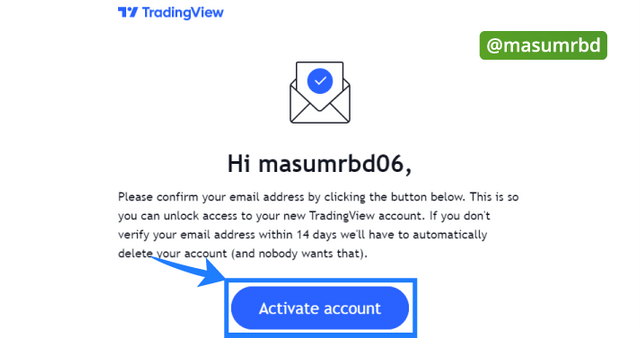
- Not, it's time to put Name and click Continue.
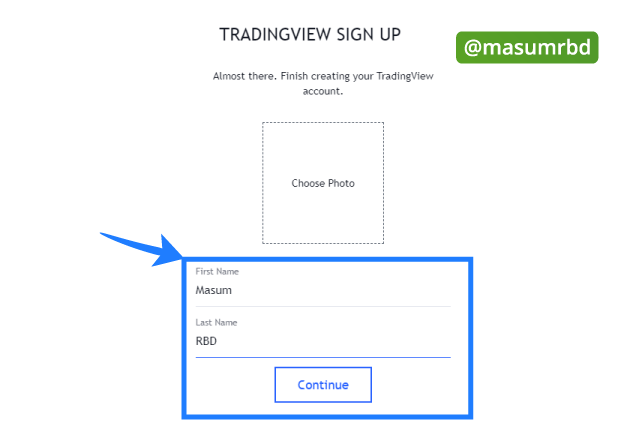
- You can see my registration process is done and I resister an account on the Tradingview site.
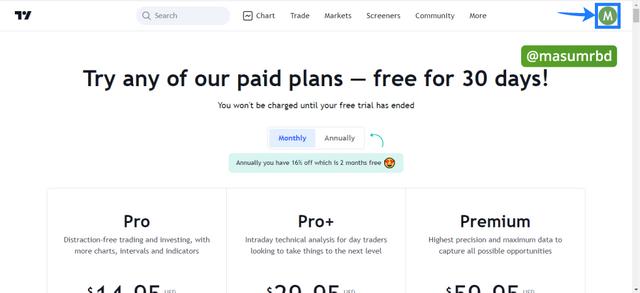
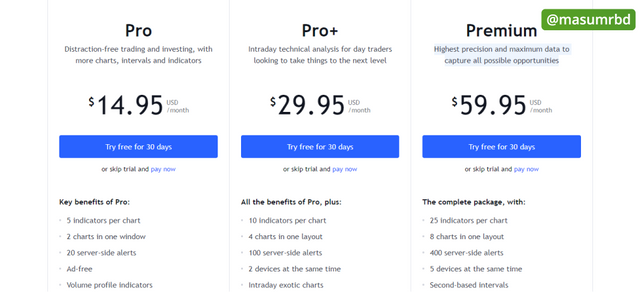
The different registration plans in Tradingview site
There are four registration plans in the Tradingview site,
| Plan name | Information | Cost |
|---|---|---|
| 1- Pro | Distraction-free trading and investing, with more charts, intervals, and indicators | $14.95/month |
| 2- Pro+ | Intraday technical analysis for day traders looking to take things to the next level | $29.95/month |
| 3- Premium | Highest precision and maximum data to capture all possible opportunities | $59.95/month |
| 4- Free basic plan | It's free for everyone | Free |
Question no 2:
Explain the different features of tradingView and what is your favorite feature and why?(screenshot necessary)
Different Features of TradingView
There are many features and sub-features in Tradingview. I will try to explain some of them to you. Let's get started:
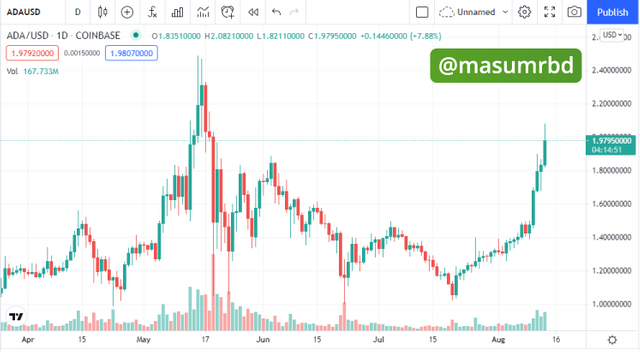
Chart
This feature is the first feature and a very important feature. From cryptocurrency to forex, stocks, and currency, there are many more market charts available. So Tradingview is an ideal place for traders to do technical analysis.
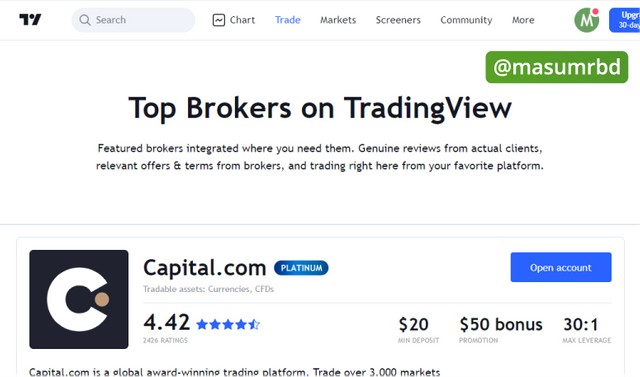
Trade
In this feature two more sub-features, top brokers, and broker awards. This function connects traders with brokers in different markets. You can see the top brokers also their tradable assets and there is also an option rating of the broker. Capital.com is an award-winning trading platform and it supports Currencies and CFDs.
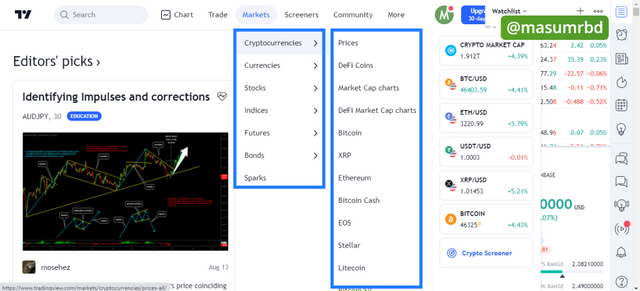
Markets
There are seven different types of markets there such as Cryptocurrencies, Currencies, Stocks, Futures, etc. Each of them have also subcategory. Traders can choose according to their needs.
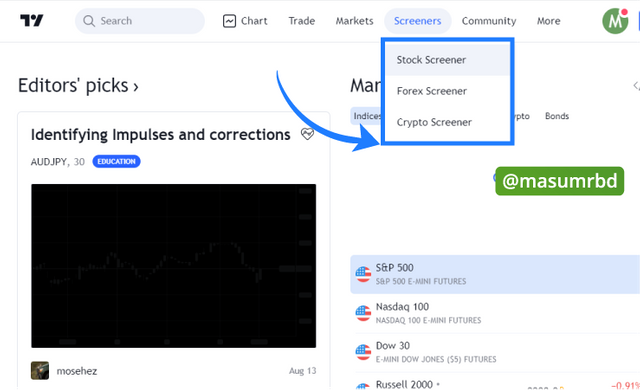
Screeners
There are three types of screeners available, stock screener, forex screener and crypto screener. From screeners traders take advantage by knowing the best results at a time.
My favorite feature Chart and the reasons
The chart is my favorite feature. I think if we survey most of the people love chart. This is a very important feature in Tradingview. Even free users can use this feature and can do technical analysis for their trading.
Indicators are also available in the chart section. There are many build-in indicators that can be used for signals during trading. Before investing in a coin blindly traders do technical analysis most of the time. The indicator which makes it much easier.
The chart also has many features to edit. With which there is an opportunity to draw lines, write text and do technical analysis well. So the Chart feature is my favorite.
Question no 3:
How to set up a chart in TradingView and use two tools to edit it.(screenshot necessary)
Set up a chart in TradingView
Chart setting depends on everyone. Traders do these things of their choice. To do this, first, click on setting. We can see that the chart setting is open. From here different things like symbols, status lines, scales, appearance, trading, events can be configured.
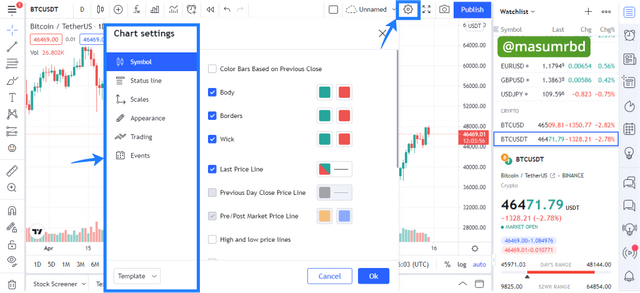
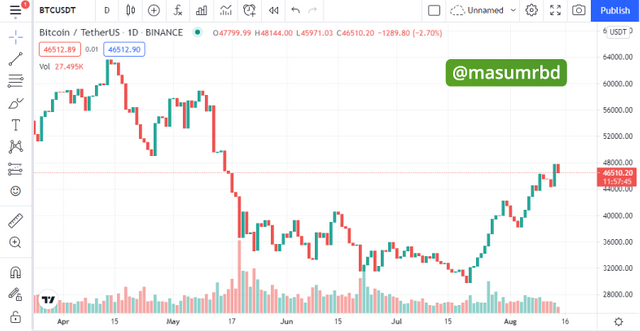
- I removed the wick tick box from the Chart settings and Symbol. See in the chart below there is no wick in BTC / USDT pair. In this way, using the options of chart settings, the chart can be modified very well.
- Appearance to background color change, scale line, crosshair, waterline, etc can be done. I changed the background color.
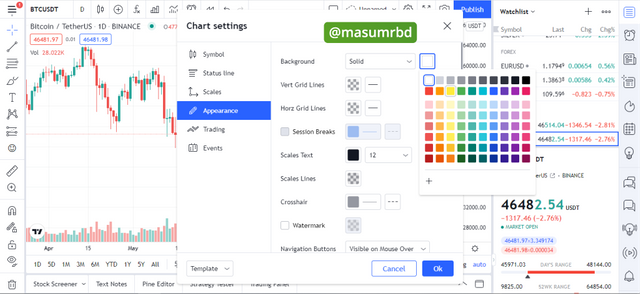
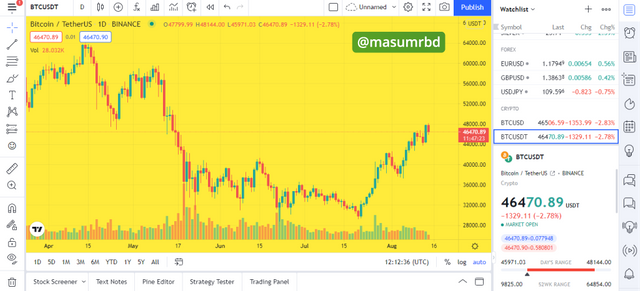
- From Appearance, I chose the yellow color. See how the color changed very easily. There are many more settings like this that work a lot.
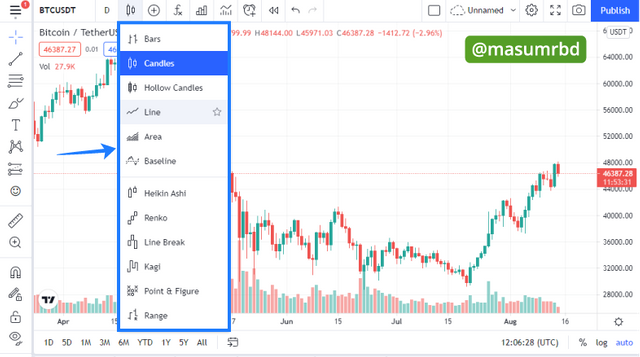
- Also different types of bars, candlesticks, hollow candles, line, area, baseline, etc can be used to modify the chart. It depends on the trader. He is used to it as he is used to it. However, the use of Japanese candlesticks is very high at present. I like it a lot.
Using two tools to edit the chart
There are many tools for editing charts. It is very difficult to choose two of these. I will discuss the two tools Trend lines and Ruller that everyone uses and always uses. Let's get started:
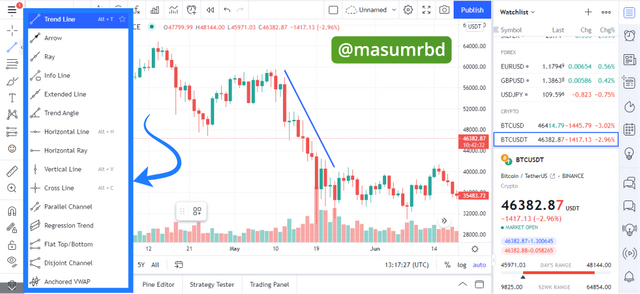
Trend lines
There are many types of trend lines. These are used to show uptrend/downtrend. Of these, I always use the first line. This is what I like best. Also, arrow, ray, trend angle horizontal line, horizontal ray can be used to draw a trend line. It is used by all traders. Very necessary to edit the chart. The downtrend is shown with the trend line in the screenshot below.
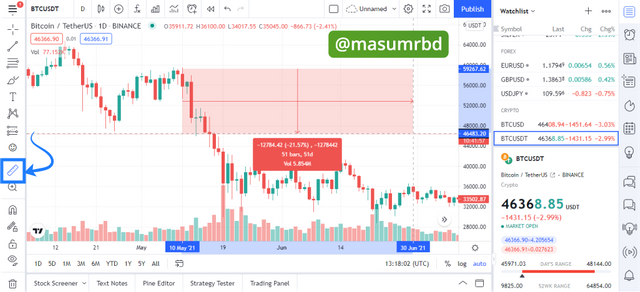
Ruler
Using the ruler gives many benefits to the chart. To use it, first, click on the ruler icon. Then with one click, the ruler will start measuring, as far as necessary there is another click then the ruler will form a rectangle and show the data.
The data in bar, time, volume, and change can be easily seen using it. Which is very useful in the case of technical analysis.
Question no 4:
Explain how to add indicator in chart, what is your your favorite indicator and why? (screenshot necessary)
Add indicator in the chart
To add an indicator to the chart, follow the steps below. Also in the screenshot, I showed where to click. Let's start showing how to do it:
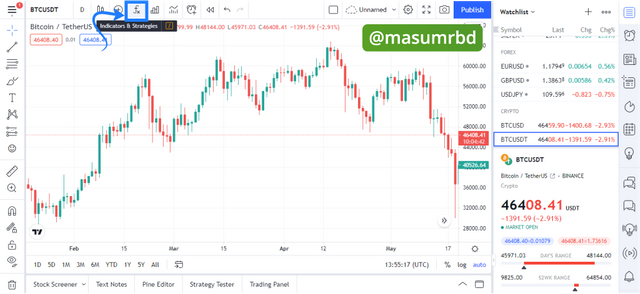
- First, open the chart and select your pair, I am using BTC/USDT pair. Then click the fx to add indicators.
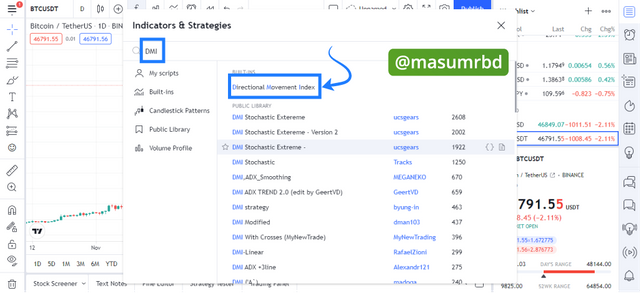
- You will get this window, now search for the indicator you want. I want to add Directional Movement Index indicator so I type for DMI and then click Directional Movement Index.
- As, you can see in the screenshot the Directional Movement Index indicator is added to my BTC/USDT pair.
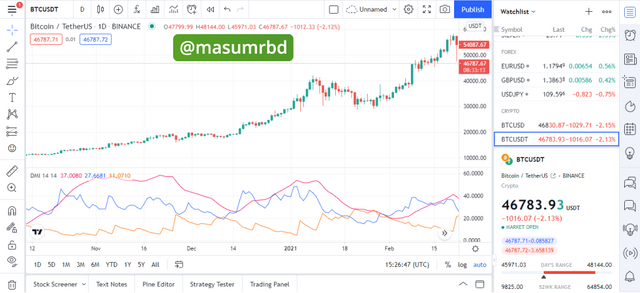
My favorite indicator with reason
Directional Movement Index is my favorite indicator. I think this indicator is good and I can use it very well. There are three lines ADX, D+, and DI-formed DMI. ADX is counted 0-100. If it exceeds 25 then there is a trend in the market. But it can not tell the trend is either uptrend or downtrend. But with the use of DI+ and DI- we can find out it. When these two lines DI+ and DI- crosses each other and DI+ is above DI- then there is an uptrend on the market for vice versa there will be a downtrend.
In this way, we can know the strength of the trend in the market also its direction by using the DMI indicator.
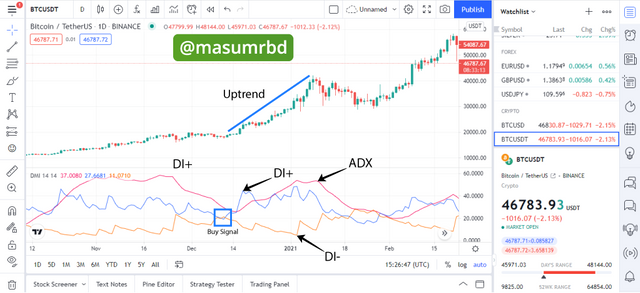
In the screenshot, you can see a buy signal when DI+ and DI- cross each other and DI+ is above DI-. After this, the market is in an uptrend. For these reasons Directional Movement Index (DMI) is my favorite.
Question no 5:
Do you think TradingView is useful in predicting the market for cryptocurrency (trend / price)?
I think TradingView is very useful in predicting the market for cryptocurrency both trend and price. This is the most used platform by traders for technical analysis. There are plenty of options to do technical analysis in Tradingview. Even free users can do their analysis by simply resister on Free basic plan.
Chart feature is very useful than any other feature in Tradingview. We can configure the chart as we like. Also adding a different indicator to the chart gives us a huge advantage in technical analysis.
There are a lot of editing tools. These tools can be used to mark the trend, buy and sell signal, etc. Which is also important for technical analysis.
Overall, I think TradingView is very useful in predicting the market for cryptocurrency.
6
Conclusion
Conclusion
Tradingview is a good technical analysis platform for traders. Traders from different markets such as forex, cryptocurrency, stocks, etc use this tool for their analysis. Tradingview offers a free account as well as their three paid packages Pro, Pro+, and Premium, these packages give extra features. Professional traders use these packages for their analysis.
There are a lot of built-in and scripts indicators in Tradingview which makes the analysis easier. Another cool option traders can share their charts with another trader. This is very good to see another trader's analysis and combine it with your own analysis.
Traders also can edit the chart by drawing. There is also a text tool to write. Besides these features, Tradingview offers many options which can be used for trading.
Best Regards,
@masumrbd
আমি বাংলাদেশের Steemit ব্যবহারকারীদের তথ্য বিশ্লেষণের জন্য একটি গুগল ফর্ম ডিজাইন করেছি। অনুগ্রহ করে উক্ত গুগল ফর্মে আপনি আপনার তথ্যাবলি সংযুক্ত করুন। বিস্তারিত জানতে দয়া করে এই পোস্টটি দেখুন।
ফর্ম লিংক: https://forms.gle/w2a4FtCVarnRUP5f8
Respected first thank you very much for taking interest in SteemitCryptoAcademy
Season 3 | intermediate course class week 7
feedback
your homework is very good, and you explained every points very well, i appreciate you and keep continue good work
Thanks for your remarks.