Starting Crypto Trading - Crypto Academy / S6W1 - Homework post for pelon53.
In your own words, what is fundamental analysis? Do you think it is important for a trader? Justify the answer.
This is a type of analysis traders use in the crypto market before arriving at a decision. Another name given to this type of analysis is “macroeconomic analysis”
This analysis involves the simple study of basic economic factors that has the chance or tendency of affecting price movements or market values of cryptocurrencies. These factors includes news, government policies and other incidences about the asset. For instance news in the crypto market can develop people’s interest in a particular asset. This brings traffic to the asset and demand goes high and will certainly make the value rise on the other hand it can also cause panic leading to people selling their assets which will also make the price fall.
I personally think it is a very important technique for every trader to use during his or her trading career. The success of a trader depends on his or her ability to carry out analysis.
On May 12, 2021 Elon Musk tweeted saying his company, Tesla had suspended vehicle purchases using bitcoins. Any trader with the aid of fundamental analysis will be able to tell that the price of bitcoin would drop and it will be best if he sells his assets. Fast forward the price of bitcoin dropped by 15% after that tweet went viral. You can read news on that from this link

Explain what you understand by technical analysis and show the differences with fundamental analysis.
This is a type of analysis that makes use of metrics or characteristics of a certain cryptocurrency to be able to predict its price or value in the future. It uses facts or historical data to study and identify trends or pattern in the crypto market in order to make predictions on the price movement in the future.
This type of analysis makes use of charts and graphical representations of the market. In technical analysis we use strategies and technical tools and indicators designed for the study of market behavior.
In other to use this analysis you need to use market chart pattern, volumes, indicators, candlesticks etc to know how the currency behaved in the past on upon studying from the chart you will now make a prediction on the price movement of the currency.
In summary technical analysis is simply act of studying the market behavior with the aid of charts, indicators tools etc to be able to predict future price movements.
DIFFERENCES BETWEEN FUNDAMENTAL AND TECHNICAL ANALYSIS.
| FUNDAMENTAL ANALYSIS | TECHNICAL ANALYSIS |
|---|---|
| It deals with happenings around that has the ability to affect the market value of an asset. | its deals with the metrics of an asset. |
| It doesn’t require any historical data or information. | it requires the use of historical data and information. |
| Fundamental analysis is good for investment options | Technical analysis is good for trading options |
In a demo account, execute a sell order in the cryptocurrency market, placing the support and resistance lines in time frames of 1 hour and 30 minutes. Screenshots are required.
The charts below is a cryptocurrency market with timeframes of 1 and 30 minutes.
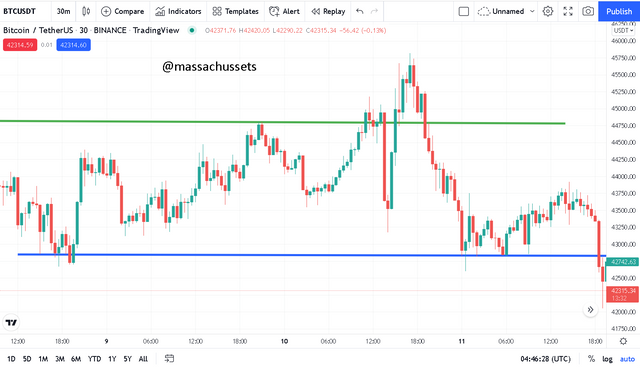
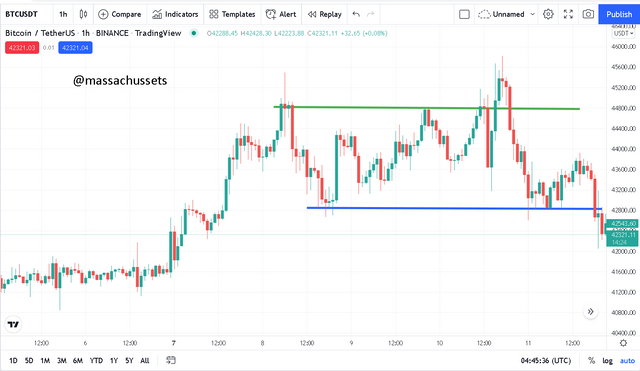
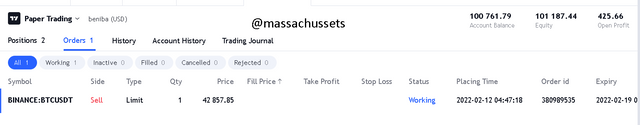
We can see that on the charts two horizontal lines are drawn. These two lines are 1. The support line and 2. The resistance line. From my analysis of the market it is clear that market has just started trading above the support line and hence a good time to place a sell order as it is the beginning of an downtrend. The following screenshot is also a copy of my sell order on papertrading.
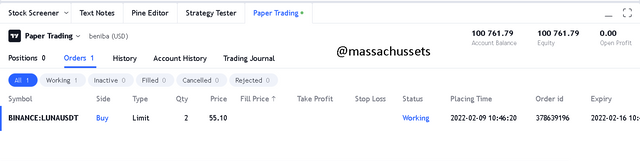
In a demo account, execute a buy order in the cryptocurrency market, placing the support and resistance lines in time frames of 1 day and 4 hours.
The charts below is a cryptocurrency market with timeframes of 1 day. We can see that on the charts two horizontal lines are drawn. These two lines are 1. The support line and 2. The resistance line.
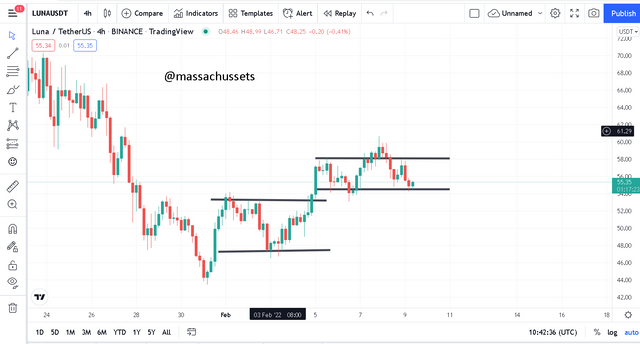
From my analysis of the market it is clear that market has just started trading above the resistance line and hence a good time to place a buy order as it is the beginning of an uptrendtrend. The following screenshot is also a copy of my sell order on papertrading.
Explain the “Hanging Man” and “Shooting Star” candlestick patterns. Show both candlestick patterns on a cryptocurrency market chart. Screenshot is required.
HANGING MAN.
Hanging man candlestick pattern is a candlestick pattern associated with an uptrend reversal. Thus it is a pattern that is formed at the end of an uptrend of a particular asset. It marks the end of an uptrend and the beginning of a downtrend in the market. It can be described as a bullish candlestick with a relatively small body which has a very long lower wick and mostly no upper wick or a very short upper wick. For a candlestick be described or called a hanging man, the following features must be seen:
• The opening price and closing price must not be far from each other giving it a small body.
• It must appear in a bullish trend.
• The lower wick must appear to be very tall or long.
• The appear wick should not exist or it should be very short.
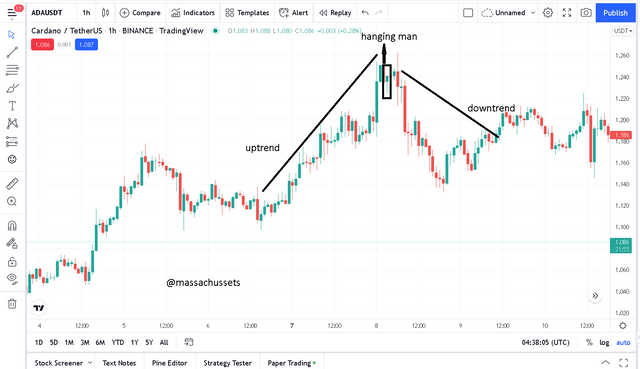
As I indicated it indicates a possible trend reversal and hence gives a sell signal. The likelihood of the tend reversal occurring can be measured using the length of the lower wick, thus the longer the wick the high the chances of the trend reversal occurring. A graphical explanation is of a hanging man is shown in the screenshot below.
SHOOTING STAR
This is also a candlestick pattern that is created during a bullish trend or uptrend. It marks the end of a bullish run and issues a signal of a trend reversal. Anatomically the shooting star is a small bearish candlestick with a very long upper wick and a very short or n lower wick. Just like the hanging man the shooting star also has its features that should be noted:
• The opening price and closing price must not be far from each other giving it a small body.
• It must appear in a bullish trend.
• The upper wick must appear to be very tall or long.
• The lower wick should not exist or it should be very short.
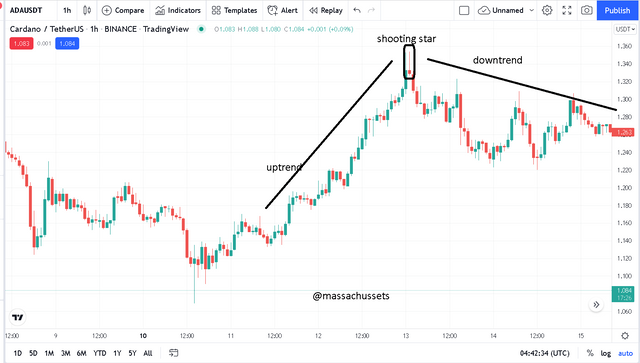
It is a pattern that when formed issues buy signals. Traders need to sell at this point when the prices are still very high and expect the trend reversal to occur.. An example of a shooting star is shown below.
For every crypto trader this statement “the trend is your friend” rings in his mind almost every time. Identifying trends and trend reversal can be very key to one’s trading career. The bedrock of a good trader is his analysis. Fundamental and technical analysis are the two mostly widely used methods but we can still add sentimental analysis to it. Whilst fundamental analysis deals with happenings and events around an asset that has the ability to influence its price whilst technical analysis makes good use of historical price data and other metrics in the market. Thanks to @pelon53 for such a wonderful lecture.