Crypto Academy / S6W2- Homework Post for @reminiscence01".
Explain your understanding of price action.
Having been privileged to be part of the steemit crypto academy for the past seasons, I have had some lessons on technical analysis. Price action to be is the bedrock to technical analysis. Price action provides the foundation for other forms of technical analysis. To my understanding I will say that price action refers to the price movement of an asset being plotted over time thus it refers to the ups and down in price of an asset over a period of time. Price action can be used in numerous ways to the benefit of the trend. Price action is used to know the current trend a market is in and to make predictions about future price movements. Price action can be plotted in different ways to give better results and good prediction. With the use price action in technical analysis support and resistance levels are derived from its price history thus it makes good use of price history. The establishment of resistance and support levels are very instrumental in creating entry and exit points. Patterns are created in the chart being the price action which helps in arriving at a conclusion in the market.
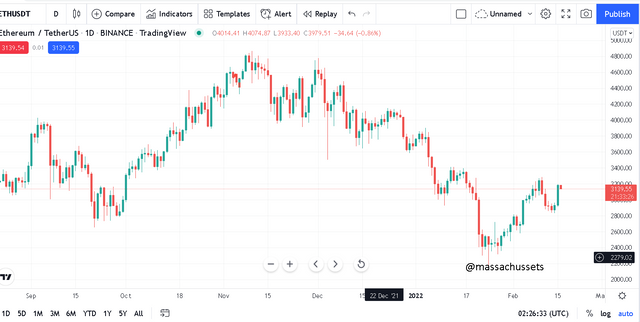
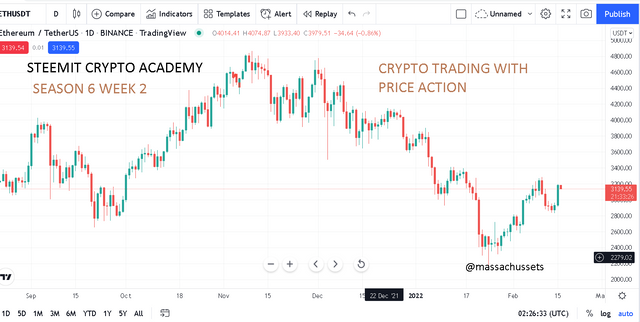
PRICE ACTION OF ETHEREUM

What is the importance of price action? Will, you chose any other form of technical analysis apart from price action? Give reasons for your answer.
IMPORTANCE OF PRICE ACTION
It Eliminates Noise From The Market
We know that we have whales in the market that sometimes tries to move against the trend in the market and this is termed as noise. This noise in the market can be confusing to the trend traders in the market. Unlike the use of technical indicators noise is filtered out in price action. This is important because false signals are not issued and very good entry points are created.
TREND IDENTIFICATION AND MARKET STRUCTURE IS SIMPLIFIED*
With the use of price action, it becomes very easy to read and understand the market at a given time. We the generation of support and resistance levels in the price action trend reversal are also easily spotted and traders take advantage to open or close trades.
VISUAL REPRESENTATION OF TRADER’S PSYCHOLOGY
Majority of traders are driven by emotions in the market. The trader’s emotions and psychology has a direct impact on the price movements on assets. With the price action the emotions are represented and from that we can tell the next direction of the assets’ price.
CHOOSING OTHER FORMS OF TECHNICAL ANALYSIS AND WHY
I will personally not decide to choose another form of technical analysis entirely but I will rather pick other forms to support the price action technical analysis. My reasons are:
No technical analysis is 100% guaranteed of success and price action is a form of technical analysis that is able to filter out noise in the market and as results the occurrence of false signals are minimized. A comprehensive and good trading plan can be developed. Combining it with other forms technical analysis like the use of indicators on charts is good because some of the indicators will help in your decision making as it will be able to also identify over bought zones and oversold zones to support your resistance and support zones generated by price action.
Explain the Japanese candlestick chart and its importance in technical analysis. Would you prefer any other technical chart apart from the candlestick chart?
The Japanese candlestick chart was developed in the 18th century by a rice trader in japan called Muneshia Homma. Japanese candlestick chart is a graphical or visual representation of what happens between buyers and sellers in the market. The Japanese Candlestick is applicable in all aspects of trading but for the purpose of this assignment I will limit my write up to only crypto trading. This is a chart where a candlestick is used to reflect the price movement of an asset over a specified period of time.
The candlestick Is made up of four major components each representing a specific point in the price movement. The parts are as follows; open, close, high and low.
the explanation of the four components are below:
• OPEN
This component marks the beginning of the price movement. This is the price at which movement originated from. It is the price at which an asset was sold at at the beginning of the price movement within a specified time
• HIGH
This is also known as the highest price. By the name we can conclude that this component points to the point at which the asset reached its highest price during the given time.
• LOW
This is also known as the lowest price. By the name we can conclude that this component points to the point at which the asset reached its lowest price during the given time.
• CLOSE
This is also known as the closing price. This part of the candlestick that tells the ending price within the given time.
ITS IMPORTANCE.
The Japanese candlesticks contains a lot of information the makes it very easy to read, understand and interpret them during trades. It helps in visualizing the psychology of traders. A candlestick has the ability to give information on the buying and selling pressure in the market at a particular time. With the use of candlesticks certain patterns are formed and they give signals depending on they are formed. So basically it gives traders a fair knowledge of what the market is situation is and predict future happenings.
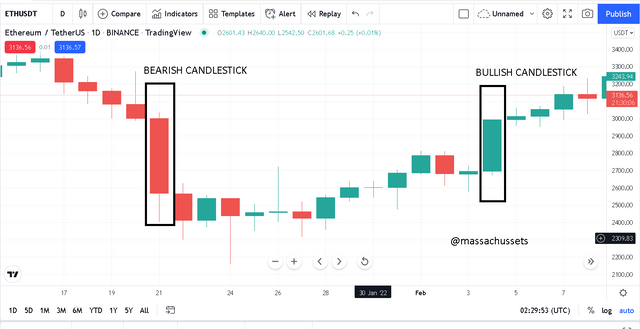
I wouldn’t prefer any other chart to candlestick charts because of the special quality of having contrast representing the two situations thus,t he default color for a bearish candle is red whereas the default color for a bullish candle is green, these colors van be changed to suit your preference. The ability of candlesticks to blend with other indicators to give very accurate signals is also one of the reasons why I prefer the Japanese candlesticks chart.
What do you understand by multi-timeframe analysis? State the importance of multi-timeframe analysis.
Multi-timeframe analysis is a form of technical analysis where the trader picks out his preferred cryptocurrency pair to study its price movements in different timeframes with the aim of getting enough information about the current market situation. For example I can open the chart of ERTH/USDT pair with the 1 hour timeframe, 4 hour timeframe and 1 day timeframe. Multi-timeframe analysis helps in predicting the future price movements and also to get good entry and exit points.
IMPORTANCE
It is a very important form of analysis because it has the ability to cancel or filter noise from the market and gives the traders very reliable feedbacks.
It also has the ability to suit any type of trading. Whether the trend traders or the swing traders. Multi-timeframe analysis suits perfectly to any type of trading plan.
It also helps traders to get very good trading plans especially entry points, take profit positions and stop loss positions.
In all it is a very important tool in technical analysis.
With the aid of a crypto chart, explain how we can get a better entry position and tight stop loss using multi-timeframe analysis. You can use any timeframe of your choice.
As we are all aware that multi-timeframe involves the analysis of an asset using different timeframes. I will be using 2 different timeframes in this analysis in order to;
Identify the market trend
Spot out good entry and exit points.
The first timeframe I will be using is a 1 day chart of
The picture below is a 1 day timeframe chart of SOLUSDT pair.
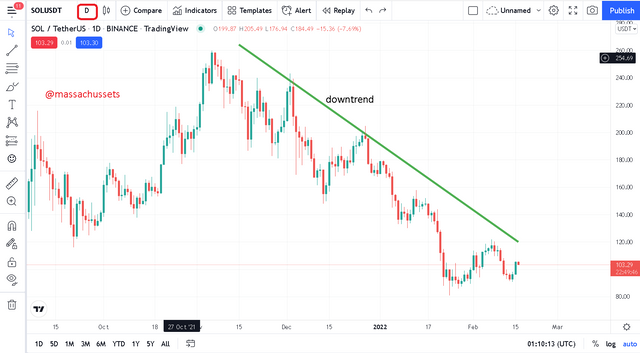
The purpose of using this time frame was to first of all identify the trend the market is in. from the 1 day chart of SOLUSDT I was able to identify that the market is in a bearish trend or a downtrend. At this point the prices are low and buying it at this stage might be a good decision.
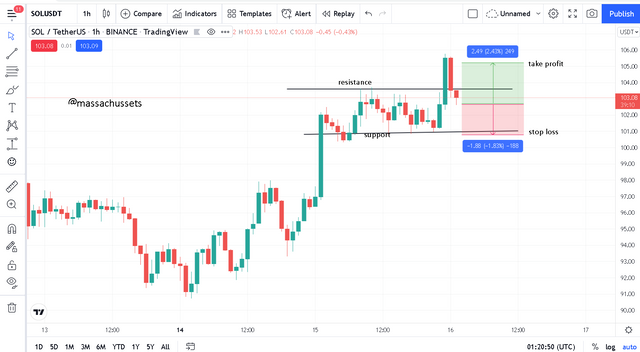
The second chart is a chart of SOLUSDT of 1 hour timeframe. With this timeframe I aimed at getting a good entry point and then setting up take profit points and stop loss points using the resistance and support levels.
Carry out a multi-timeframe analysis on any crypto pair identifying support and resistance levels. Execute a buy or sell order using any demo account. (Explain your entry and exit strategies. Also, show proof of transaction).
I carried out a multi-timeframe analysis on ATOMUSDT pair with the 1 hour timeframe and the 15 minutes timeframe.
With the 1 hour timeframe I was able to identify that the asset was in an uptrend and had broken through the resistance level. Everything was indicating a further upward movement in price.
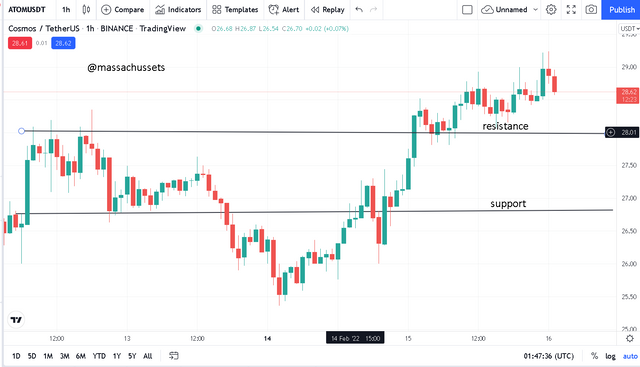
i hour timeframe.
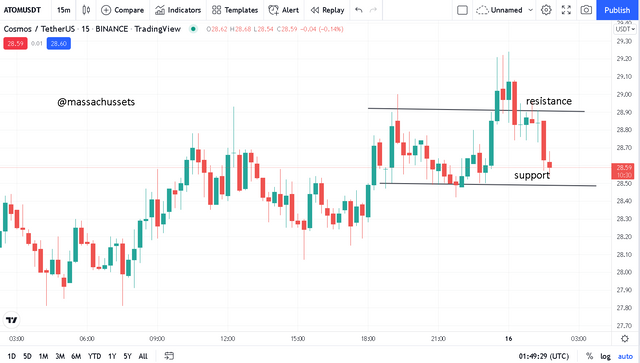
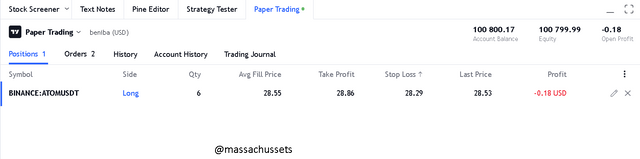
I proceeded to study the 15 minute chart of the same pair. On this timeframe the price was about hitting the support zone making it the right time to buy the asset I therefore decided to buy 6 units of atom at 28.57 and set my stop loss a little below the support level at 28 and kept my take profit appoint above the resistance level that’s 29.
Crypto trading is one of the best places to make an investment. Investing in crypto currencies has a great potential of giving you good returns at the same time it can make you lose your hard earned money. It is very necessary to carry out a very effective technical analysis on an asset before deciding to invest in. price action is the basis of technical analysis as it plots the price movements over time. Being able to read and understand gives you an advantage in the market. Carrying out multi-timeframe analysis also helps you in finding very good entry and exit points. Thanks to professor @reminiscence01 for such a good lecture