The Homework Task Steemit Crypto Academy Week 15 - Homework Post for @fendit
My Glo Number:
COMPOSITE MAN AND FUNDAMENTAL LAWS
Wyckoff is a pioneer in the technical methods of stock market research.He analyzed these market operators and their operations, and came to the conclusion that trading risks and returns are optimal.
He showed the position of stop loss at any time and the importance of managing any trading risk, and he explained the technique of movement in the megatrends (bullish and bearish).
The Wyckoff analysis method involves five steps in stock selection and entry timing. The following is an introduction to the five-step method:
1)Determine the current state of the market and possible future trends
2)Choose stocks that are in line with market trends
3)Select stocks whose "reason" equals or exceeds your minimum target.
4)Make sure the stock is ready to move
5)When the stock market index reverses, there must be timely contingency measures
The key part of Wyckoff's market observation is price movements. In order to understand the assets and the market as a whole, he developed a practical method, which he called a "composite man"
COMPOSITE MAN
Wyckoff reminded traders that they shouldfollow in the footsteps of the Composite Man and think like a Composite Man. He says:"All the stocks and all the fluctuations in the market should be regarded as the result of one person's operation. I call this person a comprehensive person.
In theory, this person controls the stock in the background. If you are familiar with his rules of the game, you will benefit greatly; if the rules is not understandable, The operation will also not be beneficial to you."
Wyckoff’s “composite man” puts forward the theory that all price fluctuations in the market should be regarded as the result of one man manipulating assets. If the rules of this game is not understandable, There will be lost of assets from the individual. If you understand his way, it will be to your advantage. He believes that it does not matter whether the fluctuations in the market are due to real trading or artificial price manipulation by larger operators.
In his method, Wyckoff listed several rules that traders should follow and pay attention to.Personal assets will not have the same performance twice. Instead, trends unveil through a different kind of the same price patterns, showing infinite differences in details,sizes and expansion. Every time they appear, they change just enough to amuse traders and cause confusion to the market. This is the "deformation phenomenon" familiar to many traders.
I
FUNDAMENTAL LAWS
Wyckoff believes that through detailed supply and demand analysis, including studying price behavior, volume and time, we can understand and predict the market. As a broker, he can observe the practices of successful trading groups and interpret their ideas through stock charts and point-and-figure charts.
The schematic diagram shows the preparation and operation method before the operation of the large mechanism. The entry point for going long is the late stage of the preparation stage before the big institutions pull up; the entry point for shorting is the late stage of the preparation stage before the market drops.
Wyckoff’s icon analysis method is based on three laws, which affect all aspects of stock analysis. For example, the forecast of the market and individual stocks, how to select stocks and the appropriate points to enter the market.These fundamental laws include:
1)The principle of supply and demand determines the direction of the price:When supply is less than demand, prices will rise; when supply exceeds demand, prices will fall. Traders can analyze the relationship between supply and demand through the relationship between price and volume on the K-line chart. This law sounds simple, but it takes a long time to practice to accurately grasp the relationship between volume and price.
2)The principle of inconsistent volume and price can provide early warning of trend changes:Inconsistency between volume and stock prices is often a sign of a change in trend. For example, in the case of continuous heavy volume, the increase in stock prices is getting smaller and smaller.
- The principle of causality can explain the magnitude of future price rises and falls:
Causality can help investors predict target prices. Calculate the size of the future market by calculating the chips in the sideways interval. You can use a point and figure chart to analyze the cause and predict the result. The "cause" is the number of points in the horizontal interval in the point and figure chart, and the "effect" is the ups and downs of the stock price caused by these points.
Basically looking at the composite man and the fundamental laws of wyckoff's method there are some views on each For the composite man,it is made known that all manipulating assets or anything that wants to happen concerning the rise and fall of the marker will solely be determined by an individual irrespective,which will give the individual an authority to do whatever he wishes and might lead to losses to investors who doesn't abide by his ruling.. It works best in a smaller time frame, so if this is not what you like, you have put another method or theory into consideration.
But as for the fundamental laws which is more considerate to the investors depends on the participation of the investors will determine what will happen in the stock market which will go a long to give people a say in the market rather than getting only an individual to get involve in the manipulating assets or any other related issues concerning it.
CHARTS
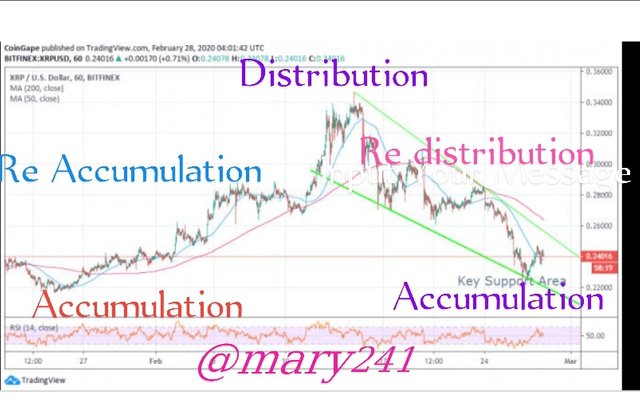
In the above diagram there are cycle of wyckoff method for Ripple:
1)Accumulation:There is no much different between the price and the value of ripple since it is just at the beginning and the coin is just invented, so the chart goes sideways. Here, the Composite Man takes advantage of this situation and he accumulates assets before the rest of the investors notice.
2). Markup/Uptrend: Once the accumulation is over and the supply gets scare, the Composite Man will try to inflate the price . As there's more volume and movement regarding that asset, the price rise will probably attract other investors as well. In the chart, it iis clearly shown that the demand has become higher than the supply .It can happen that, during a markup period, there's some other re-accumulation phase.
Distribution: Once again, the chart will show sideways movements, as the Composite Man will start selling his position very slowly till the demand gets completely absorbed. The price has reached its peak and there are just a bunch of last-time buyers getting into the asset.Also due to the fact the price is now higher so more investors will try to keep it and some will try selling since they have been trading for a long time.
Downtrend/Markdown: Once the Composite Man has sold part of his assets, he will try to push the market and the price down again. At this point, the supply will be much greater than the demand, as the rest of the investors will try to sell their positions as well, as the price will get extremely bearish and the it start again from the beginning as how it continues.
the current situation is that many professional traders and institutions use Wyckoff’s method, while the retail public is still not widely used. Nevertheless, the completeness, systematicness, and logic of Wyckoff's method, as well as the ability to find high-probability and high-yield transactions, have made his stock selection method and investment strategy stand the test of time. Wyckoff’s training methods enable investors to make sensible, fact-based trading decisions without being disturbed by emotions.
Using the Wyckoff method, traders can put their funds on the main smart money side of the market instead of on the wrong side. Mastering the Wyckoff method requires a lot of practice, but it is definitely worth the money.
Disregarded as it contains plagiarized content
@sapwood