The Homework Task Steemit Crypto Academy Week 12 - Homework Post for @kouba01
RELATIVE STRENGHT INDEX
Relative strength index ( RSI) is an indicator used in the detection of oversold or over bought conditions and it monitors the bullish and bearish trends of this ever fluctuating markets , so it is a very reliable variable in the price forecasting of a given pair of token.
I made mention of oversold and overbought , so lets us discuss these terms briefly.
Overbought:
This is a condition whereby the demand far exceeds the supply , meaning more people are buying that particular token and less people are selling. This condition usually leads to a hike in the price of a token.
This can be caused by some declaration of real life adoption of a particular token thereby causing a decrease in sales; as everyone is anticipating an increase in the price , and thereby resulting in the sharp increase in the coin price.An asset is considered overbought when the RSI move s above 70% .
Oversold:
This is a trade condition whereby there is a more supply and a relatively less demand . what this means is that there is an oversupply of a particular coin ; more people are selling, and there are fewer buyers .
This is a very good time to buy some tokens. This is indicated by an RSI value less than 30%.
The RSI oscillates between zero and one hundred and a mostly is within the 30% and 70% range. The 30% mark is represented by a dotted green line and the the 70% mark is represented with a red dotted line.
HOW CAN THE RSI VALUE OF A COIN BE CALCULATED?
The RSI value of a particular market can be calculated from a candle chart , by using the relationship bellow.
RSI = 100 - (100/1 + RS) , but
RS = (sum of the closing high values / n) / (sum of the closing low values / n)
n = The number of periods; length of time in question( 14 in most cases) .
Can I trust the relative strength index(RSI) when analyzing trade?
To some very good extent the RSI is a very good indicator used extensively in price forecasting ; it is more efficient when the market is a quite stable one.This indicator can be trusted because it monitors the overall momentum of the particular market .
If the RSI value is high and the coin price drops , it indicates that there is a high tendency of a rise in price and vice-versa . Also ,a high RSI value means the asset in question is doing well or is in a bullish trend , thereby helping the trader to make smart buys and make profit.
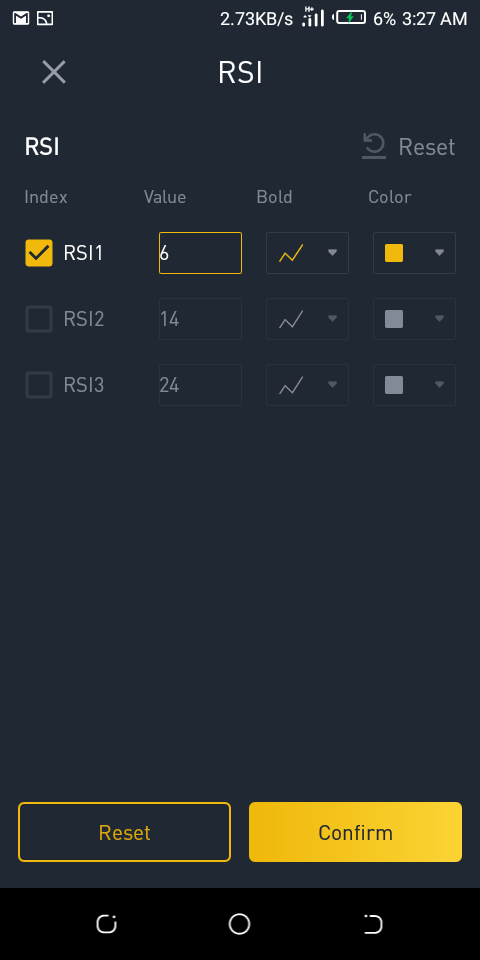
How to configure the RSI indictor on BINANCE
The relative strength index(RSI) has a length parameter of 14 by default . what does the 14 mean? By 14 it means that when you are looking at the daily chart ,then the RSI analysis will only depend on data collected within a 14 days period , an d you are considering a hourly chart , then the analysis will depend on data from a 14 hour time interval and so on.
Though it usually has a default length of 14, it can be varied ; it affects how quickly the overbought or oversold phenomena will occur.
.
STEP 1: Open the binance app on your device or download one from your APP store is you do not have it and get registered.

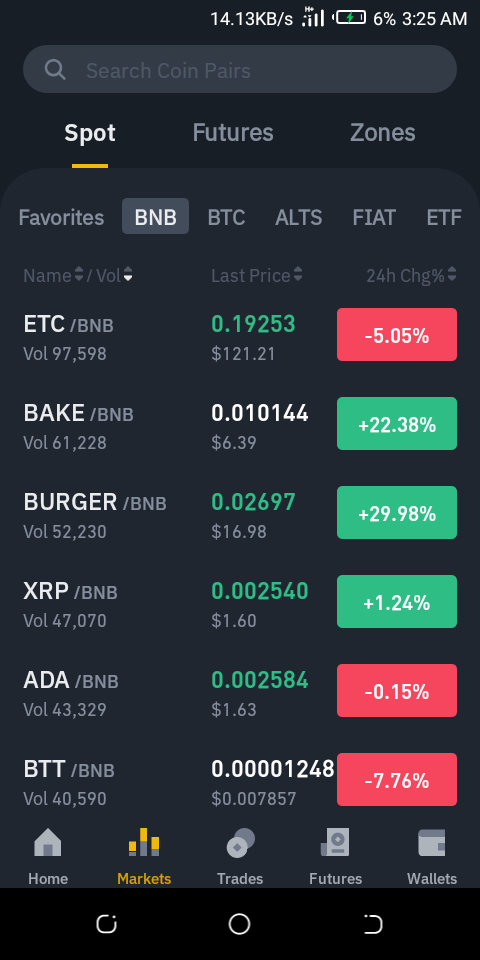
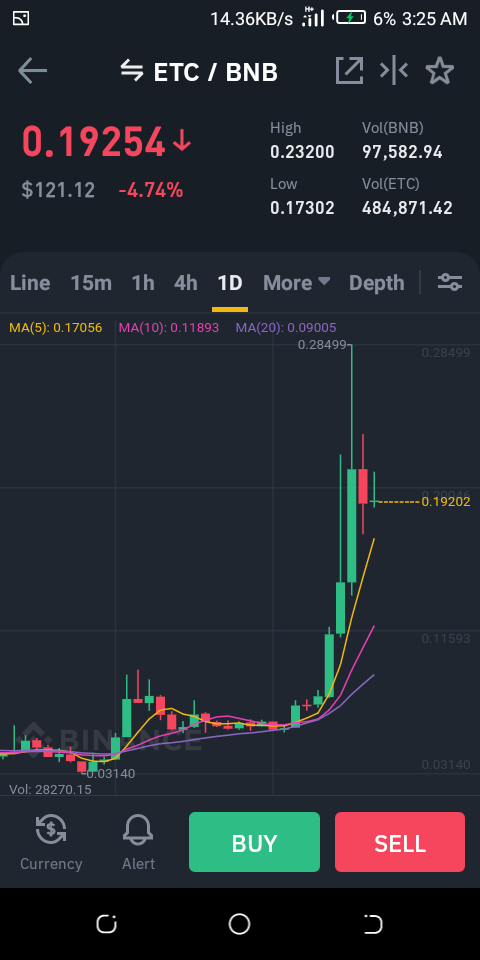
STEP 2: Click on “market” and select a trading pair of your choice (ETC/BNB in my case)
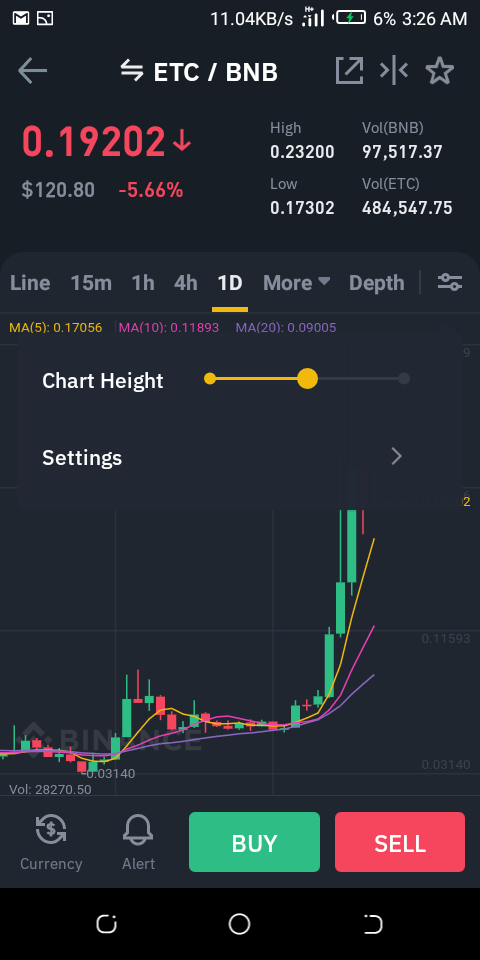
STEP 3: Click on the settings icon at the top right hand corner of the chart .
STEP 4: Click on “ settings” icon on the subsequent menu
STEP 5: Click on “index setting”
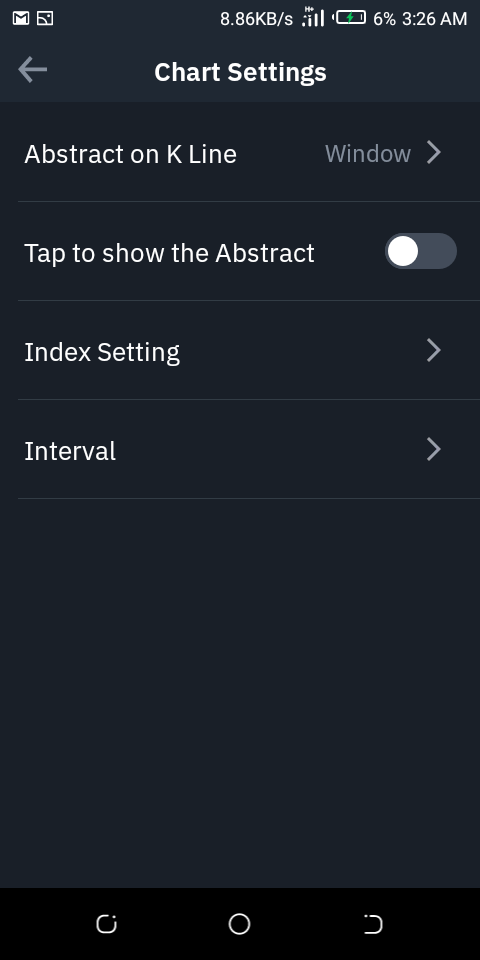
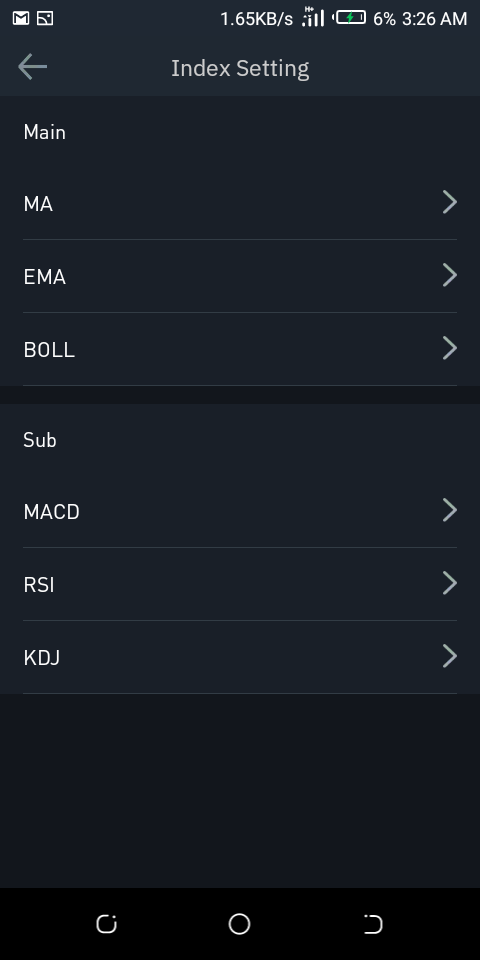
STEP 6: Click on “RSI” under submenu
STEP 7: Select the length of your choice and click on “ confirm”
How do we interpret the overbought and oversold signals when trading?
If you are using binance , then all you need to do is open the Binance exchange app and go to the candle graph of any asset of your choice , you would see some tools bellow the graph. Change it to RSI to reveal the RSI oscillator .
An upward peak means the market is experiencing an overbought condition whereas a downward peak indicates an oversold signal.
An RSI value greayer than 70 % means the asset is doing well irrespective of the price so if the price is low, it is advisable to hold on because it has a high tendency to increase soonest ; it may reduce very quickly too , so timing is also very important .
How to filter false signals from true signals.
There is every need to know when to enter into a particular market , but sometimes you may be deceived by false RSI signals and end up incurring losses .
Like I mentioned earlier, the RSI indicator is best for coins that are a bit stable, so if the market is very volatile, the RSI starts to give false signals.
One of the best ways to avoid false signals is the use of more than one indicator during analysis but using the same interval or parameter and also analyzing the volume of the market and also doing some fundamental analysis , like what economic activity is prompting the price change , etc.
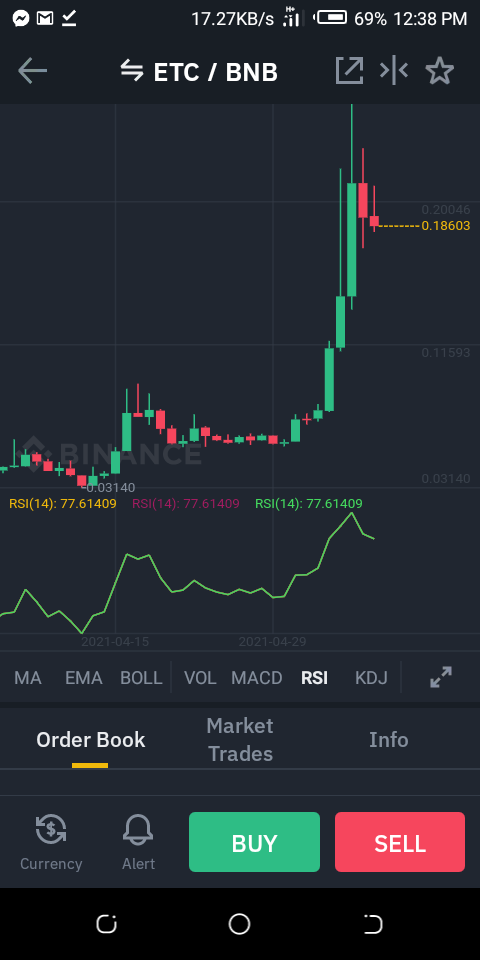
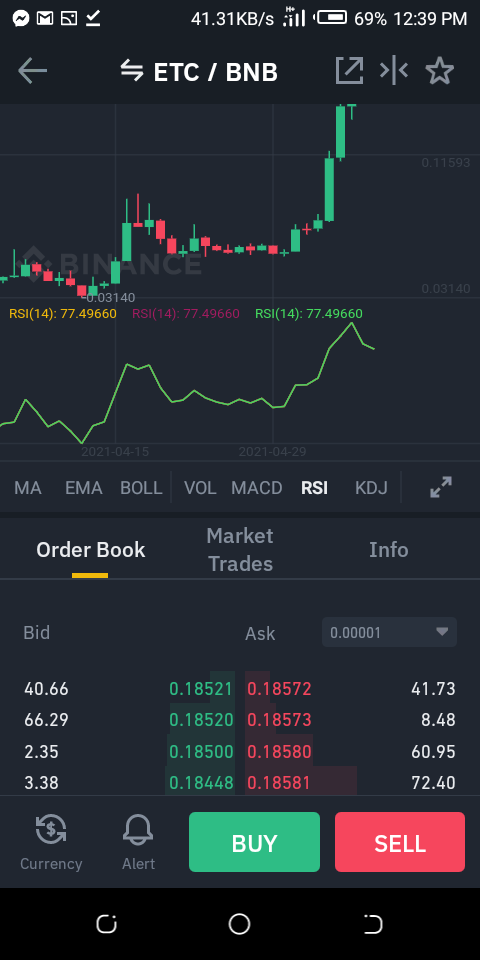
A review of the candlestick chart of ETC/BNB and the signals from RSI
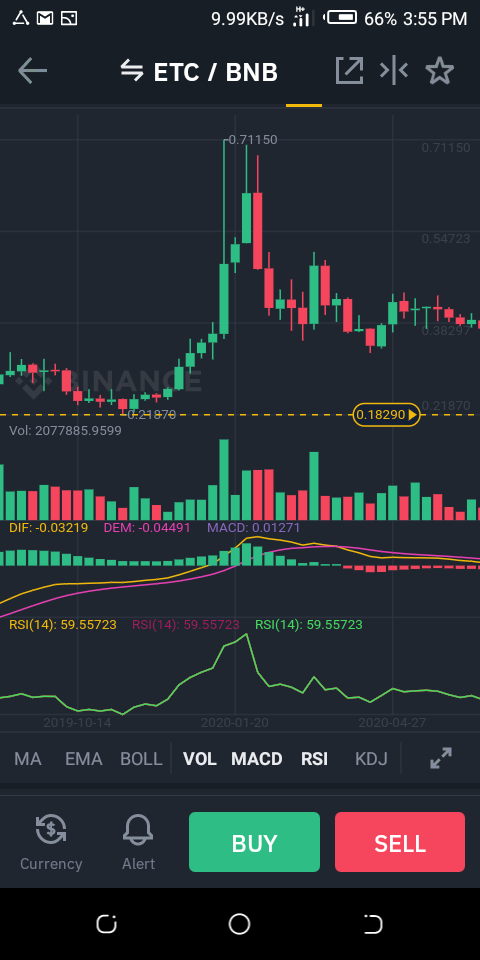
From the chart above , it can be seen that at 77.61409 ( an overbought signal) on the RSI indicator , there was a corresponding bullish trend which presents a perfect time to sell coins.
Hello @mary241,
Thank you for participating in the 4th Week Crypto Course in its second season and for your efforts to complete the suggested tasks, you deserve a 4/10 rating, according to the following scale:
My review :
In this work, You tried to present most of the basics of the RSI in general without knowing how to use them to answer the questions asked.
Thanks again for your effort, and we look forward to reading your next work.
Sincerely,@kouba01