Steemit Crypto Academy Season 3 Week 8 || Trading Sharkfin Pattern by @cryptokraze
"The hard work in trading comes in the preparation. The actual process of trading, however, should be effortless."
Jack Schwager
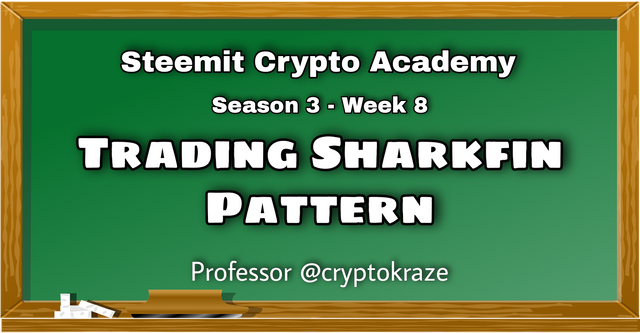
Image edited with PicsArt
Steemit Crypto Academy Season 3 Week 8 || Trading Sharkfin Pattern by @cryptokraze
The difference between success or failure in trading is the result of determination and perseverance, but even more important is the deep knowledge and mastery of the various tools for analysis that exist today, without which the trader would practically count only on his "intuition" to operate in the various markets.
In this article we will seek to explain one of these tools, as well as to present practical examples of their application in the cryptoasset universe.

Understanding Sharkfin Patterns
My understanding on Sharkfin Pattern is that we will be looking for patterns that can form an inverted V or V, taking advantage of market volatility, as simply put if the market direction is bullish and then rapidly changing, this could mark the inverted V, and otherwise, if the market direction is bearish and the market changes trend very quickly, it would mark V.
In the example below we can see an inverted V.
CARDANO - USDT with 30 minutes of timeframe
Image edited with PicsArt
So by looking for this pattern on the chart and using the Relative Strength Index (RSI) indicator, we can take advantage of market conditions that indicate that an asset is oversold or overbought, where for 14 periods and for an interval from 0 to 100, if the index is oscillating below 30, it will indicate oversold conditions, and above 70, overbought.
In this way we can detect possible changes in trends and take advantage of a good buy or sell entry to get the best benefit. This complements the fact that it is necessary to place possible Stop Loss and Take Profit orders to ensure a good entry or a possible exit on time.
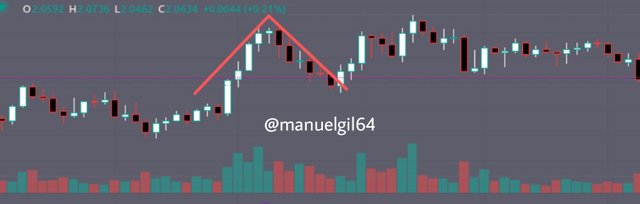
CARDANO - USDT with 30 minutes of timeframe. You can see the signal from the RSI indicator below
Image edited with PicsArt
Implementing RSI indicator to spot Sharkfin Patterns
As we mentioned at the beginning of this article, not only is it enough to suspect a possible Sharkfin Pattern, but also as a trader it is necessary to use indicators to be able to get possible entry or exit signals.
For this article we are using the RSI indicator which will be used to predict changes in trends, although it is also useful to detect resistance levels and support levels, and in this way with bullish or bearish divergences we can find a possible signal that we are about to enter a Sharkfin Pattern, this by checking if the market is losing or gaining "momentum" (If it wins, it is reinforced despite the decline and then change the trend and rise, while if it loses momentum in an upward direction , it may change trend and start to decline).
It is important to mention again that no indicator is 100% accurate, and with practice and the use of higher indicators the trader will have greater expertise when analyzing the market, an example is the second image in this article already mentioned above where the V it was not completed, and depending on the entry point it could bring little profit or even loss.
Finally in this article we are looking at the Sharkfin Patterns in TradingView on Cardano and then we are going to implement the RSI indicators.
CARDANO - USDT with 30 minutes of timeframe (July 9)
Image edited with PicsArt
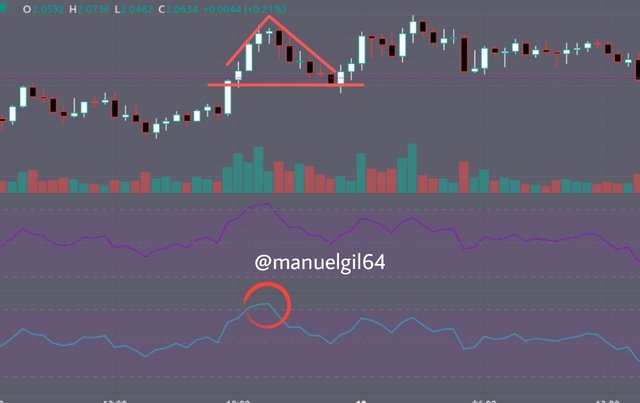
In this graph we can see an example of a Sharkfin Pattern of a bearish to bullish trend change, where the value of Cardano starting from 1:30 am of $ 1.34 fell to $ 1.29 at 3 am, and then rose, in 4 hours (7 pm), again at $ 1.34.
At 2:30 am, the RSI indicator managed to be below 30, which is an indicator of an oversold condition in the market, which is a possible sign that there could be a change in trend (which it was) , because consequently at 3 am the price went up again. Now we will see another example with the inverted V, that is, a change from an uptrend to a bearish one.
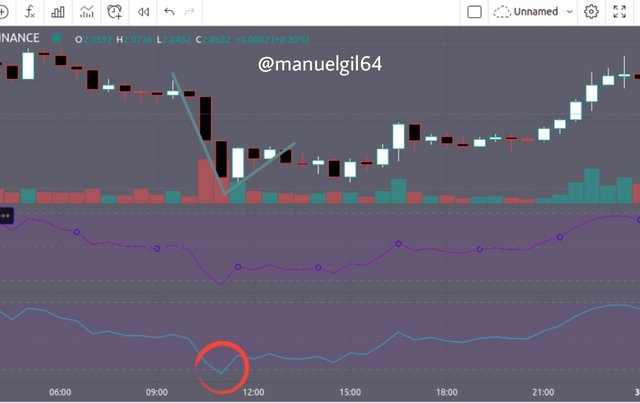
CARDANO - USDT with 30 minutes of timeframe from August 19
Image edited with PicsArt
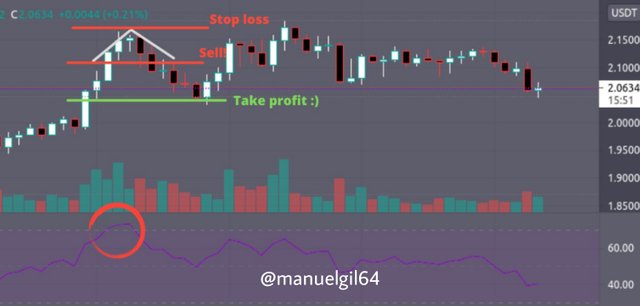
In this graph we can see the upward trend in the price of Cardano, until it exceeds 70 of the RSI indicator, which means an overbought signal in the market, and launches a possible trend change signal. In this example, in about 12 hours, Cardano rose in price from $ 2.06 to a ceiling of $ 2.15 and then fell to $ 2.06 again.
Write the trade entry and exit criteria to trade Sharkfin Pattern
Entry Criteria for Buy Position
First it is necessary to have the RSI index configured with the default values.
Second, we must wait for the price to make a fast movement and going back in the price as in the RSI indicator to detect a pattern similar to a .
Third, once the RSI indicator falls below 30 and rises again to exceed 30, then just make the purchase. But you have to wait for him to pass 30 again.
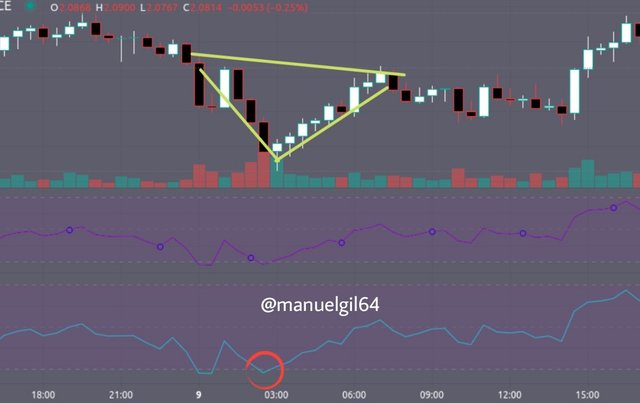
CARDANO - USDT with 30 minutes of timeframe
Image edited with PicsArt
Exit Criteria for Buy Position
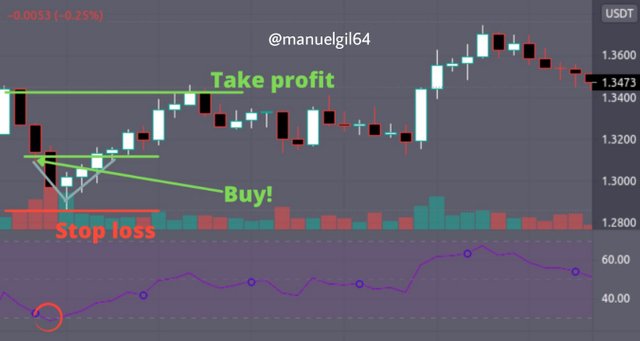
We create a Stop Loss order which will allow us that in case it is a false signal after the entry of the purchase of an asset, it can be exited reducing the losses caused. This has to be a certain amount below the price marking when the RSI falls below 30.
And on the other hand, a Take Profit order is created which is generally the same distance from the entry - stop loss. In other words, if we enter $ 1.30 and our Stop Loss is at $ 1.28, then the Take Profit could be around $ 1.32.
Entry Criteria for Sell Position
Again it is necessary to have the RSI index configured with the default values.
Second, we must wait for the price to make a fast movement and going back in the price as in the RSI indicator to detect a pattern similar to a /.
Third, once the RSI indicator passes 70 and falls again to exceed 70, then make the sale. It is also necessary to wait for it to pass 70, and this is because it could continue to rise and form another shark fin.
CARDANO - USDT with 30 minutes of timeframe
Image edited with PicsArt
Exit Criteria for Sell Position
After the entry we create a Stop Loss order in case the trade goes in the opposite direction to the one we are estimating. This will be at the highest point of the shark fin, that is, the highest point of oscillation, and in this way we guarantee that in an error, we can get out.
Again, a Take Profit order of RR 1: 1 type is made for when the operation follows the desired direction, the profits can be obtained.
Placing at least 2 trades based on Sharkfin Pattern strategy
1️⃣ Trade #1
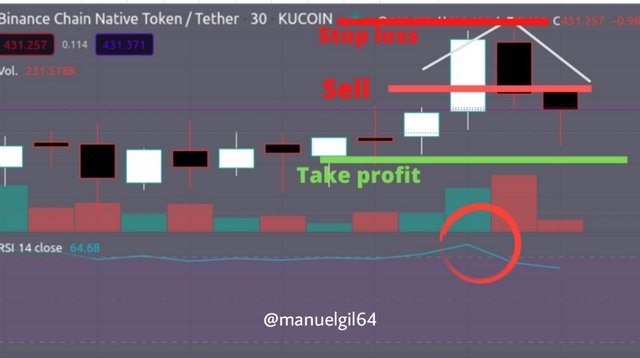
Image edited with PicsArt
In the following graph you can see how I took advantage of the Sharkfin Pattern to place a sell order for some BNB that I had held. In this case on August 20 at 1:30 UTC the RSI index exceeded 70 with a value of $ 430, then it reaches a maximum of $ 435 with the RSI index at 75, there it begins to change direction, and once that goes below 70, the sell order is placed at a price of $ 430.
On the other hand I am estimating that when the price drops to $ 425, it could be another entry point to buy and thus obtain the profits.

Image edited with PicsArt
2️⃣ Trade #2
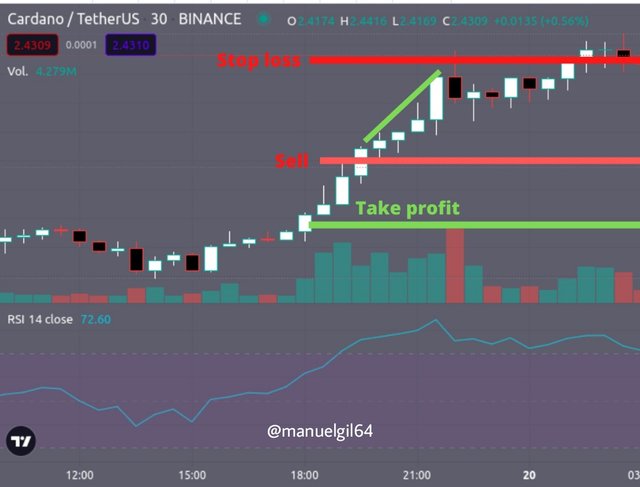
Image edited with PicsArt
As the professor mentioned, it is necessary to place a Stop Loss order just above what would be the shark fin on the chart, then at 19:00 UTC the RSI index manages to exceed 70 with a price of $ 2.25, and then After exceeding $ 2.39, the price continued to rise until reaching a new peak at $ 2.44 which was the price where I made the sale exiting the strategy, however, I managed to sell high and I hope the price will fall again, perhaps to $ 2.15 to make a new entry

Image edited with PicsArt
Conclusions
The Sharkfin Pattern is an excellent tool that together with the Relative Strength Index (RSI), allows us to take advantage of possible changes in trends when market conditions are that the price of the cryptocurrency is overbought or oversold, and thus get the best profit.
But this added to the entry and exit criteria, through risk management when placing stop loss and take profit orders, allows us to know where we want to go and to what point we decided to withdraw because the pattern was not completed, and wait for a new setup.
Although in my second example the Sharkfin Pattern did not complete, at least I managed to make a little more profit than I had projected, and if it had been a buy entry, it could have left the market before probably having more losses. This is undoubtedly an excellent tool when trading.
This is my Homework Post for Steemit Crypto Academy Season 3 Week 8 || Trading Sharkfin Pattern by Professor @cryptokraze


twitter-promotion
Congratulations, your post has been upvoted by @dsc-r2cornell, which is the curating account for @R2cornell's Discord Community.
Enhorabuena, su "post" ha sido "up-voted" por @dsc-r2cornell, que es la "cuenta curating" de la Comunidad de la Discordia de @R2cornell.
Gracias @dsc-r2cornell y @blessed-girl por el apoyo 🤗