Steemit Crypto Academy Season 3 Week 7 || How to create an account on TradingView, how to use indicators, tools, features of TradingView by Professor @yousafharoonkhan
"It is essential to have good tools, but it is also essential that the tools should be used in the right way."
Wallace D. Wattles

Image edited with PicsArt
Steemit Crypto Academy Season 3 Week 7 || How to create an account on TradingView, how to use indicators, tools, features of TradingView by Professor @yousafharoonkhan
In the mid-1970s, work began on how to digitize the processes within the stock market, since by then the procedure was completely manual, and after the stock market crash in 1987, the incorporation of technology into trading accelerated. That between 2001 and 2005 ended up being consolidated with new web platforms.
This brought radical changes, introduced online trading to the world. This consequently granted that the general public had access to the markets of stocks, currencies, commodities and nowadays cryptocurrencies.
In other words, it democratized the industry, introducing a new business model. Within trading there are different strategies, such as technical, fundamental, macroeconomic and quantitative analysis.
Today we will talk about TradingView, which is one of the best platforms to view charts and perform technical analysis in trading, and it also stands out for being low cost.
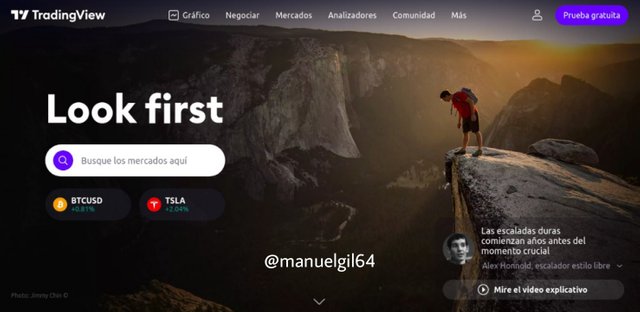
Image edited with PicsArt

How to register an account on TradingView?
TradingView is a great tool that has different features even in its free version, such as allowing you to have a chart open for each tab, you can add custom intervals, change the color palette with respect to the charts. Features that aid technical analysis such as lines and trends, patterns, annotations, and geometric figures.
It also has a stock screener that allows, under one criterion, to scan the market. It also has a feature that allows integration with Forex to filter and observe the current Forex markets.
In order to register with a free plan it is necessary to click on the Start free trial button shown in the previous image. Then scroll down to the try free basic button. All this is in the url of tradingview.com or in the first link when placing in Google: "TradingView" in order to access the web platform.

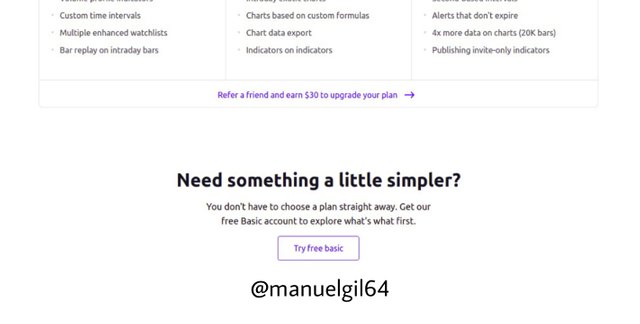
Image edited with PicsArt
Then a tab opens with the different ways to register: Via Google, Facebook, Yahoo !, Twitter, LinkedIn, Apple or a conventional registration by adding an email and filling in the basic fields. After registering in any way, you will ask to upload a profile photo on the platform in order to continue. I used the method of registering for the Google account.
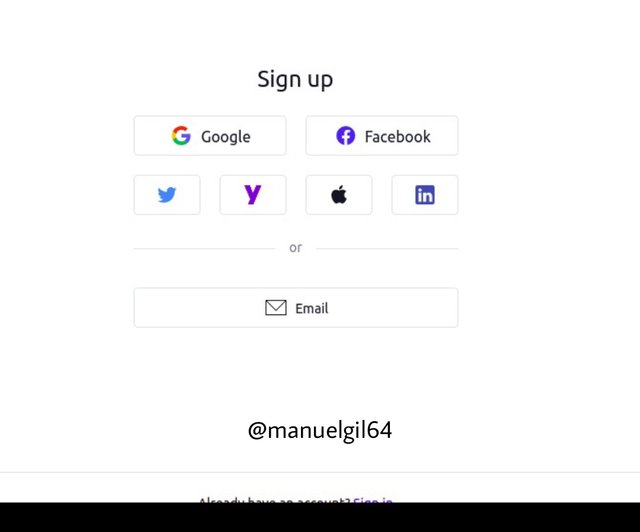
Image edited with PicsArt
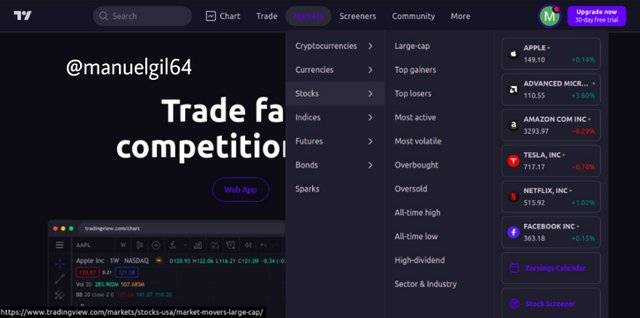
Image edited with PicsArt

Explain the different features of TradingView and what is your favorite feature and why?
One of the features that TradingView brings us is to be able to view a list of brokers and fill out a form to find out the necessary requirements to open an account in one of these. But what is a broker? Well, basically the broker is the entity that executes the orders in the market, and also charges commissions for offering this service, while the trader is the one that operates on the platform.
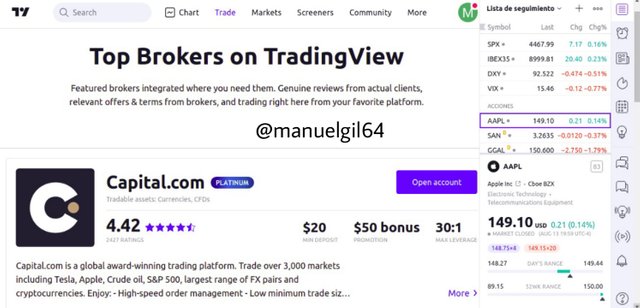
Image edited with PicsArt
Then we have the option of Markets, which are divided into: cryptocurrencies, currencies, stocks, market indices, even metals such as gold, resources such as oil, among others.
For example, to check the actions of Japan:
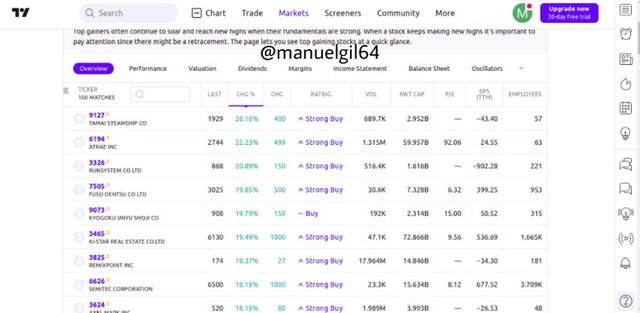
Image edited with PicsArt
With Screener you can make a scan or filter for the market, and in this way look for possible good opportunities to carry out trading, with a configuration of several parameters that are: metrics, deadlines and technical indicators (such as moving averages, Ichimoku Base Line, among others).
For example, to filter the Forex market:
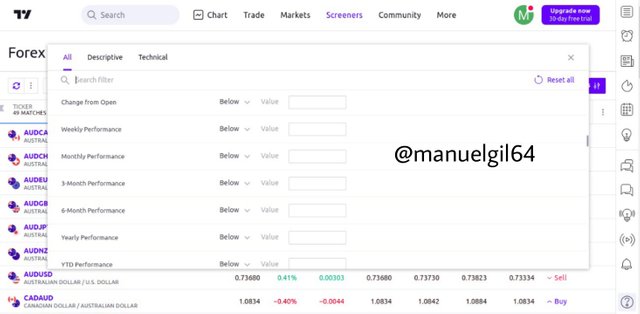
Image edited with PicsArt
Finally it also has a community where people can become Streamers, publish theory publications in technical analysis such as oscillators, moving averages, trend analysis, etc.
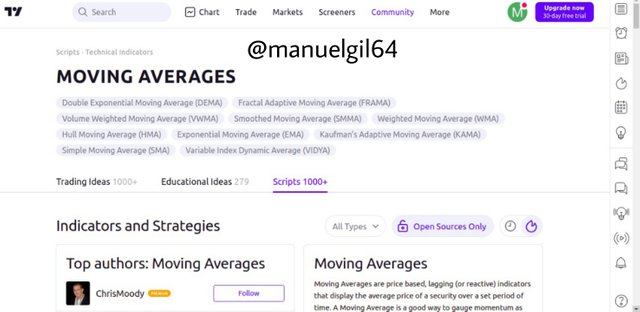
Image edited with PicsArt
Definitely TradingView is a fairly complete platform in the world of trading. However now we are going to show its main feature which are the charts.

How to set up a chart in TradingView and use two tools to edit it
I will show the graph of the cryptocurrency Cardano (ADA). Comparing the Cardano, which has surprised us in recent days with its great rise in value, with the stablecoin USD Tether (USDT) and taking the Binance exchange as a reference.
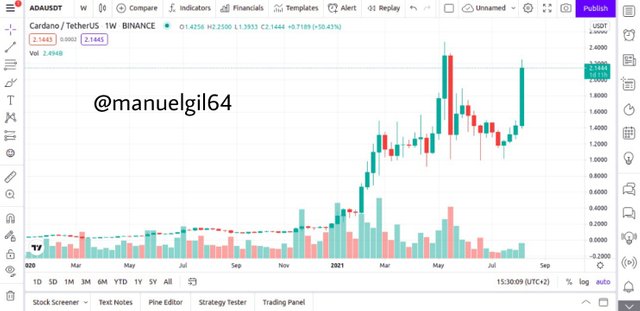
Image edited with PicsArt
To configure the chart we go to the Chart settings option, where we can modify See the symbols, status line, scales, appearance and even the events.
Personally, I really like a chart that is as minimalist as possible, sometimes I can configure it in black - white, or green - red candles, or at least place borders in green and red respectively.
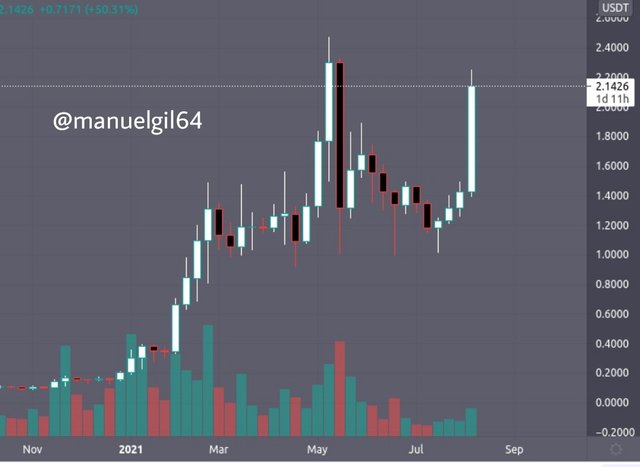
Image edited with PicsArt
In the bar on the left we have several tools to be able to edit the graph. I will use the most basic thing that will be arrows to indicate rises and falls of the value in what has been this year of the coin.
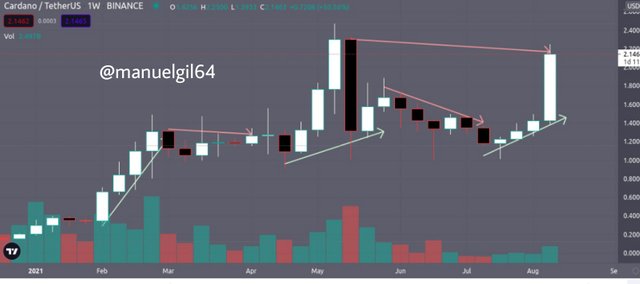
Image edited with PicsArt
At the time of writing this article, a very interesting topic came up with Cardano and that is that it was close to breaking $ 2.15, and as shown by placing the Fibonacci retracement, it could be a good entry signal pointing to a possible target towards the $ 2.40.
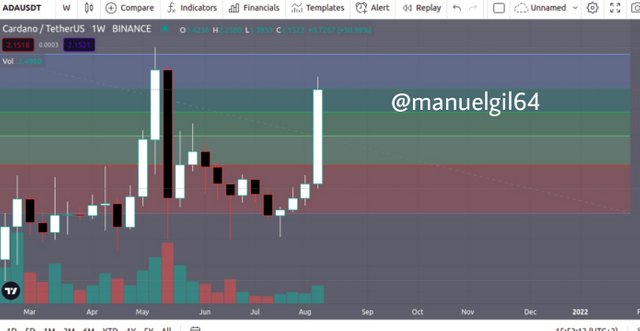
Image edited with PicsArt

Explain how to add indicator in chart, what is your favorite indicator and why?
To add an indicator, we go to the menu above and click the button that says "Indicators", there a modal opens where we can see indicators on candlestick patterns, volumes and even our own script (for premium accounts).
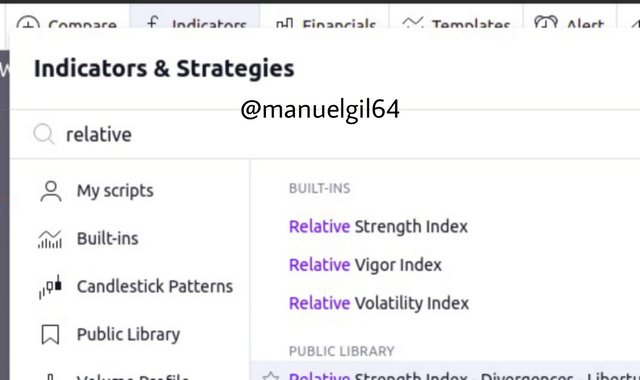
Image edited with PicsArt
The indicator that we are going to use is the Relative Strength Index (RSI), which is used to analyze the performance of a security over a period of time. In other words, it is a momentum oscillator that, given a period of time and a formula, divides the average gain that the price has had over that time, by the average loss that it has endured, and then translates that force into an adjustment scale between 0 and 100.
It is one of the main generic indicators that has been used in the stock market, and it serves as a signal to indicate whether there is an overbought or oversold of the asset in the market. If the indicator is below 30 it indicates that it is oversold (possibly near the ground), and above 70 it is overbought (near the ceiling).

Do you think TradingView is useful in predicting the market for cryptocurrency (trend / price)?
In the image below we can see that Cardano is close to triggering an overbought signal. This, as we can see in the Fibonacci sequence, could be a good indicator that it is still a good time to make a purchase or entry to the cryptocurrency. This added to the fundamental analysis of the project, which is quite promising and which is expected to have a great long-term future, Cardano is also a very good long-term investment option.
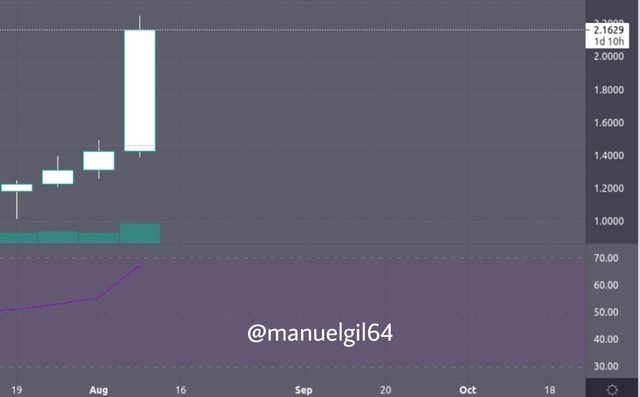
Image edited with PicsArt
TradingView is quite useful for carrying out technical analysis in general, since it has a wide variety of features that allow it. In addition, the Chart section has a great variety of tools and indicators, so for the cryptocurrency market it is useful to reach an approximation of trend and price, however, no indicator is 100% effective, therefore, although TradingView fulfills its role very well of offering a great web platform to edit, display indicators, in the end, in theory nothing assures us with total robustness and precision for an absolute prediction of trends and prices in the market.

Conclusions
Nowadays, thanks to the digital revolution in which we find ourselves, the general public has had the opportunity to enter sectors where before it could be a little more complicated, for example, to invest in shares in a private company it is necessary to have a high level of investment or be affiliated with a Stock Broker. Today you can enter the market with just one application on your cell phone, and perform operations quickly compared to the tedious process that had to be carried out in the past. The same that you can also access web platforms (and even free) such as TradingView to perform a better technical analysis due to its interface.
We know that for each indicator, depending on the parameters entered, they can be useful or not so useful depending on the market to be analyzed. For example, the divergences of the Relative Strength Index (RSI), which is when the price of an asset moves in one direction and RSI indicators in another, work best for markets that are not very volatile. And even so, it is always recommended to use several indicators when conducting a technical analysis, so TradingView fulfills its function in providing the tools but in the end it will depend on the trader on how to use these tools.
This is my Homework Post for Steemit Crypto Academy Season 3 Week 7 || How to create an account on TradingView, how to use indicators, tools, features of TradingView by Professor @yousafharoonkhan


twitter-promotion
Respected first thank you very much for taking interest in SteemitCryptoAcademy
Season 3 | intermediate course class week 7
your explained very well, but need more detail to explore the main points
thank you very much for taking interest in this class, keep continue good work
Thank you very much Professor for your feedback!
Congratulations, your post has been upvoted by @dsc-r2cornell, which is the curating account for @R2cornell's Discord Community.
Enhorabuena, su "post" ha sido "up-voted" por @dsc-r2cornell, que es la "cuenta curating" de la Comunidad de la Discordia de @R2cornell.
Gracias por el apoyo. Saludos